
Greetings friends, a few days ago I wrote about What’s New in Veeam Backup for Microsoft 365 v6, with all sorts of details around New Features, screenshots, diagrams, and what not. As per every release, there is always deep under the hood that can be leveraged in certain situations.
With the latest Release, Veeam has done a giant leap forward by expanding the Restore Capabilities to Restore Operators, and even opening to all the rest of End-Users if required. As Customers or Service Providers upgrade to v6 and start creating Restore Roles, with Restore Operators, getting full visibility across all of these can be tedious. Thanks to the new and Enhanced API Endpoints included on Veeam Backup for Microsoft v6, we could achieve a much better, comprehensive, secure, and holistic overview.
Combining all of the new Endpoints and making something useful
While I finish another small project, which is to create a simple HTML Report with all of this, I have decided that the thing that will make the most sense is to show you how these new endpoints could be leveraged in a real environment.
Introducing the Grafana Dashboard for Microsoft 365 v6
This dashboard itself is not new, as it has been with us since VBO v3, and the first dashboard was published in 2018 (that is four years ago if you were thinking it was yesterday). But this new iteration has some much great goodness on it:
What’s new on the Veeam Backup for Microsoft 365 v6 Dashboard:
- All the queries and the variables have been migrated to InfluxDB v2, and Flux Queries.
- Moved legacy Grafana panels (like old stat, or old graph) to newer components like time-series panel, or new stat, etc.
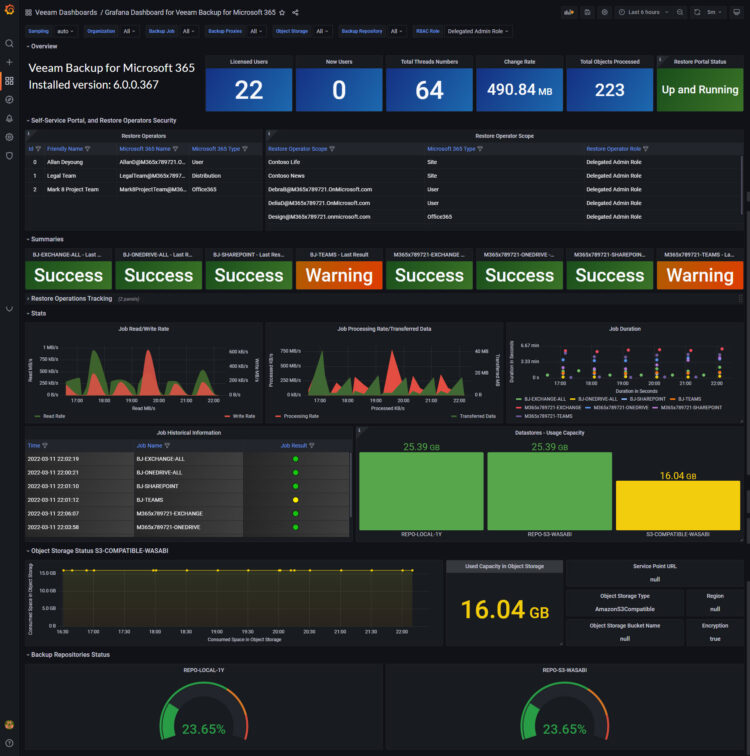
- Leveraged the new VBM365 v6 API Endpoints to
- Show the version right on the top left
- Display if the Self-Service Portal is running or not, top right
- Add the Restore Roles as Variables, they can be selected from the drop-down
- Two main tables under a new row, Restore Operators and Restore Operator Scope
- Improved the Session table, making it the same look and feel that the Enterprise Managed Dashboard
How to start with all of this?
- It is actually really simple – Grab the latest script from the Veeam Hub: https://raw.githubusercontent.com/VeeamHub/grafana/master/veeam-backup-for-office365-grafana/veeam_microsoft365.sh give it chmod +x, and run it, then schedule it.
- Download the Grafana Dashboard, import it. Done. https://grafana.com/grafana/dashboards/11286
If any problem, please let me know.
Now that we have seen a real use-case, let’s dig deep on the new, or enhanced endpoints.
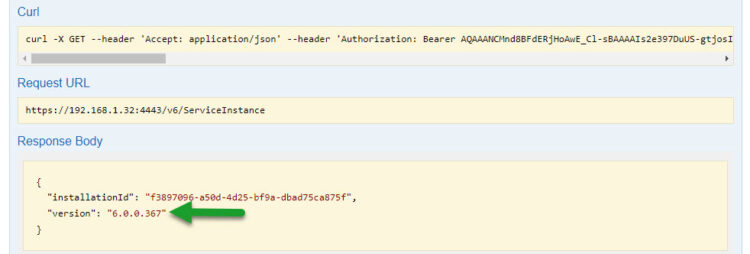
NEW ServiceInstance API Endpoint
This API is a very simple one, we can query this simple endpoint to understand on which version we are, and perhaps validate it vs official Veeam KB on Releases and trigger an alert if we are not on the latest version:
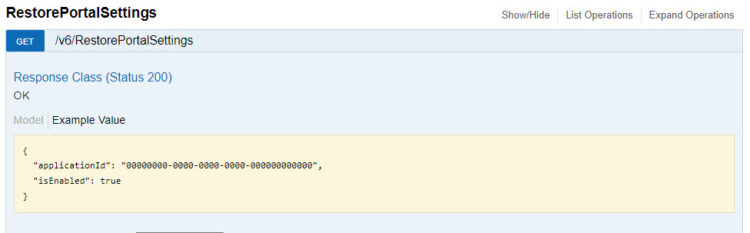
NEW Self-Service Portal API Endpoint
Another simple one, so later you do not tell me navigating on the API is difficult :), on this case this very simple endpoint will tell us if the Self-Service Portal is enabled or not. Why this is important? Well, we should control if a web portal to trigger restores like this is enabled, and if so, make sure it is protected as it should be, using valid and trusted SSL certificates, only exposed through VPN perhaps, or from certain IPs, etc.
I think this should trigger right away an alert to your favorite SIEM, in case anything changes, imagine disabled to enabled, etc.
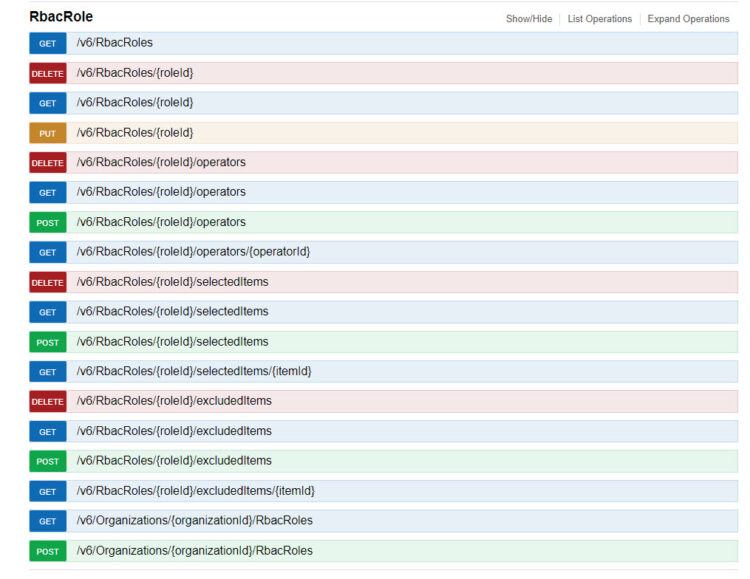
NEW RBAC API Endpoint
Alright, as this new functionality provides so great rich experience, it is the one that includes the bigger amount of new endpoints. From here you can quickly check the different roles you have, the operators assigned to them, and the scope they have access to, plus the exclusions.
This is definitely one of the new endpoints that we will spend more of our time:
Enhanced RestoreSession API Endpoint
With the new Release of the VBM365 v6, and the ability to change between scopes (Restore Operators), we can now find a piece of much better information on the RestoreSession API Endpoint, let’s take a look:
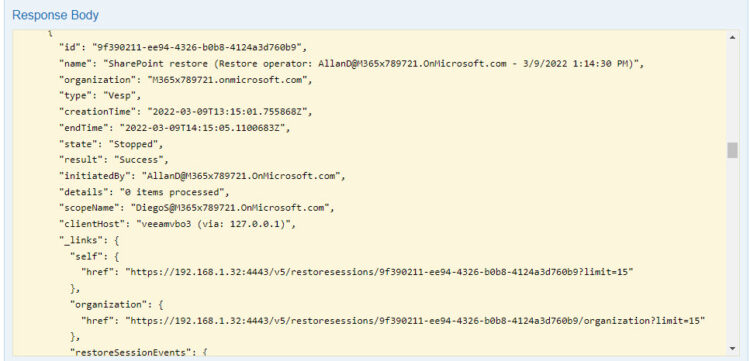
It is really great to be able to see on the Restore Session name all the information, like who opened it, and which role he was in (Restore Operator on this case), we can see it was a Veeam Explorer for SharePoint, it didn’t restore anything at the end, and the scope he was using it was Diego, we can also see the client host if 127.0.0.1 the Self-Service Portal was used.
A few other changes have happened on the physical logs themselves, splitting them per job, etc. We will cover those on another blog.
Hope this deep-dive into something like Enhanced Security, and Observability has been useful to you.
Leave a Reply