
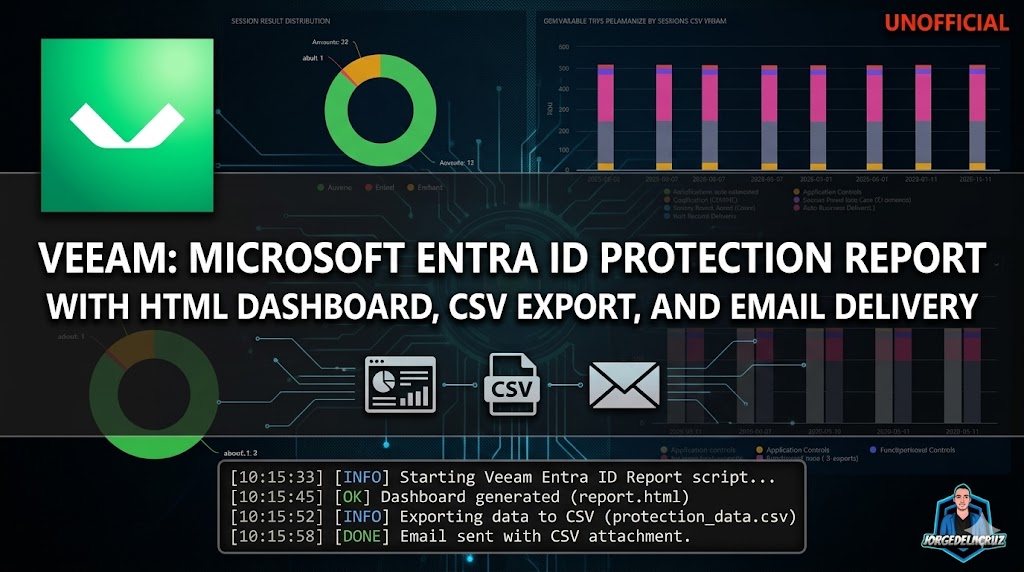
Greetings friends, today we are going to take another step into proper reporting, visibility, and analytics around one of the most important workloads customers are starting to protect more and more: Microsoft Entra ID. I was looking at the new Microsoft Entra ID backup data inside Veeam Backup & Replication, and I thought: this is great,
Veeam: An open-source, gorgeous backup UI for Veeam built with NextJS
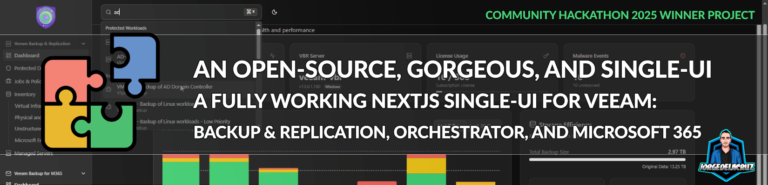
Greetings friends, for years I have been writing about Veeam APIs. I have done many fun projects: Grafana Dashboards, HTML Reports, PowerShell Scripts, etc. This year, while participating at the third Veeam Community Hackathon, a new project (and a new opportunity) appeared. Why not to try to build an open-source, fresh, and open backup ui for
Veeam: How to securely rotate passwords on Veeam Software Appliance v13 (not supported)
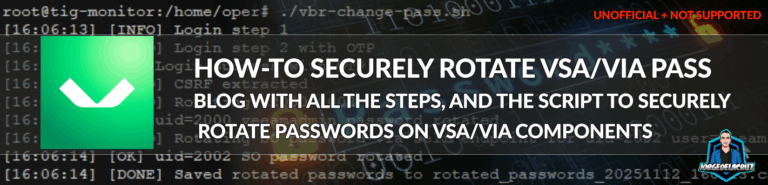
Greetings friends, today we start with some well deserved empathy, especially after an amazing Veeam 100 event in Prague. If you have upgraded to Veeam Software Appliance, and deployed the VSA + components based in JeOS, I am sure you have already felt the pain of rotating dozens of local OS passwords across Veeam Software Appliance, Hardened
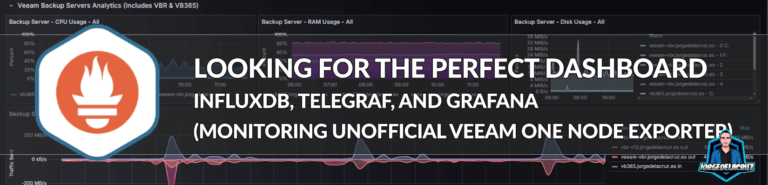
Looking for the Perfect Dashboard: InfluxDB, Telegraf, and Grafana – Part XLIX (Monitoring Unofficial Veeam ONE Node Exporter)
Greetings friends, in case you are not aware. Veeam has released an early release of Veeam Software Appliance; a pre-built, pre-hardened, predictable linux appliance that can be deployed super fast and secure. Anton Gostev talks about initial numbers in his latest LinkedIn update, and it is absolutely mind-blowing the current statistics, especially
Supermicro: How-to fix unable to mount ISO on IPMI when using SMB
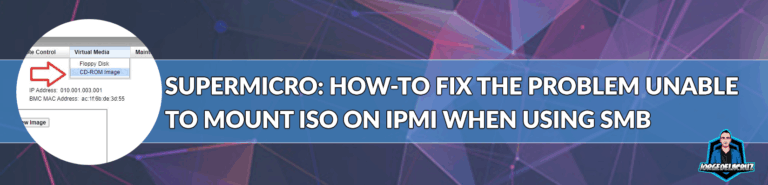
Greetings friends, these latest days I am upgrading my home lab environment to be ready for the upcoming Veeam Software Appliance. Whilst doing this, of course you would like to attach some .iso to your different Supermicro. But whilst doing it so, I faced a weird problem using the HTML5 iKVM Interface for Supermicro IPMI, I have a valid license