
 Greetings friends, Veeam Backup for Microsoft 365 has been with us for a few weeks already. And within this great product, comes a lot of new ideas and possible functionalities, integrations, etc.
Speaking with Mike Resseler, Senior Director of Product Management, who owns VB365 and many other initiatives, we had the idea to enhance a bit the Restore Portal Audit leveraging Microsoft Graph.
Grafana Dashboard to audit User Logins, and Restores on VBM365 Restore Portal
When you finish the entry you will have something similar to this Dashboard:
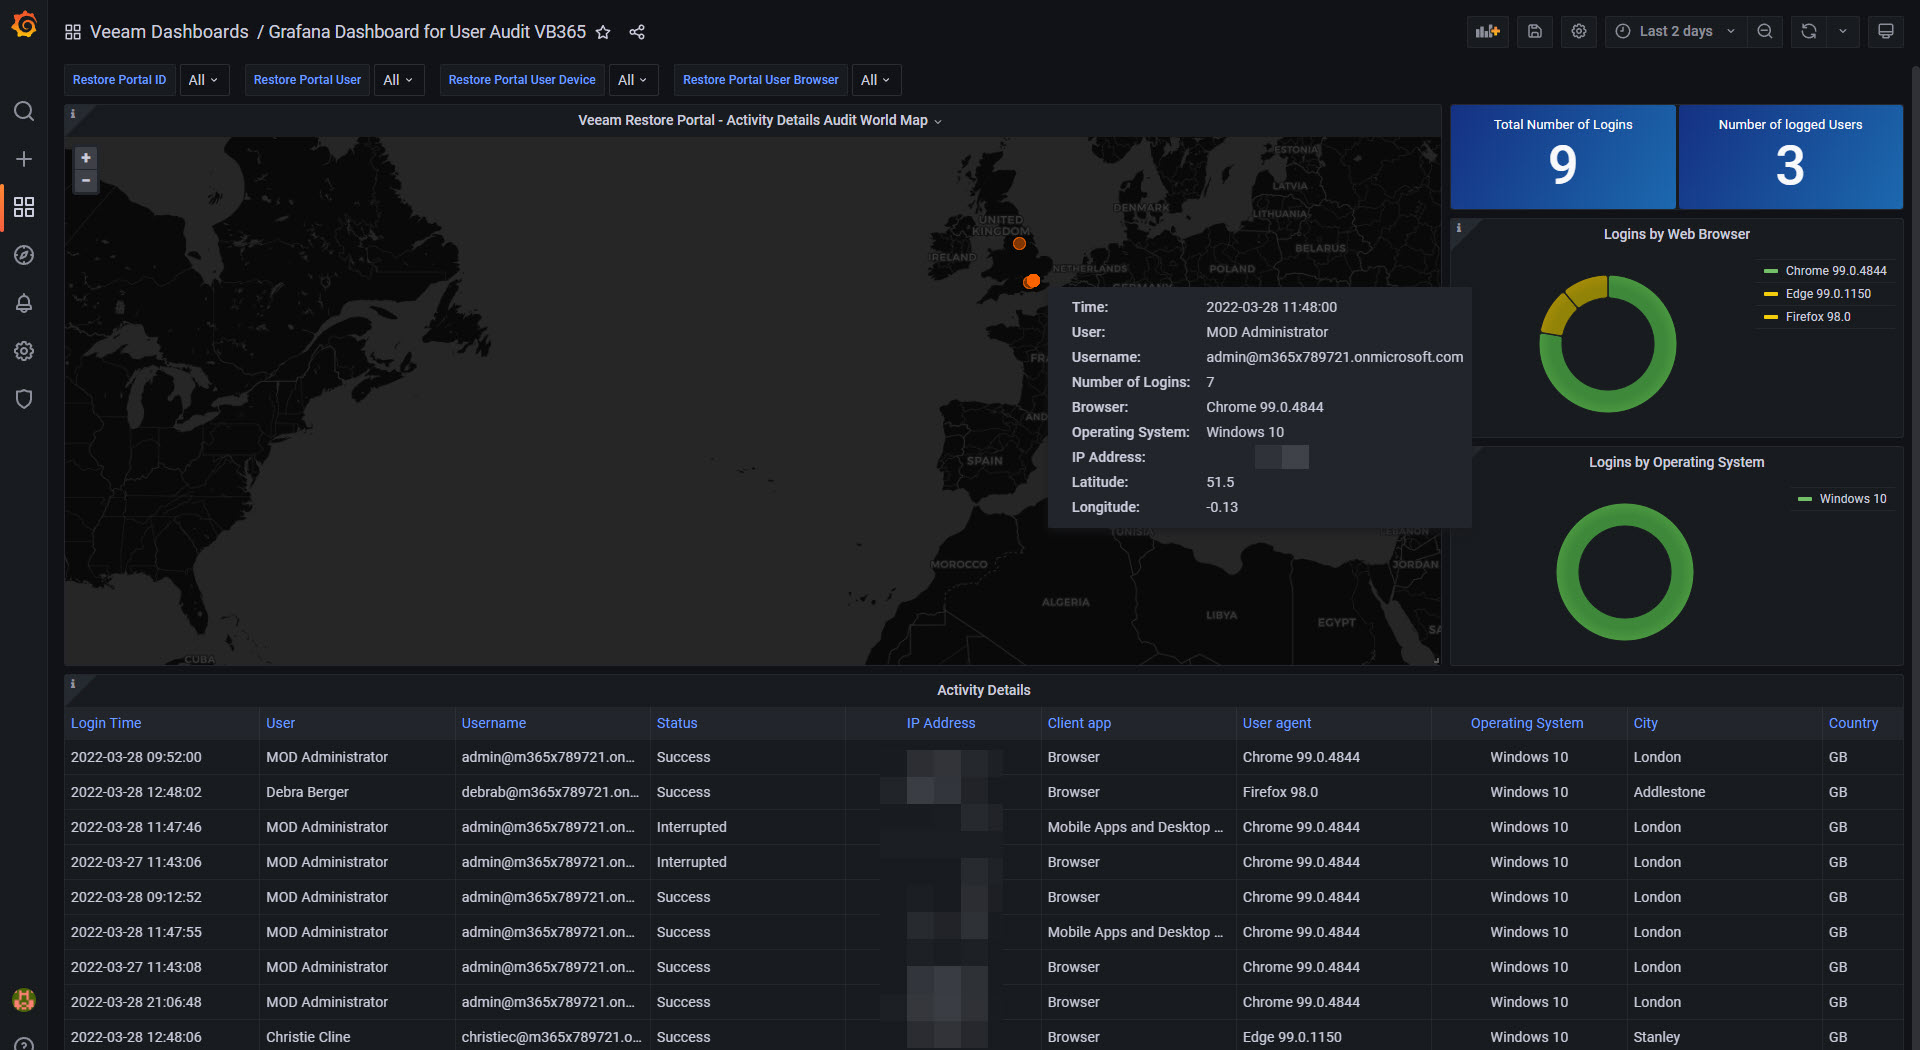
Dashboard – Summary
- World Map – A World Map that shows a geolocate position for every user who has logged in to the portal, how many times has done so, User Name, Display Name, etc.
- Summary (Widgets on the right) – Total number of Logins, the total number of users who have logged in on the specific time
- Table – A detailed table with all the Audit details, like Username, Display Name, IP address, time that login occurred, City, etc.
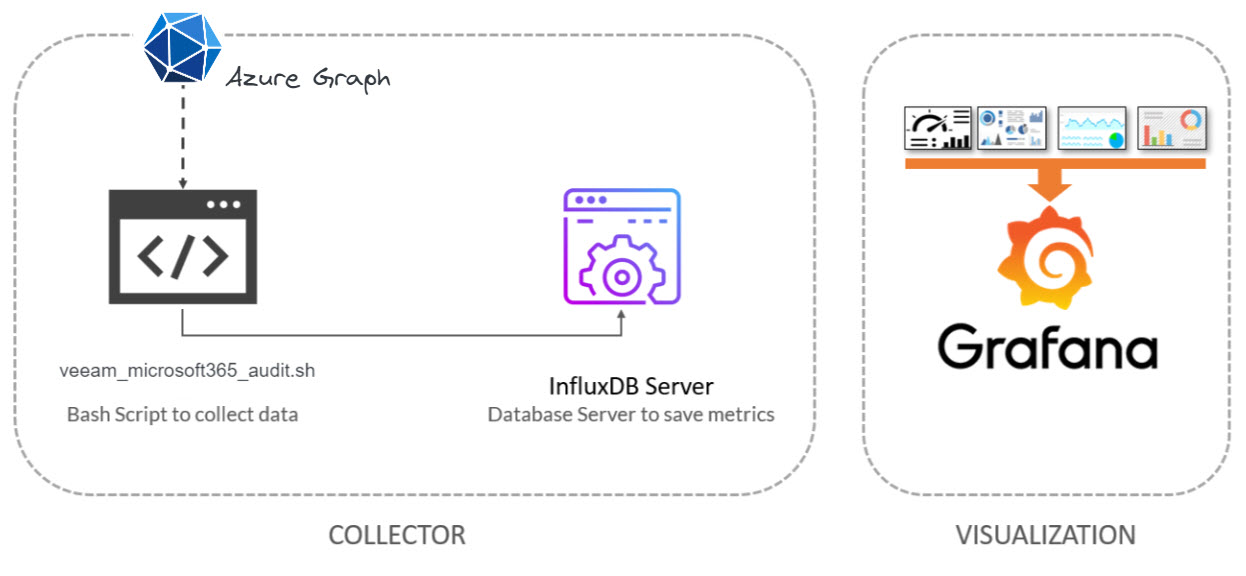
How does it work:
- Pulls the data directly from Azure Graph (meaning no queries or saturation to the Veeam components)
- Collects them on Bash Shell, and send them to InfluxDB
- A final Grafana Dashboard on top using variables, meaning this works on any Customer, or VCSP who has these components
What does it monitor?
It does give us a ton of information, but the most important for example:
- GeoLocate of the Login, so we can quickly identify if there are strange logins from Countries where we do not have users
- Browser, and Operating System
- How many times has this user has logged in to the Portal
- Username, and Friendly User Name
Why do we need this?
This is not for everyone, not at least in this shape or form (InfluxDB, Linux, Grafana). It will fit VCSP, or Enterprises with knowledge, or which already are using InfluxDB, Grafana.
- Basic Monitoring of a Web Application
- To be compliant with different policies, including SIEM, and proof that the access is being restricted to backups, etc. GDPR mentions this (document the parties with whom the data is shared), but as soon as we mix PCI DSS and HIPAA, these will demand advanced threat monitoring and management of them.
- To prevent misuse of the Restore Portal, which is a Web Application, it could be targeted and bruted force (although the login happens on Azure anyways)
- To give the NOC, and operations team, a single view of where to consume the logins to the Portal
Topology with all logical components
This entry is very similar to the previous ones, we will use a shell script to collect the User Logins to our Veeam Restore Portal metrics using Azure Graph. The design would be something similar to this:
Microsoft 365 Azure AD Requirements
This step is important, and it is what unlocks the magic. So at the moment, we do have an Azure Enterprise Application, that Veeam automatically generates and pushes to our Azure AD, I am talking about the Restore Portal.
And, as said, we want to use Graph to access the Users Logins, this means we will need a Bearer Token, and then Graph needs to read inside the application itself. So, let’s take a look at the two small steps we require.
Adding Graph Privileges, and Grant Admin
We will need just two privileges from Graph to our Veeam Restore Portal App Registration:
- Microsoft Graph – AuditLog.Read.All
- Microsoft Graph – Directory.Read.All

Do not forget to give them Grant admin consent. Once your screen looks similar to mine, please pass to the next step.
Generate a new Certificate/Secret
I know there are better ways to secure the Secret, using some libraries, or copying/pasting when it asks for it. But anyway, I will expect the Linux Server from where you run the script to be quite secure.
Under Microsoft 365, still under the Veeam Restore Portal App Registration, we go to Certificates & Secrets, and create a new one, please bear in mind you need to copy the Value right away, as there is no way to retrieve it later on, you will need to create another one. This will be our AccessSecret for later.
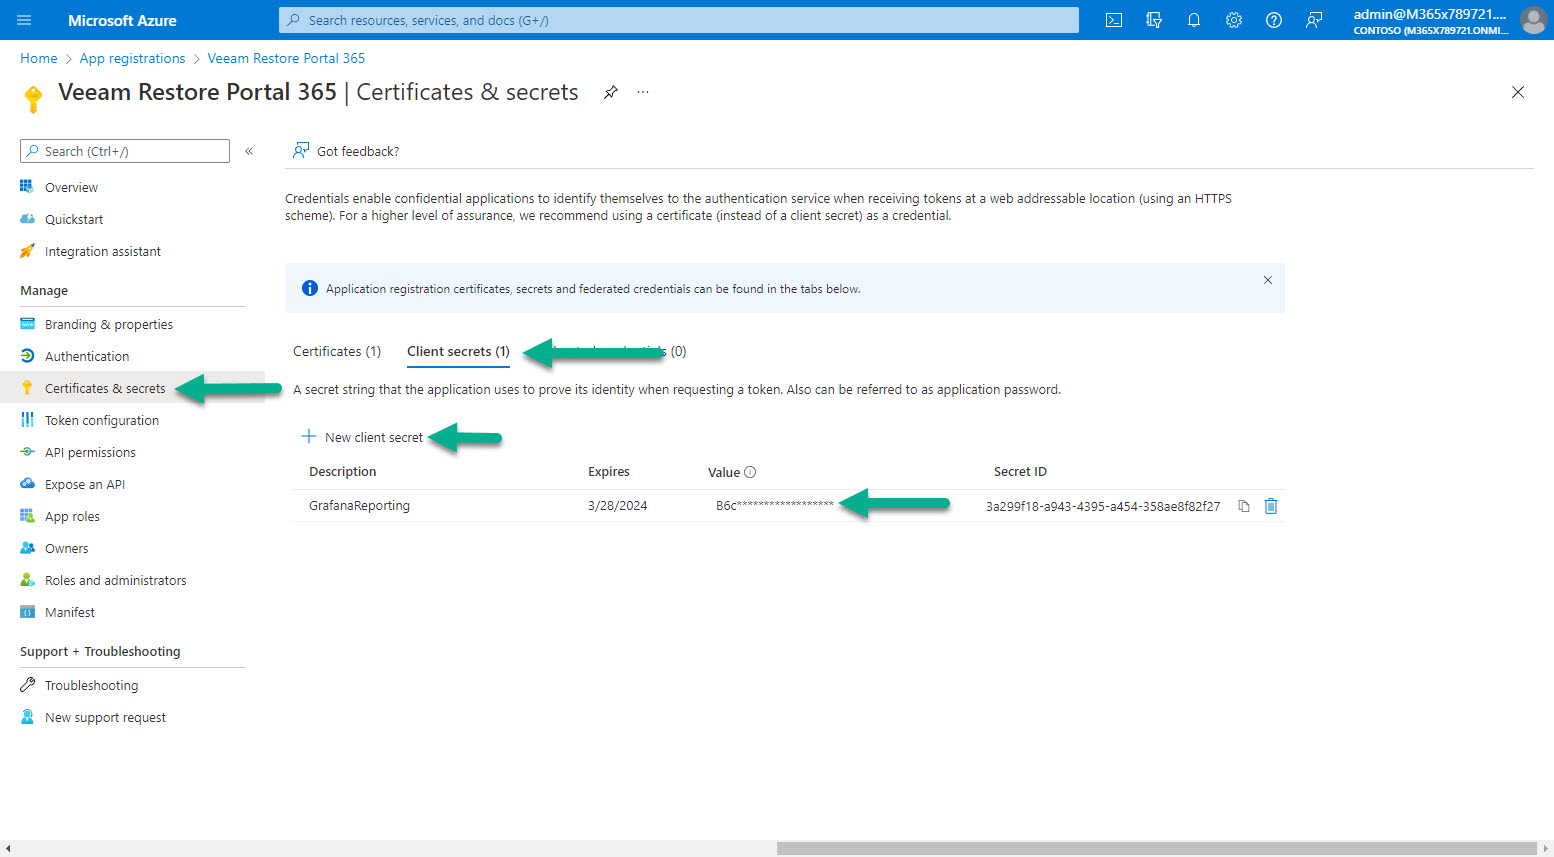
That’s it.
Download and configure the veeam_microsoft365_audit.sh script
We have almost everything ready, we have one last step, the script that will make all this work, we will download the latest version from the Github repository:
This shell script can be downloaded and run from the telegraf server, InfluxDB, or any other Linux. We will have to edit the configuration parameters:
##
# Configurations
##
# Endpoint URL for InfluxDB
veeamInfluxDBURL="http://YOURINFLUXSERVERIP" #Your InfluxDB Server, http://FQDN or https://FQDN if using SSL
veeamInfluxDBPort="8086" #Default Port
veeamInfluxDBBucket="veeam" # InfluxDB bucket name (not ID)
veeamInfluxDBToken="TOKEN" # InfluxDB access token with read/write privileges for the bucket
veeamInfluxDBOrg="ORG NAME" # InfluxDB organisation name (not ID)

# Endpoint Configuration for Azure AD
ApplicationID="YOURAPPLICATIONID" # You can find these on your VB365 Server, on the Restore Portal, or in Azure
TenatDomainName="YOURTENANTDOMAINNAME" # Easy to find this on the next URL - https://portal.azure.com/#blade/Microsoft_AAD_IAM/TenantPropertiesBlade
AccessSecret="YOURACCESSSECRET" # Create a new Client secret under your Veeam Restore Portal App registrations in Azure
Once the changes are done, make the script executable with chmod:
chmod +x veeam_microsoft365_audit.sh
The output of the command should be something like the next, without errors:
HTTP/2 204
x-influxdb-build: OSS
x-influxdb-version: 2.1.1
date: Tue, 29 Mar 2022 11:39:50 GMT
If so, please now add this script to your crontab, like for example every 30 minutes:
*/30 * * * * /home/oper/veeam_microsoft365_audit.sh >> /var/log/veeam_microsoft365_audit.log 2>&1
We are ready to move to the next step.
Grafana Dashboards
I created a Dashboard from scratch by selecting the best requests to the database, finishing off colors, thinking about graphics, and how to display them, and everything is automated so that it fits our environment without any problem and without having to edit anything manually. The Dashboard can be found here, once imported, you can use the top drop-down menus to select between organizations, backups, repositories and proxies, VMs, etc.:
Import Grafana Dashboards easily
So that you don’t have to waste hours configuring a new Dashboard, and ingesting and debugging what you want, I have already a wonderful Dashboard with everything you need to monitor our environment in a very simple way, you will be like the image I showed you above. Select the name you want and enter the ID: 12204, which is the unique ID of the Dashboard, or the URL:
 With the menus above you can display and adjust the Dashboard to your different choices:
Please leave your feedback in the comments, or on GitHub.
I hope you like it, and I would like to leave you the complete series here, so you can start playing with the plugins that I have been telling you about all these years:
- Looking for the Perfect Dashboard: InfluxDB, Telegraf, and Grafana – Part I (Installing InfluxDB, Telegraf, and Grafana on Ubuntu 20.04 LTS)
- En busca del Dashboard perfecto: InfluxDB, Telegraf y Grafana – Parte II (Instalar agente Telegraf en Nodos remotos Linux)
- En busca del Dashboard perfecto: InfluxDB, Telegraf y Grafana – Parte III Integración con PRTG
- En busca del Dashboard perfecto: InfluxDB, Telegraf y Grafana – Parte IV (Instalar agente Telegraf en Nodos remotos Windows)
- En busca del Dashboard perfecto: InfluxDB, Telegraf y Grafana – Parte V (Activar inputs específicos, Red, MySQL/MariaDB, Nginx)
- En busca del Dashboard perfecto: InfluxDB, Telegraf y Grafana – Parte VI (Monitorizando Veeam)
- En busca del Dashboard perfecto: InfluxDB, Telegraf y Grafana – Parte VII (Monitorizar vSphere)
- En busca del Dashboard perfecto: InfluxDB, Telegraf y Grafana – Parte VIII (Monitorizando Veeam con Enterprise Manager)
- En busca del Dashboard perfecto: InfluxDB, Telegraf y Grafana – Parte IX (Monitorizando Zimbra Collaboration)
- En busca del Dashboard perfecto: InfluxDB, Telegraf y Grafana – Parte X (Grafana Plugins)
- En busca del Dashboard perfecto: InfluxDB, Telegraf y Grafana – Parte XI – (Monitorizando URL e IPS con Telegraf y Ping)
- Looking for the Perfect Dashboard: InfluxDB, Telegraf, and Grafana – Part XII (Native Telegraf Plugin for vSphere)
- Looking for the Perfect Dashboard: InfluxDB, Telegraf, and Grafana – Part XIII (Veeam Backup for Microsoft Office 365 v4)
- Looking for the Perfect Dashboard: InfluxDB, Telegraf, and Grafana – Part XIV – Veeam Availability Console
- Looking for the Perfect Dashboard: InfluxDB, Telegraf, and Grafana – Part XV (IPMI Monitoring of our ESXi Hosts)
- Looking for Perfect Dashboard: InfluxDB, Telegraf, and Grafana – Part XVI (Performance and Advanced Security of Veeam Backup for Microsoft Office 365)
- Looking for the Perfect Dashboard: InfluxDB, Telegraf, and Grafana – Part XVII (Showing Dashboards on Two Monitors Using Raspberry Pi 4)
- En busca del Dashboard perfecto: InfluxDB, Telegraf y Grafana – Parte XVIII – Monitorizar temperatura y estado de Raspberry Pi 4
- Looking for the Perfect Dashboard: InfluxDB, Telegraf, and Grafana – Part XIX (Monitoring Veeam with Enterprise Manager) Shell Script
- Looking for the Perfect Dashboard: InfluxDB, Telegraf, and Grafana – Part XXIV (Monitoring Veeam Backup for Microsoft Azure)
- Looking for the Perfect Dashboard: InfluxDB, Telegraf, and Grafana – Part XXV (Monitoring Power Consumption)
- Looking for the Perfect Dashboard: InfluxDB, Telegraf, and Grafana – Part XXVI (Monitoring Veeam Backup for Nutanix)
- Looking for the Perfect Dashboard: InfluxDB, Telegraf, and Grafana – Part XXVII (Monitoring ReFS and XFS (block-cloning and reflink)
- Looking for the Perfect Dashboard: InfluxDB, Telegraf, and Grafana – Part XXVIII (Monitoring HPE StoreOnce)
- Looking for the Perfect Dashboard: InfluxDB, Telegraf, and Grafana – Part XXIX (Monitoring Pi-hole)
- Looking for the Perfect Dashboard: InfluxDB, Telegraf, and Grafana – Part XXIX (Monitoring Veeam Backup for AWS)
- Looking for the Perfect Dashboard: InfluxDB, Telegraf, and Grafana – Part XXXI (Monitoring Unifi Protect)
- Looking for the Perfect Dashboard: InfluxDB, Telegraf, and Grafana – Part XXXII (Monitoring Veeam ONE – experimental)
- Looking for the Perfect Dashboard: InfluxDB, Telegraf, and Grafana – Part XXXIII (Monitoring NetApp ONTAP)
- Looking for the Perfect Dashboard: InfluxDB, Telegraf, and Grafana – Part XXXIV (Monitoring Runecast)
- Looking for the Perfect Dashboard: InfluxDB, Telegraf, and Grafana – Part XXXV (GPU Monitoring)
- Looking for the Perfect Dashboard: InfluxDB, Telegraf, and Grafana – Part XXXVI (Monitoring Goldshell Miners – JSONv2)
- Looking for the Perfect Dashboard: InfluxDB, Telegraf, and Grafana – Part XXXVII (Monitoring Veeam Backup for Google Cloud Platform)
- Looking for the Perfect Dashboard: InfluxDB, Telegraf, and Grafana – Part XXXIX (Veeam Restore Portal Users Login Audit)
Leave a Reply