
 Greetings friends, on today’s article we are going to delve into an increasingly common issue faced by IT professionals across the globe – overcommitted vSphere clusters. As we all strive to do more with less in this rapidly evolving digital era, virtualization has been a godsend, allowing us to allocate resources to virtual machines (VMs) as needed. But, as with all good things, there’s a flip side that can sometimes come back to haunt us, it is normal and we all face this issue sooner rather than later.
In our quest to maximize the potential of our virtual environments, we often find ourselves creating VMs with X vCPU and Y RAM, typically far more than what our physical hardware can realistically support. This is okay, we every organization has some numbers to bend before becomes a problem.
This abstraction layer provided by virtualization technology indeed offers numerous benefits, but it can also lead to overcommitment if not managed prudently. In this blog post, we’ll explore how to keep an eye on overcommitted VMware clusters, ensuring that our virtual infrastructure remains healthy, efficient, and under control. So, buckle up and join me on this exciting journey into the world of virtualization data management!
Veeam ONE Custom Infrastructure Report
Every day, I find myself amazed by the versatility and potential of Veeam ONE. While the product comes loaded with a plethora of pre-built reports and alarms, its true magic emerges when customers explore and experiment with the technology themselves. One such hidden gem is the Veeam ONE Custom Infrastructure Report, a powerful report builder that enables you to choose from a wide array of elements within your virtual infrastructure, including hosts, VMs, folders, clusters, and more.
This customizable report not only provides a wealth of columns related to your selected elements, but it also allows you to group and perform mathematical operations on some of these columns – an incredibly useful feature when dealing with allocated resources.
In today’s discussion, we focus on addressing the issue of overcommitment using the Custom Infrastructure Report. However, keep in mind that this versatile tool will be your trusted companion in creating countless other reports and use-cases tailored to your specific needs.
Defining the scope, filters, and options
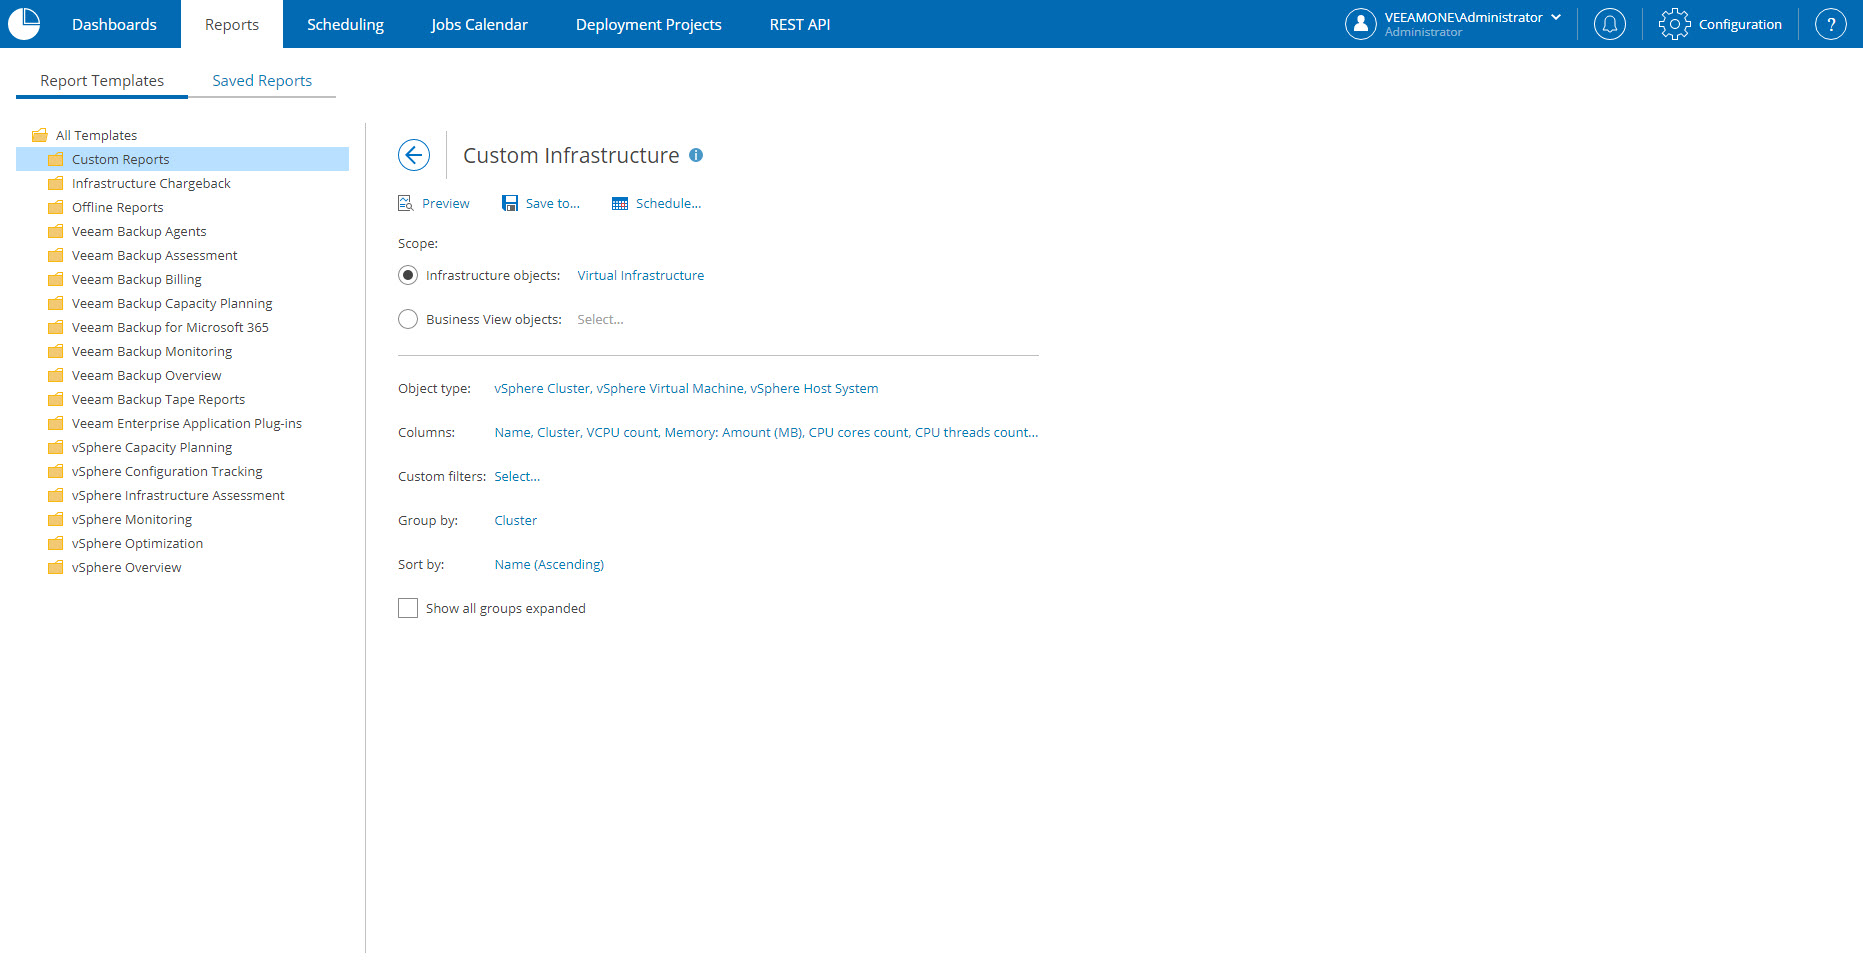
We can find this very useful report under Custom Reports, in our Veeam ONE Web Client. As you can see, I have already applied a few filters. On the Object type, I have selected vSphere Cluster, vSphere Virtual Machine, and vSphere Host System:
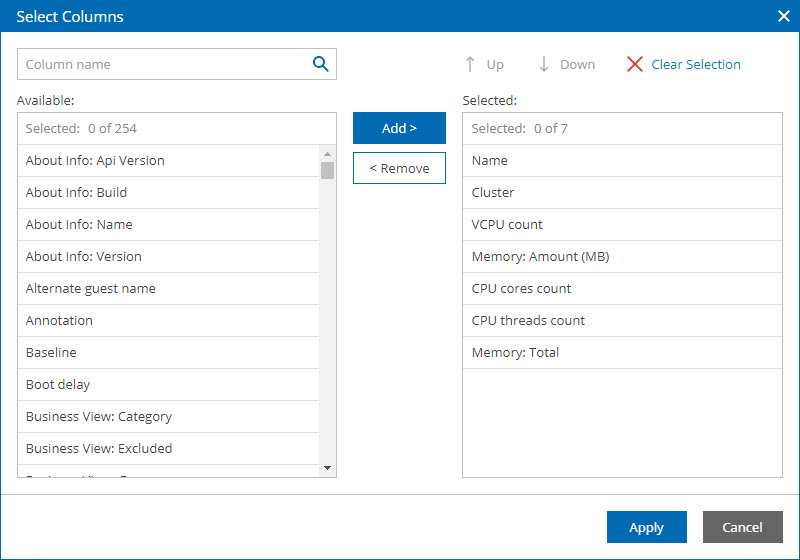
 Then on the columns, as you can see. The most relevant for me are: Name, Cluster, VCPU count, Memory: Amount (MB), CPU cores count, CPU threads count, and Memory: Total
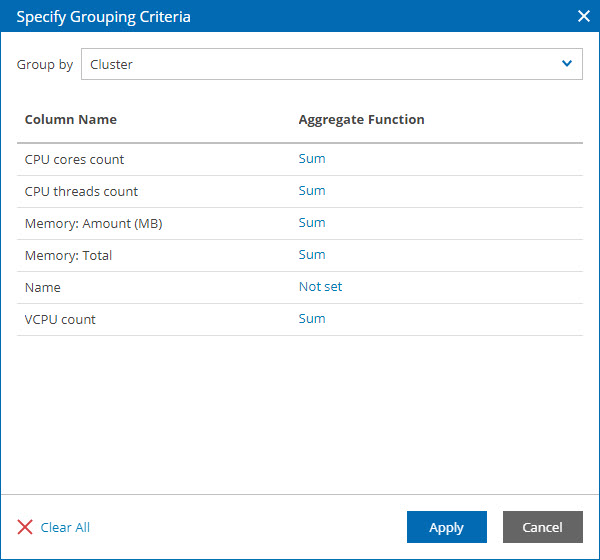
 Now, for the grouping criteria, here is where we do the magic of the mathematics. I am adding the Sum aggregation to the columns I am more interested in:
 And that’s it. We are ready to run the report, and see how good or bad our environment is.
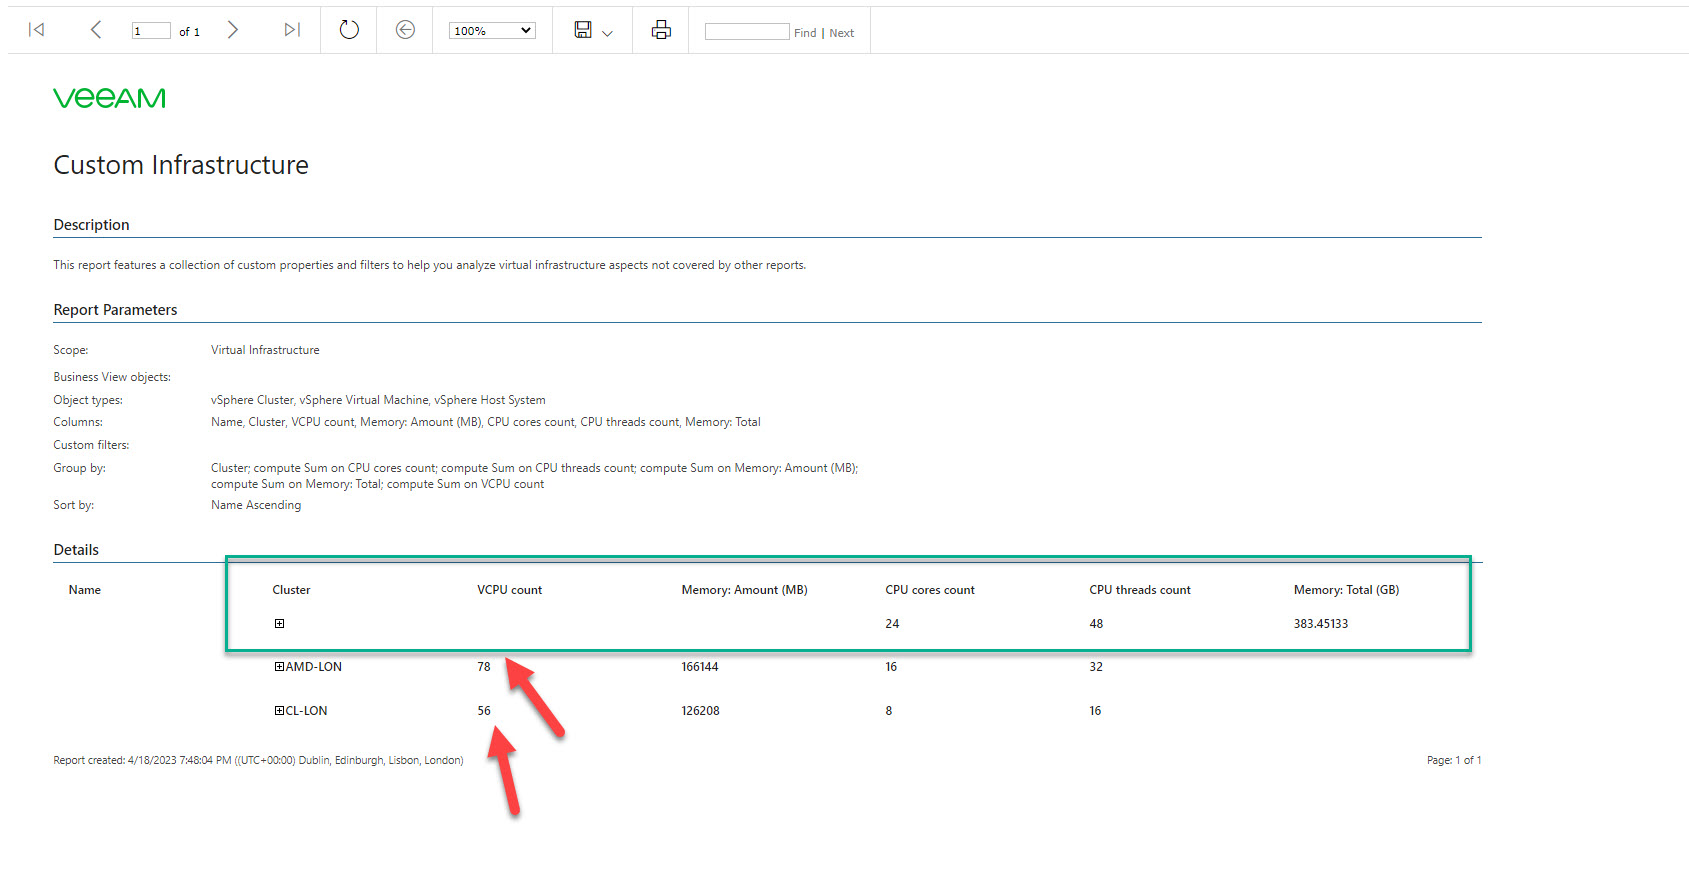
Consuming the final result
My report has opened my eyes, as from 48 total CPU threads I have between my two Clusters, and I have provisioned a crazy amount as it is 134 Cores, close to 3x times, and perhaps not recommended for a production environment.
In terms of Memory, it seems we are okay for now. I have provisioned 292GB out of 383GB. So I have spare space to allocate, and to consume later on as well.
 I hope you find this use-case interesting for you. If you have Veeam ONE, perhaps you didn’t know you can get this numbers. And if you do not have it, but are interested on getting this Report weekly, or monthly. Now you know how to produce it.
Leave a Reply