
 Hello everyone, in February of this year I wrote a script to monitor a Veeam Environment using the VeeamPSSnapIn, you can check it out on the Github page here.
This post was a tremendous success, at even I had the chance to explain a bit more to the VeeamON participants, celebrated in New Orleans. But it has a minor shortcoming, it might run very slow and use some resources if the Veeam Environment is big.
This new tutorial is based on the Veeam Enterprise Manager, and more particular we will use the RESTfulAPI, so it’s important for now on that you have it installed and licensed.
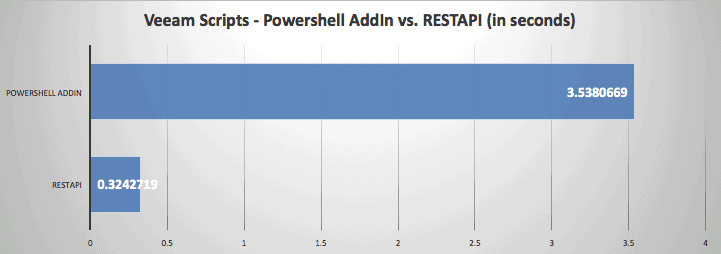
Response times while running the Script: VeeamPSSnapIn vs. Veeam Enterprise Manager RESTfulAPI
I think that one of the best ways to compare head to head both Scripts is to run some tests and note the execution time, on my Homelab environment I have: One VBR, 4 Repositories, 4 Backup Jobs, here you might find an image and a detailed responses:
 Script using Powershell VeeamPSSnapIn
PS C:\> $sw = [Diagnostics.Stopwatch]::StartNew()
>> .\veeam-stats.ps1
>> $sw.Stop()
>> $sw.Elapsed
{
"Successful-Backups" : 4,
"Warning-Backups" : 0,
"Failes-Backups" : 0,
"Failed-Backups" : 0,
"Running-Backups" : 0,
"Successful-BackupCopys" : 0,
"Warning-BackupCopys" : 0,
"Failes-BackupCopys" : 0,
"Failed-BackupCopys" : 0,
"Running-BackupCopys" : 0,
"Idle-BackupCopys" : 0,
"Successful-Replications" : 0,
"Warning-Replications" : 0,
"Failes-Replications" : 0,
"Failed-Replications" : 0,
"TotalBackupTransfer" : 4,
"REPO - USER1" : 100,
"REPO - VEEAM" : 22,
"REPO - VEEAMDEDUP" : 53,
"REPO - VMFS6" : 100,
"Number of protected Endpoints" : 4,
"TotalBackupRead" : 9,
"Running-Replications" : 0
}

TotalMinutes      : 0.0589677816666667
TotalSeconds      : 3.5380669
TotalMilliseconds : 3538.0669
Script calling directly to the RESTfulAPI
PS C:\> $sw = [Diagnostics.Stopwatch]::StartNew()
>> .\veeam-stats_EM.ps1
>> $sw.Stop()
>> $sw.Elapsed
{
"SuccessfulJobRuns" : 4,
"ProtectedVms" : 8,
"SourceVmsSize" : 489,
"WarningsJobRuns" : 0,
"FailedJobRuns" : 0,
"REPO - VEEAM" : 21.76 ,
"REPO - VEEAMDEDUP" : 52.66 ,
"REPO - USER1" : 66.18 ,
"REPO - VMFS6" : 100.00 ,
"RunningJobs" : 0
}

TotalMinutes      : 0.00540453166666667
TotalSeconds      : 0.3242719
TotalMilliseconds : 324.2719
Logical architecture for Veeam Enterprise Manager, Grafana, InfluxDB and Telegraf
This is how it might look our design, in this case, we will use the Veeam RESTfulAPI of the Veeam Enterprise Manager, the Powershell script might be run on the same Veeam Server, or in another server which has installed Telegraf and access to the Veeam Enterprise Manager REST API.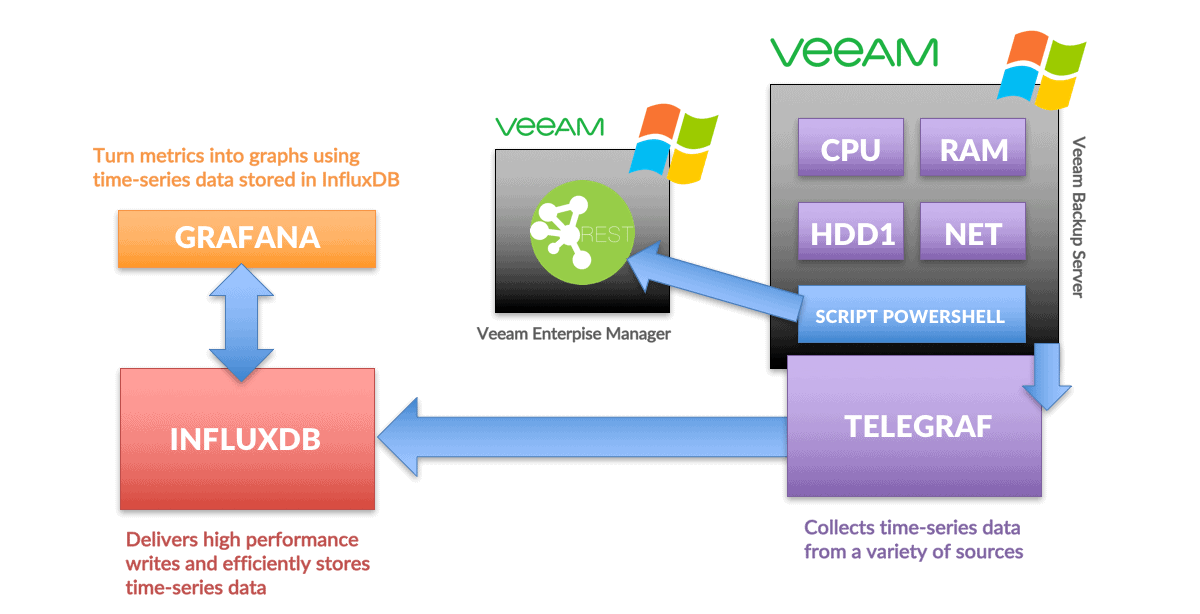 As you can see, the workflow will be: the veeam server (or any windows machine running powershell and telegraf) will run a Powershell script, the Script calls the REST API and retrieve the information, the Telegraf service then sends this information back to the InfluxDB server which stores it in a time series format, then we can build our Dashboard with Grafana and show in a beautiful way.
A quick first-steps using the Veeam Enterprise Manager RESTfulAPI
On the next Blog post, my friend and fellow Veeam Vanguard, Craig, show us how we can start playing around with the Veeam Enterprise Manager REST API:
It is a very entertaining and didactic post that will help us when making some queries to our surroundings.
Create and configure the Powershell Script for Veeam
I’ve created this Script inspired by the one created by Markus Kraus, but on my particular case I’ve added some extra stuff I wanted to monitor:
- Easy credentials and host variables at the top
- Format the output in a special way to create a InfluxDB to send back to InfluxDB
- Added the line to monitor the RunningJobs
- Added the entire Repository section, and the logic behind calculate the %
I hope you might want to contribute and expand the Script to make it better. Download Script here or check out the official GitHub project, and save it on your desired path, on mi case C:, bear in mind the first lines about credentials and server
$user = "TUUSER"
$password = "TUPASS"
$BRHost = "TUVEEAMENTERPRISESERVER"
We can perform a smoke test from our Powershell, we should see something like the next but with your numbers of course:
veeamstats_EM successfuljobruns=36
veeamstats_EM protectedvms=6
veeamstats_EM sourcevmsize=224
veeamstats_EM warningjobruns=0
veeamstats_EM failedjobruns=1826
veeamstats_EM runningjobs=1
veeamstats_EM VEEAM=27
veeamstats_EM VEEAMDEDUP=53
veeamstats_EM USER1=66
veeamstats_EM VMFS6=100
If that’s the case, please move to the next section to configure Telegraf
How to configure Telegraf for Veeam
I’m not going to discuss further how to install Telegraf over Windows, as I already wrote about it, in Spanish, with all the details and tips. This is what we should add at the bottom of the telegraf.conf, bear in mind to use your loca path, and script name:
 [[inputs.exec]]
  commands = ["powershell C:/veeam-stats_EM.ps1"]
  name_override = "veeamstats_EM"
  interval = "60s"
  timeout = "60s"
  data_format = "influx"
Basically the workflow is:
- Use an exec app, on this case Powershell with a script on the path we want, on this case is C:/
not C:\, - The second line is the name for the timeseries we will se later on on Grafana
- A long interval, but this depends on your needs of course, you might want to retrieve info every hour, or even every 24 hours
- A timeout, it will help us in the rarely case thatthe script get stucks somehow
- And last but not least, the format of the output, which in our case is “influx”
- You will need to edit the Telegraf service and change who run it:
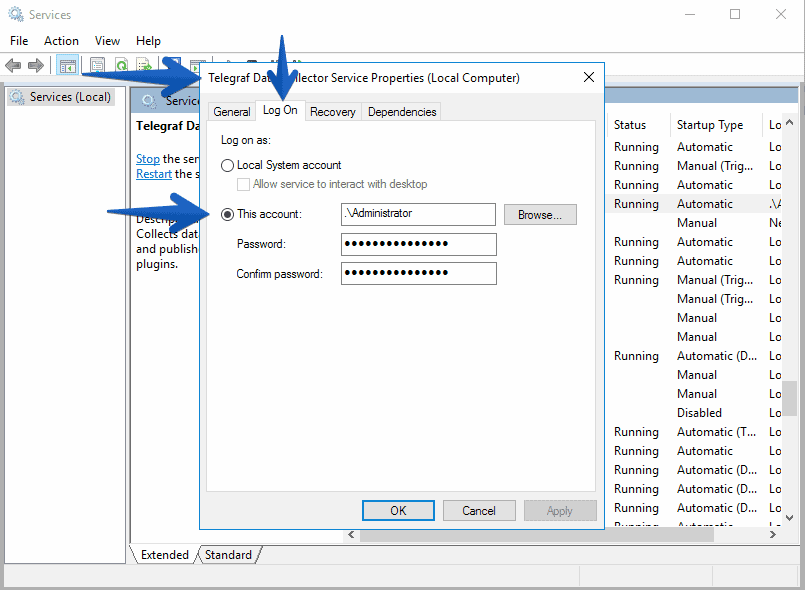
Restart now the Telegraf Windows service and check the telegraf.log to see if we have some errors or not.
How to configure Grafana for Veeam Enterprise Manager
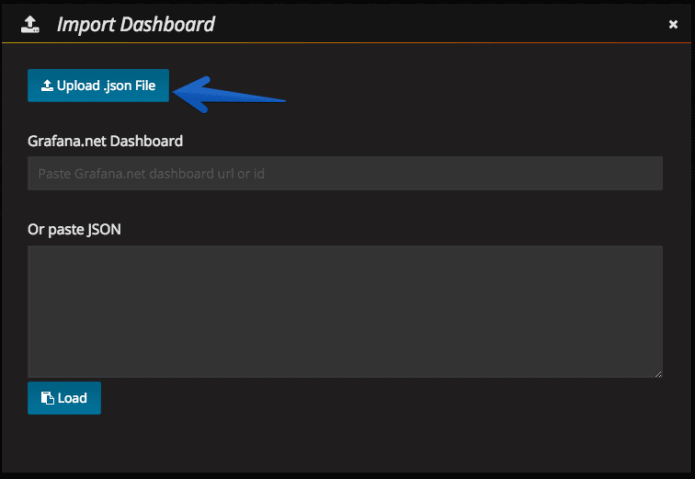
Here you can download the Dashboard in JSON format and to import it on your own environment go your Grafana Dashboards section and click on Import:
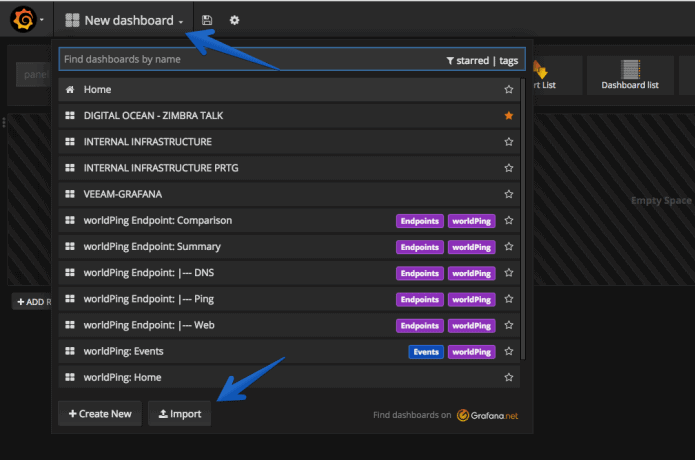 Then, click on upload .json file and select the file we have downloaded from Github.
 Once you edit the Dashboard and select your own Hosts, and Repositories, it should look like the next Veeam Availability Dashboard for Veeam Enterprise Manager
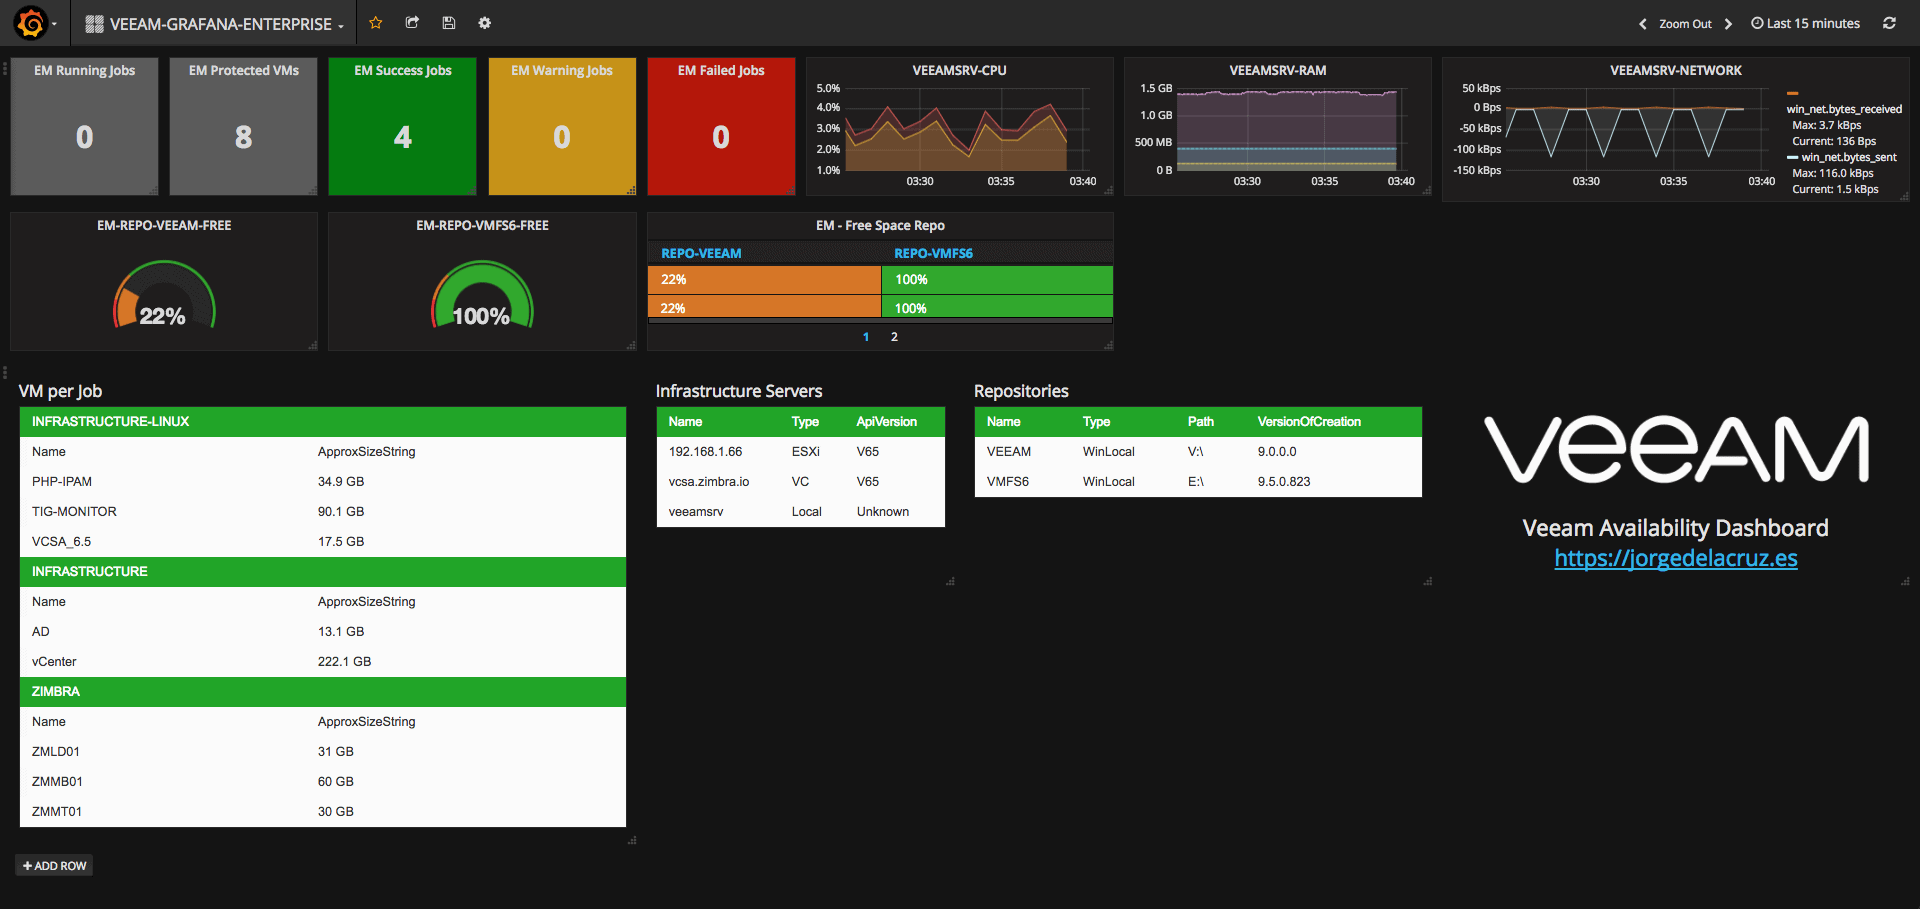 PS: The Tables are static HTML for now, they will be real and dynamic in future versions of the Script.
If you want to play with this Dashboard in real-time please click here and see how it looks like:
hello jorge
thanks this script in advance
I did the installation as you wrote. The powershell script runs without errors and gives the desired output. I also did the telegraf configuration and when I follow it with telegraf -debug, I can see that you are working fine. I added the Grafana dashboard as json code, but the data is not coming.
you can see issue below link
powershell output
https://imgyukle.com/i/nihKYt
grafana output
https://imgyukle.com/i/nih1PQ
Hello Ahmet,
I would recommend you to use the other method which uses the RESTful API – https://community.veeam.com/blogs-and-podcasts-57/updated-grafana-dashboard-for-veeam-enterprise-manager-1838
hello jorge
I managed to get it working with the method you suggested. but some metrics seem to be problematic. You can see the screenshot below.
https://imgyukle.com/i/nsRtkU
Hello, the image is broken 🙂
Hi;
I uploaded again. you can see the link below
https://imgyukle.com/i/nm2I4y
I see, yes those are for the server metrics. Let me fix the code and will let you know, you can minimize the row with that for now.