
 Hello, everyone, I’m lucky enough to have on my Homelab a QNAP NAS, I wrote in Spanish some articles about how you can integrate QNAP with VMware:
- Configuración de Red e iSCSI para entornos VMware vSphere 6.0
- Configuración de Red y Servicios NFS para entornos VMware vSphere 6.0
At the same time, it’s really important to have a good RAID configuration or a proper Network Infrastructure, we don’t need to forget how to monitor properly the QNAP status, which means all disks, temperature, S.M.A.R.T, etc. and we can achieve this in a quicker way using PRTG.
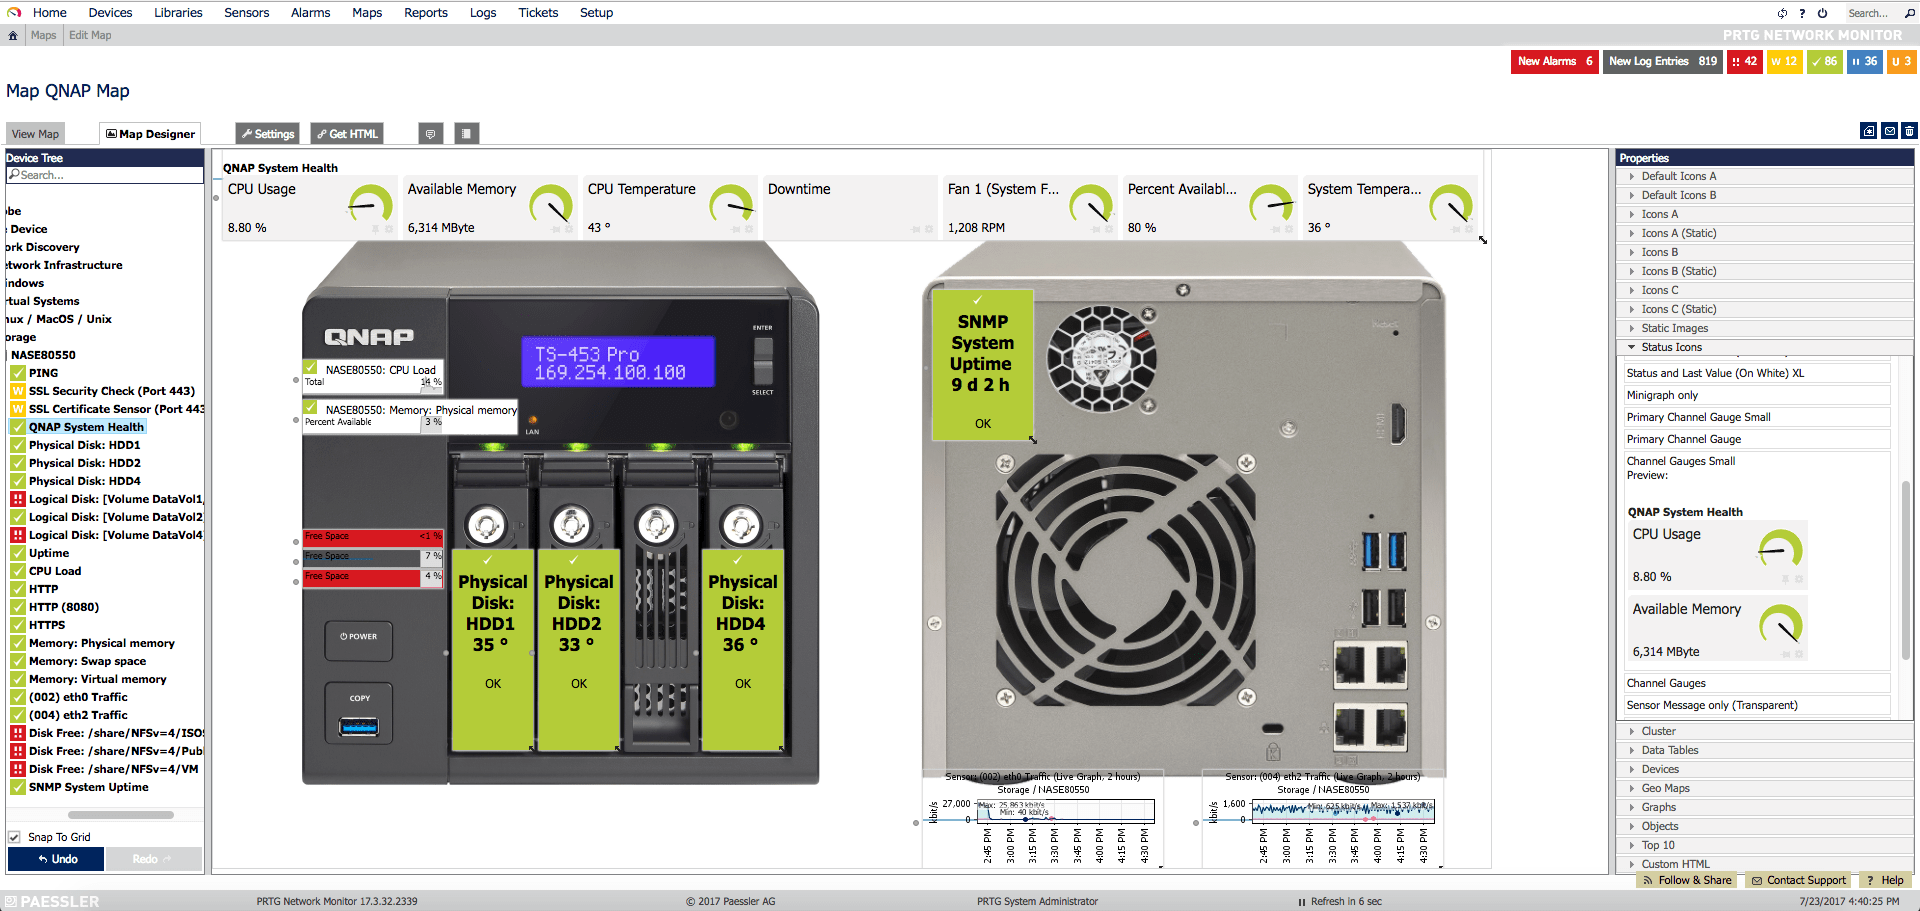
At the end of this Blog post, you might be able to have a PRTG Map like this one, which I’ve built in ten minutes:
How to configure SNMP on a QNAP NAS
First thing before continue is to think if we want to use SNMP v1/v2 or choose SNMP v3, in this particular case, I’ve chosen SNMP v1/v2 to reduce complexity.
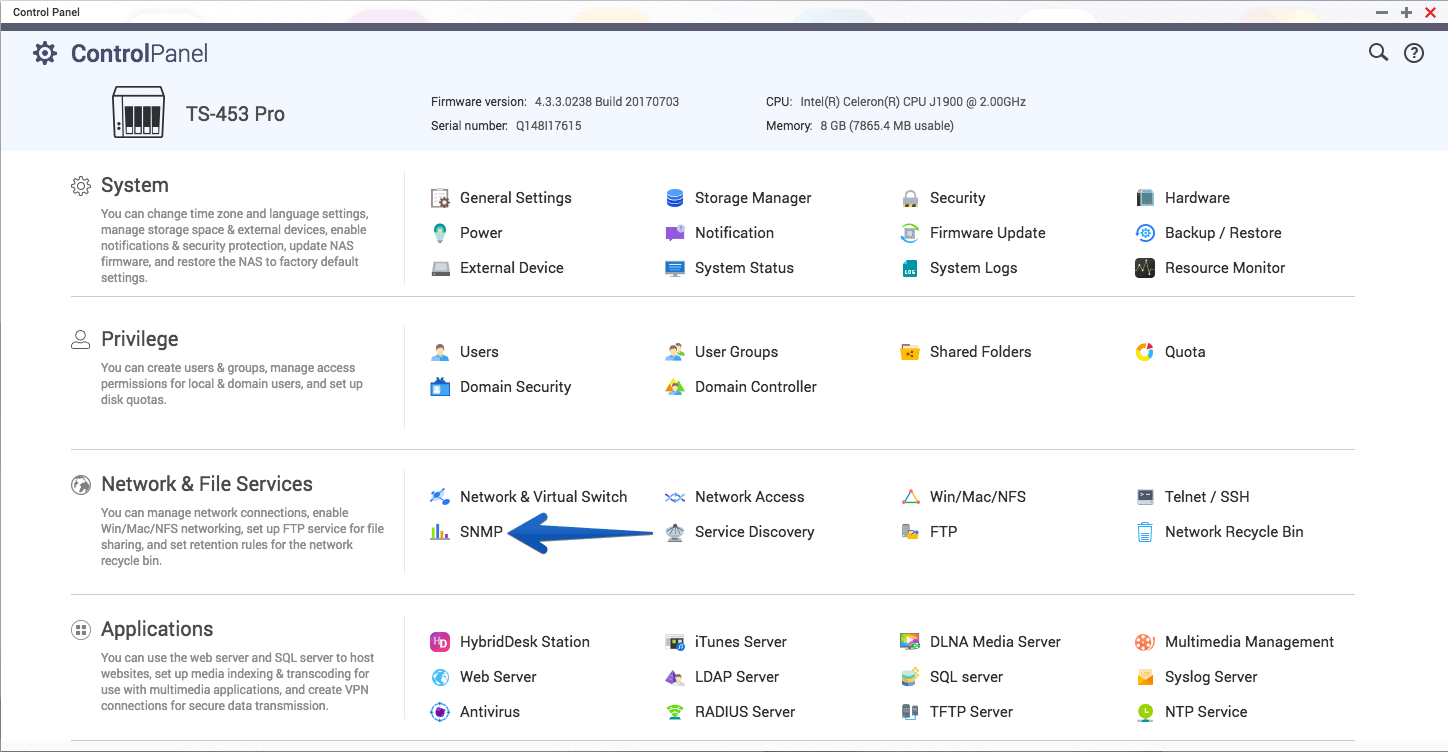
Once logged in on the QNAP, you can go to ControlPanel – Network & File Services and click on the SNMP section
 Now, on this section you can select the TCP Port for SNMP service to listen, also configure the SNMP traps in case you want to, select the SNMP version and the SNMP Community, which in my case I’ve left the default public one. All of this fields are subjective to change to fit your environment.
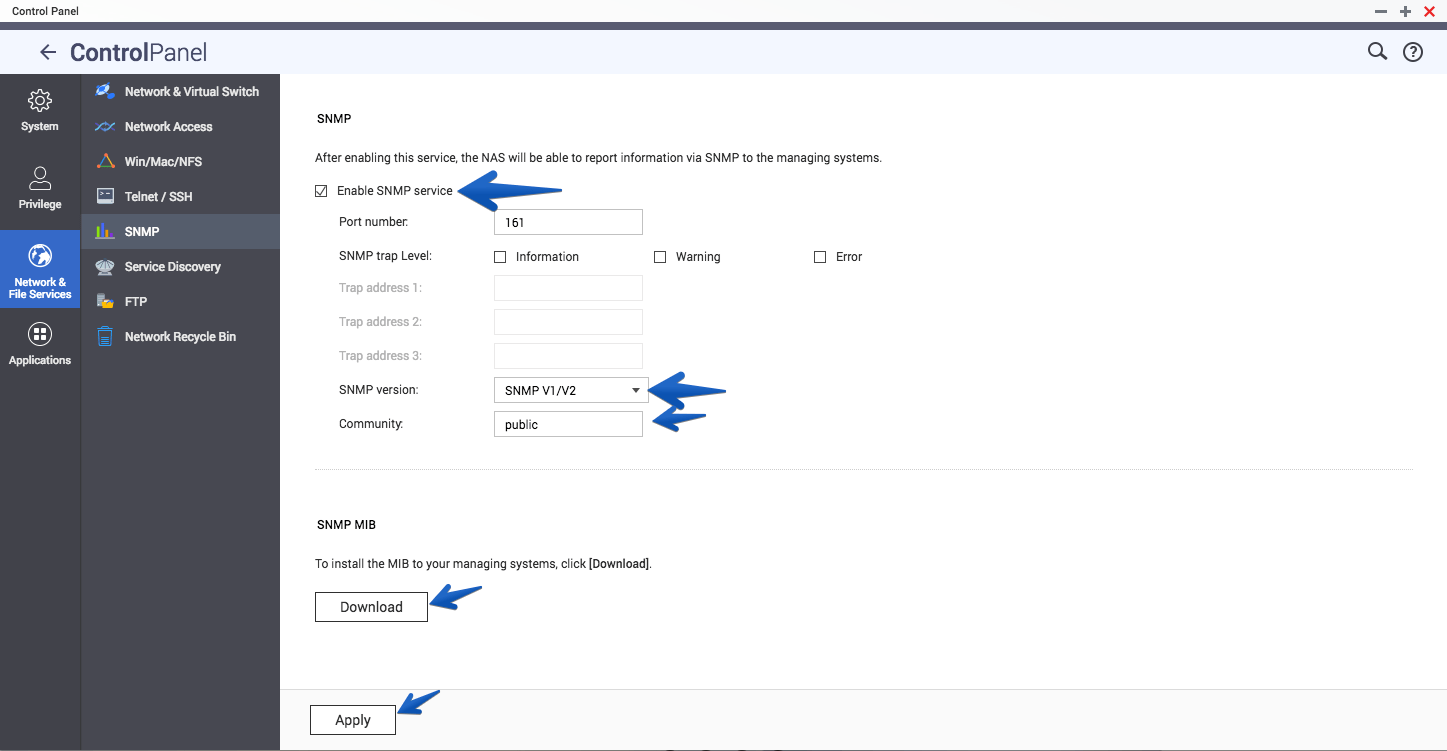 Although you can download the MIB and import it into PRTG, it’s not needed as PRTG came with a built-in QNAP sensors ready to use.
How to create and configure a new QNAP device on PRTG
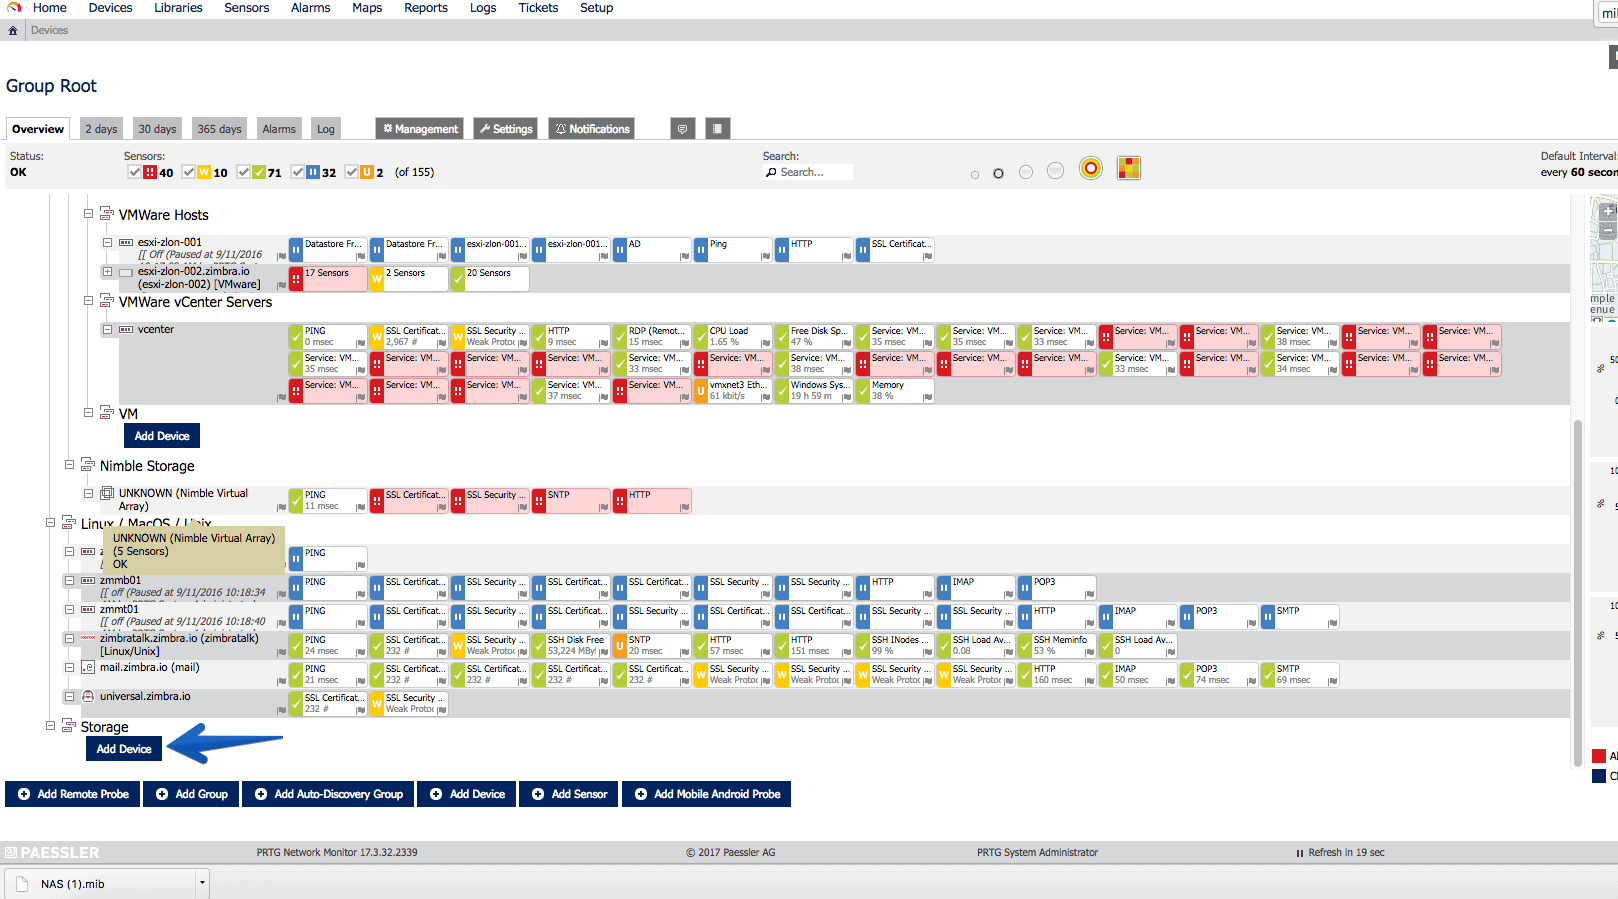
Once we’ve finished the QNAP configuration, we can now log-in in our PRTG. Then click on the button called Add Device to add your QNAP:
 Fill the fields with a descriptive name, IP or FQDN, and choose an Icon for this new device, don’t click yet on Continue and keep scrolling:
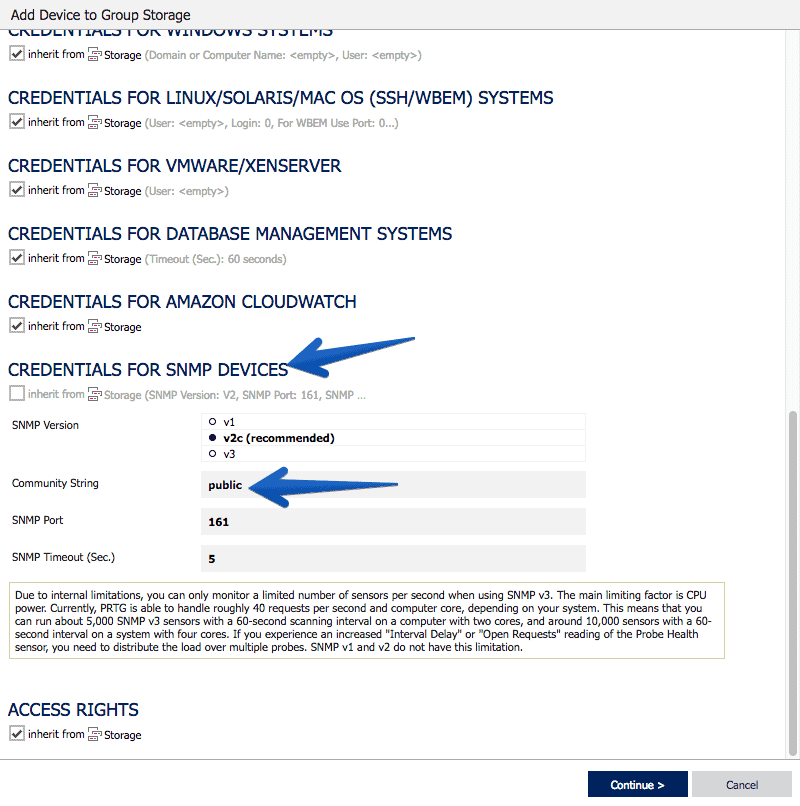
 On the section called Credentials for SNMP Devices, you can select the SNMP configuration you’ve selected on your QNAP, which can SNMP v1/v2 or even v3, TCP port, etc.
What to monitor from a QNAP NAS?
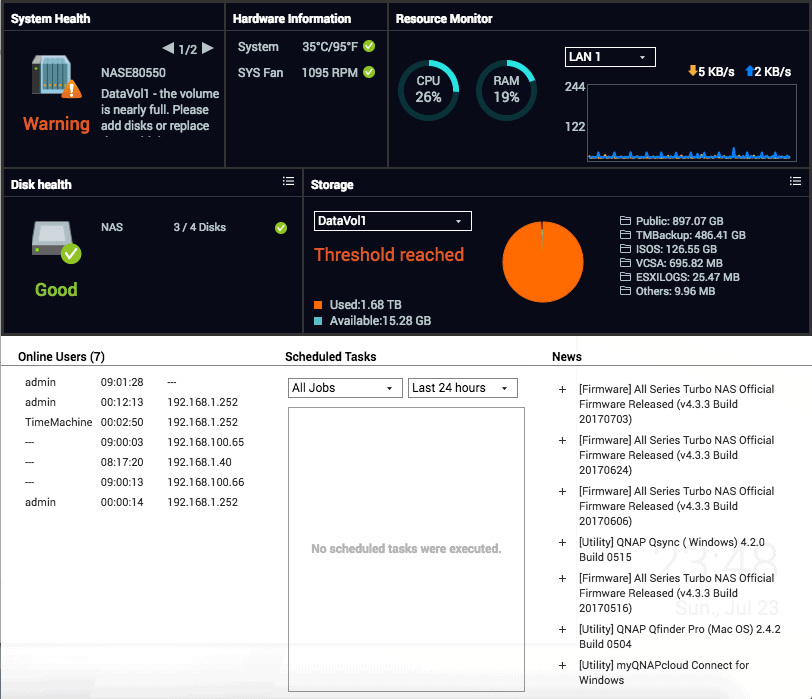
One of my favorite thing of QNAP, is their Monitoring System on the Control Panel. Once you log-in inside a QNAP, you can find on the right a monitor icon, once opened you can see all the next information:
- Disk S.M.A.R.T – This is absolutely critical, in the case that a disk is close to fail, it usually starts by sending errors on the S.M.A.R.T, and then after a few time later the disk is unusable and starts to corrupt the data.
- Disks temperature – This is another really important aspect from a monitoring point of view. Disks usually work better at a temperature between 37 up to 46 Celsius, here is a Google study about it. If we expose our disks, especially mechanical, to a temperature different than that we have more chances to make them fail sooner.
- Used space on the volumes – This is a must-have aspect we want to monitor on a NAS
- CPU and RAM usage – This is not critical until we have VMs in production on this QNAP system, as if the CPU and RAM reach the limits, all the services in the NAS will start to work really slow, which will make that VMs not running properly and have a bad performance, etc.
- Network usage – This is not really critical, but always good to know if some of the Network ports are having an unusual usage, especially for those using iSCSI or NFS with VMware.
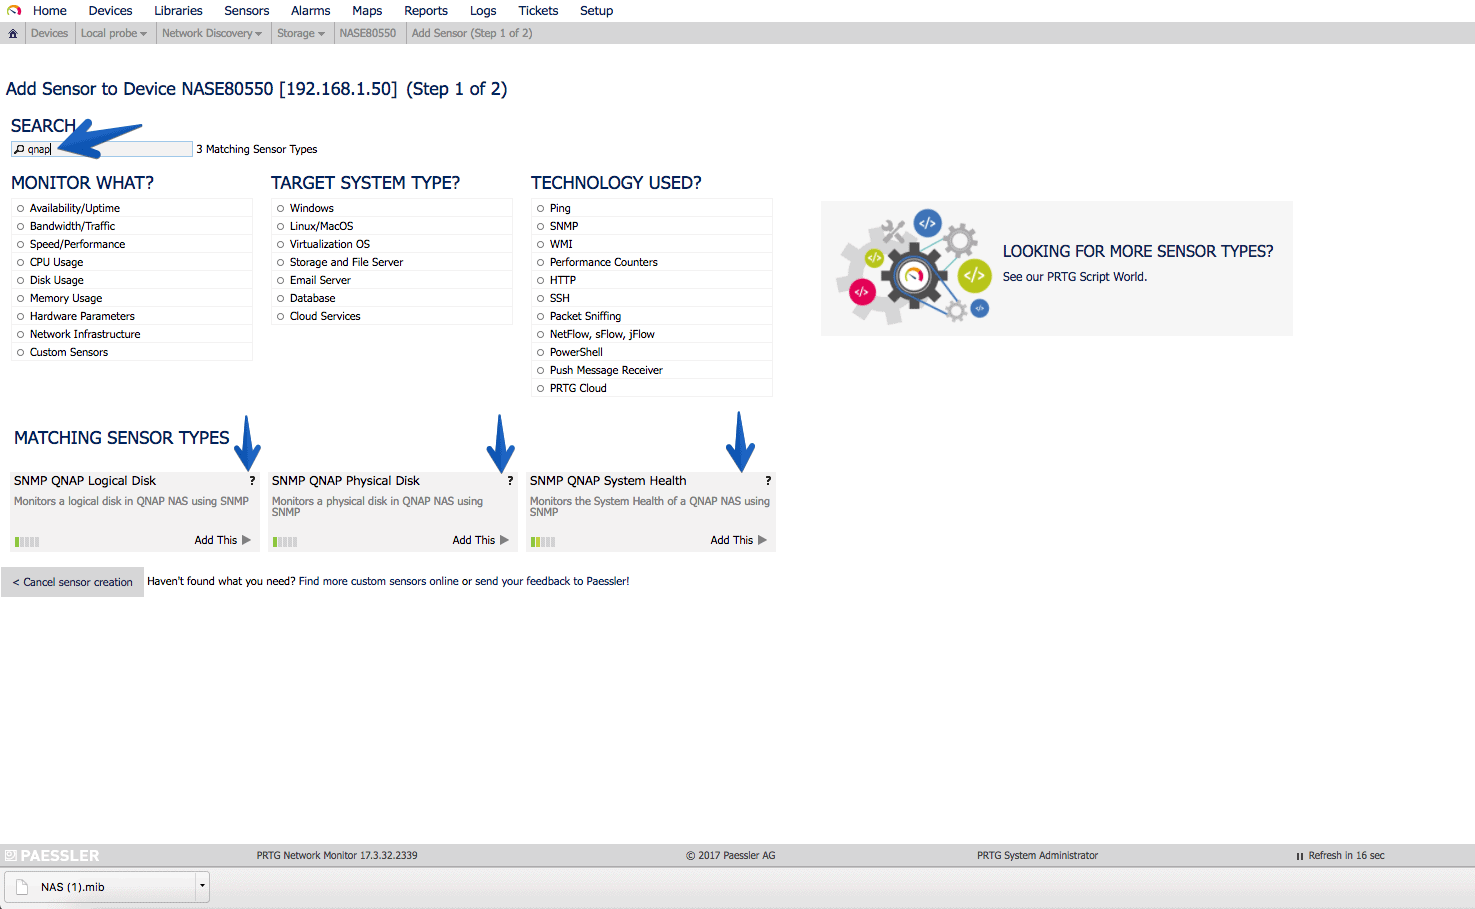
 All that said, let’s go! On PRTG we are lucky enough to have some pre-configured QNAP sensors, if we use the search and introduce QNAP, we will find three different sensors:
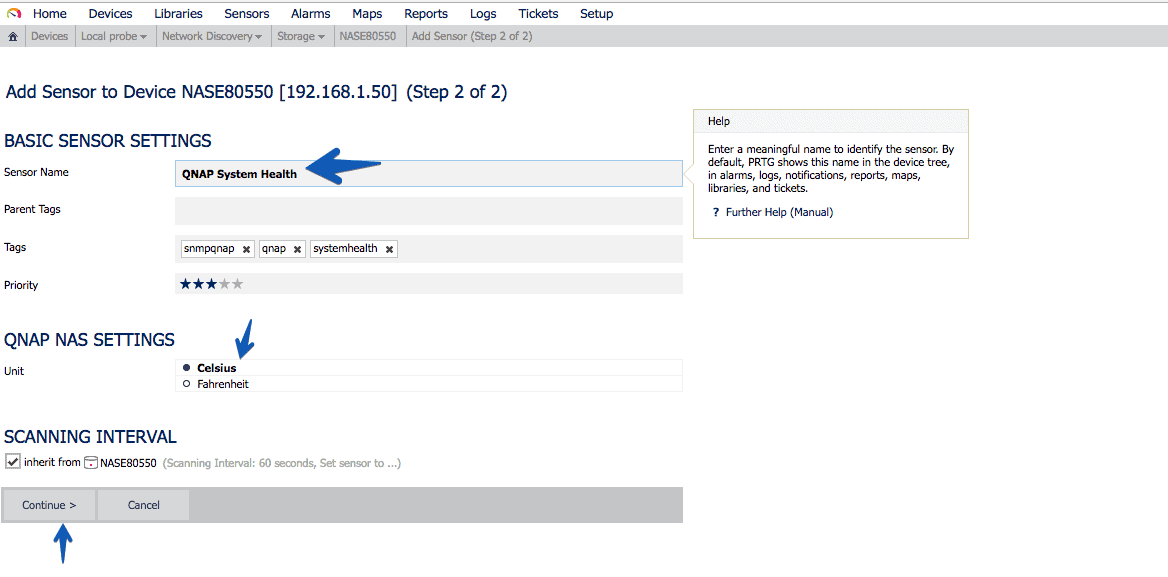
 I’ll start with the one called QNAP System Health, which will show us a really useful information about our QNAP, the sensor will prompt us for some basic information like name and if we want to show Celsius or Fahrenheit.
 This will be the result of that sensor, where we can see RAM and CPU usage, Temperature, how many downtimes we had, fan status, etc.
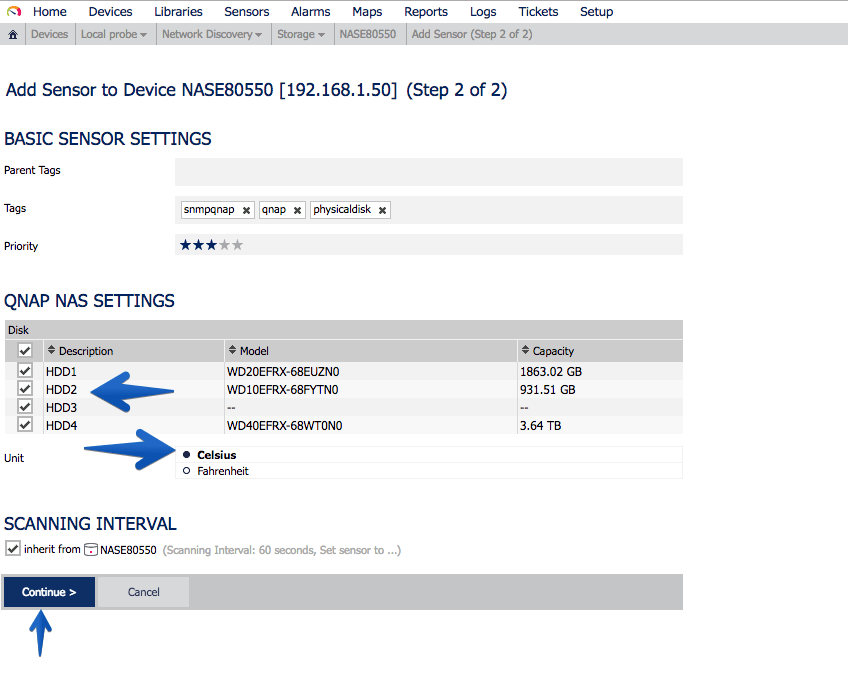
 Let’s move on to the next one: QNAP Physical Disk, this sensor will let us choose the physical HDD slots we want to monitor in our QNAP, also will ask about if we want Celsius or Fahrenheit:
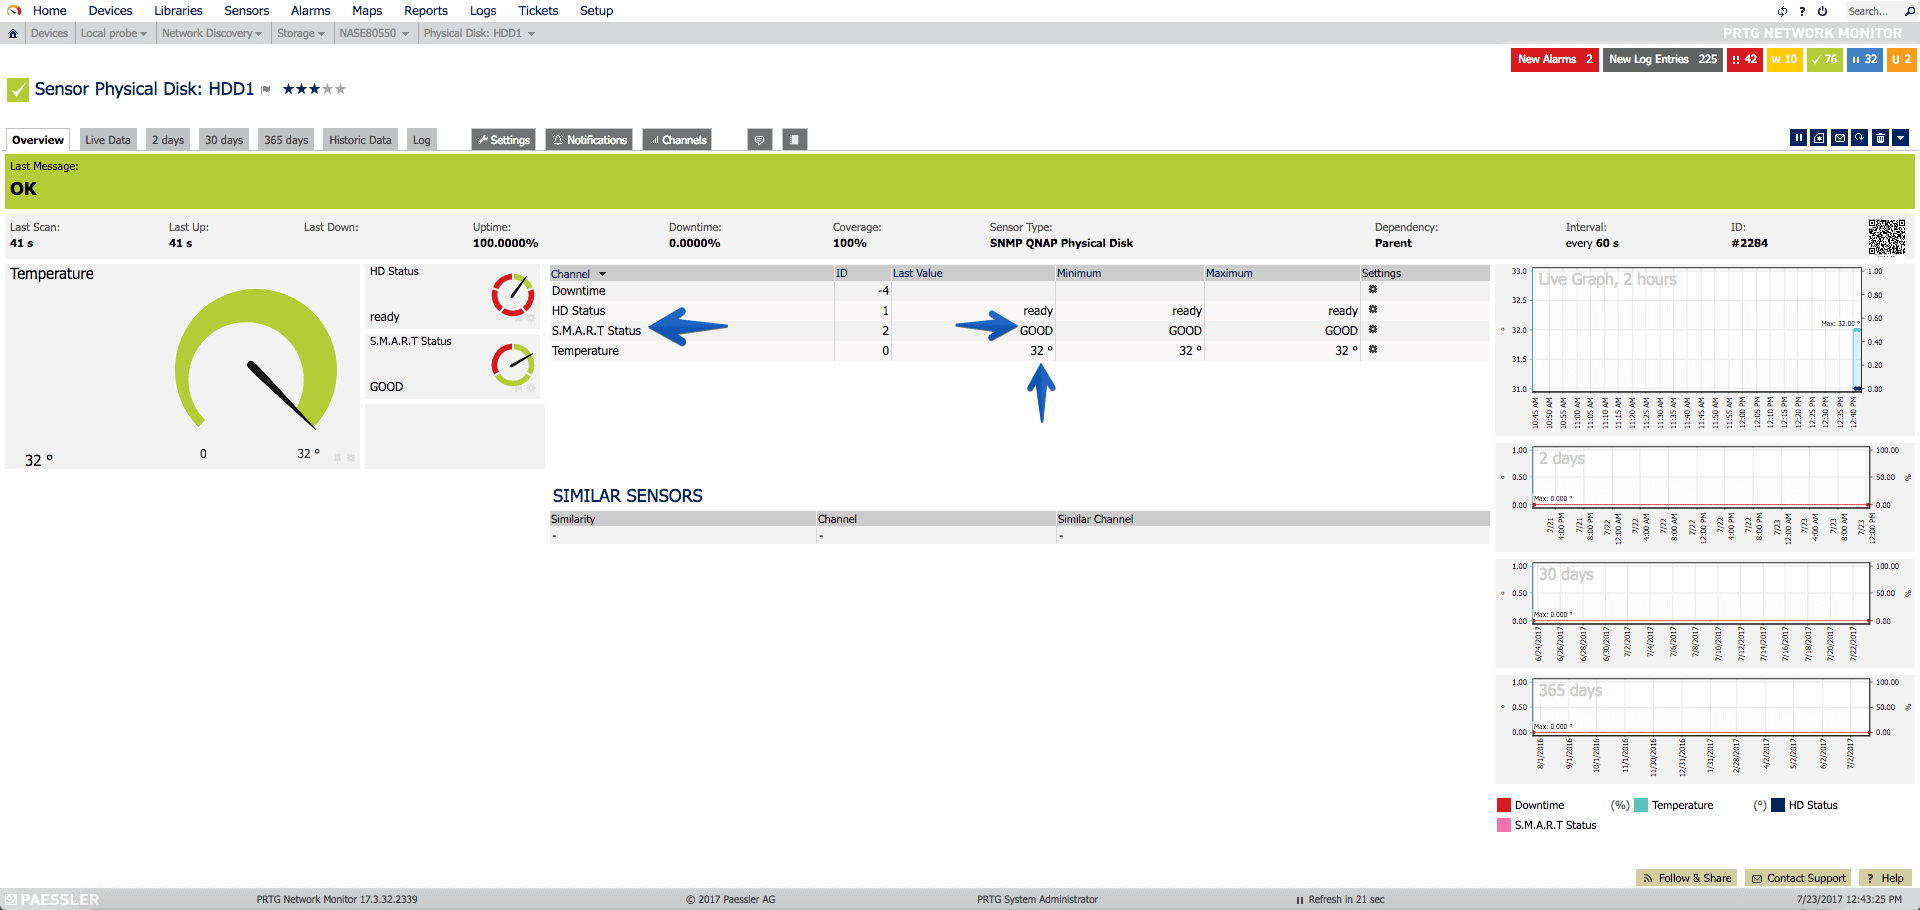
 The results are exactly what we wanted, we can see the status of each disk, temperature and the the critical S.M.A.R.T status, a completely must-have sensor:
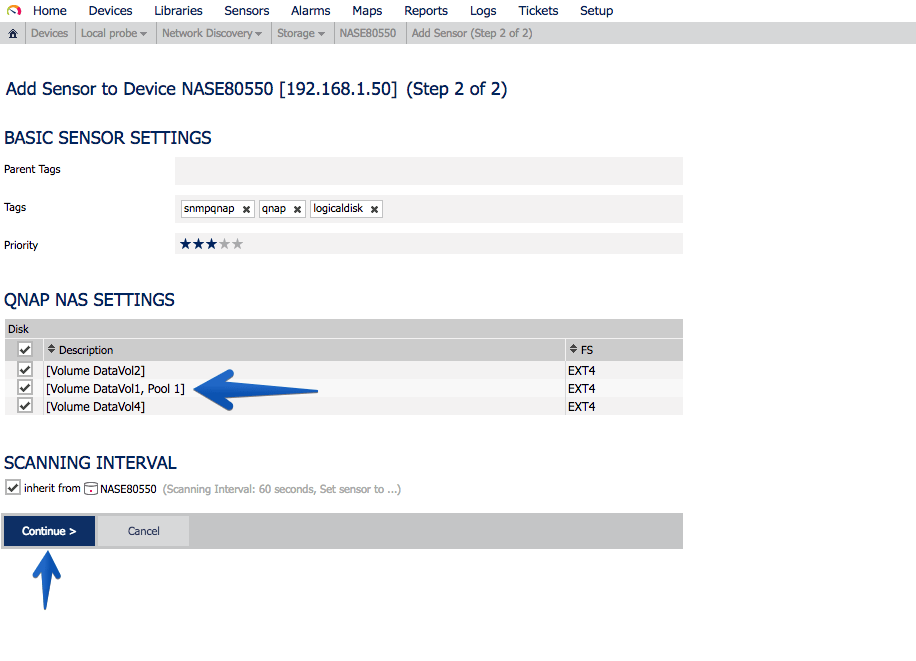
 Last but not least, QNAP Logical Disk: this sensor will allow us to see on a granular way the status of every logical volume we have on our QNAP:
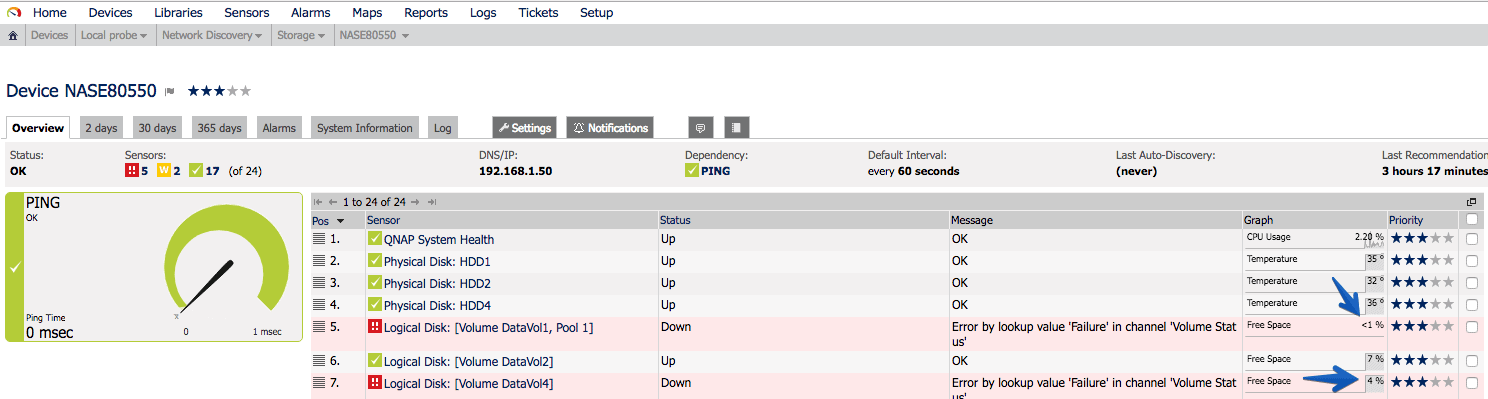
 The result will be something like the next, where we can see the status of the logical volumes, on my case as I have them almost full is all red:
Extra: Monitoring beyond the QNAP sensors
If we want to go beyond the pre-configured QNAP sensors, PRTG offers us another ton of Linux-based sensors, as QNAP is based on a Linux OS, we can leverage that into extending our QNAP monitoring even further, what a blast!
Let’s start to monitor the Ethernet usage using SNMP, so we can monitor our QNAP Ethernet ports, search for SNMP and select the SNMP Traffic sensor:
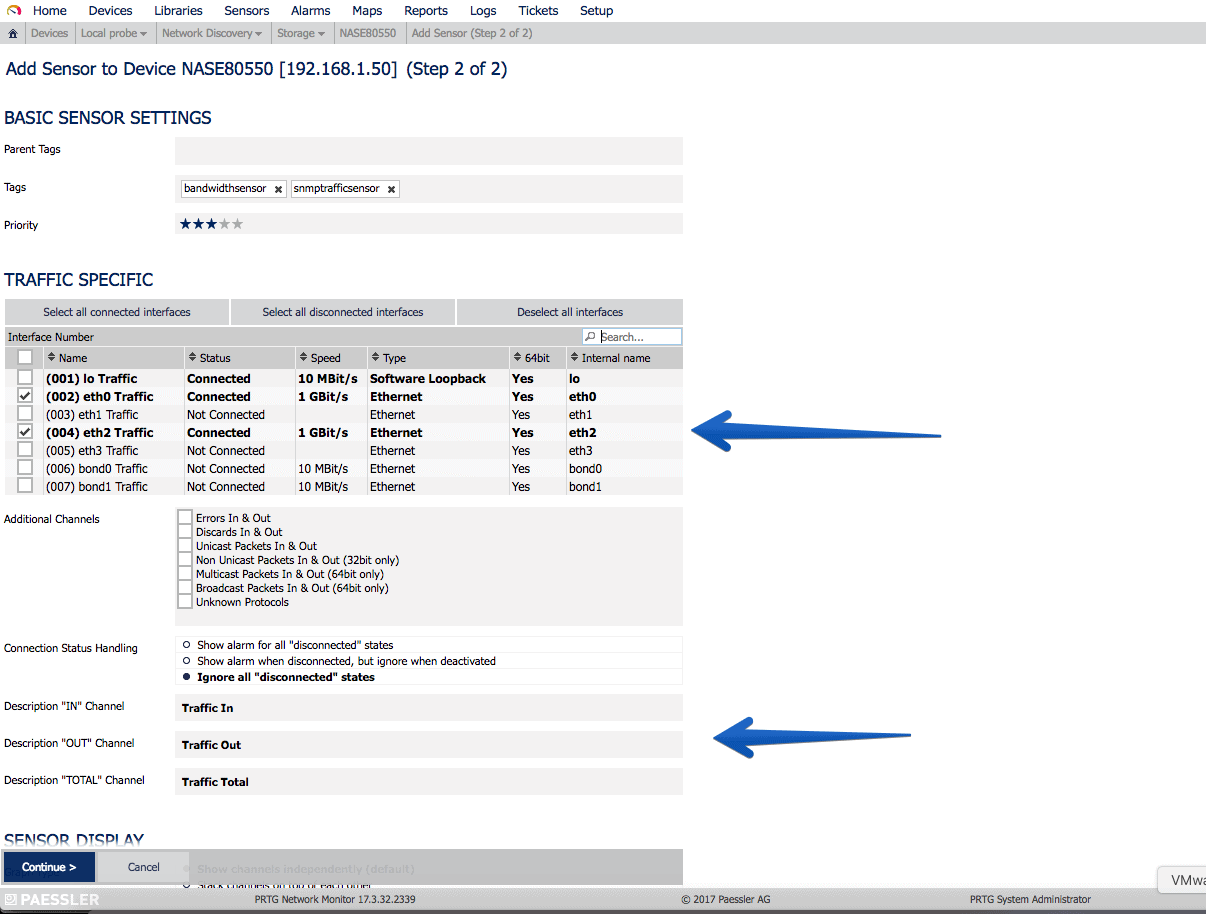
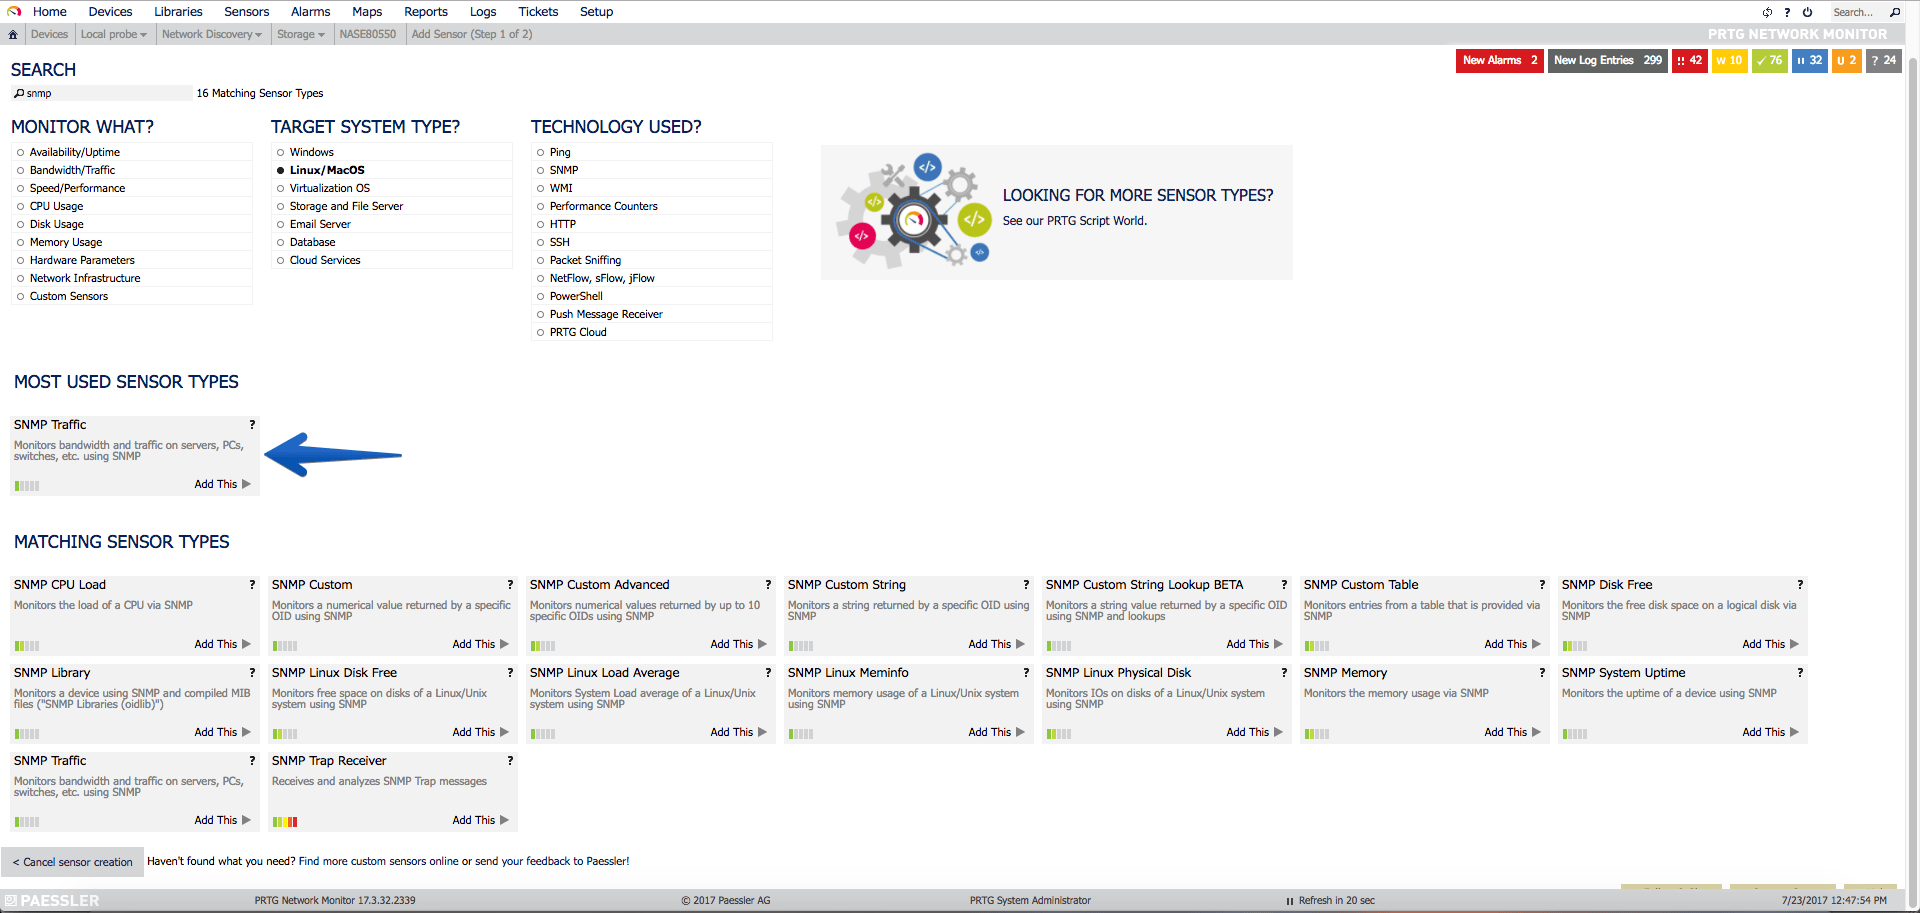 Once selected, we will be able to mark granularly our Ethernet ports, in my case, I only have the eth0 and eth2, click on continue once selected:
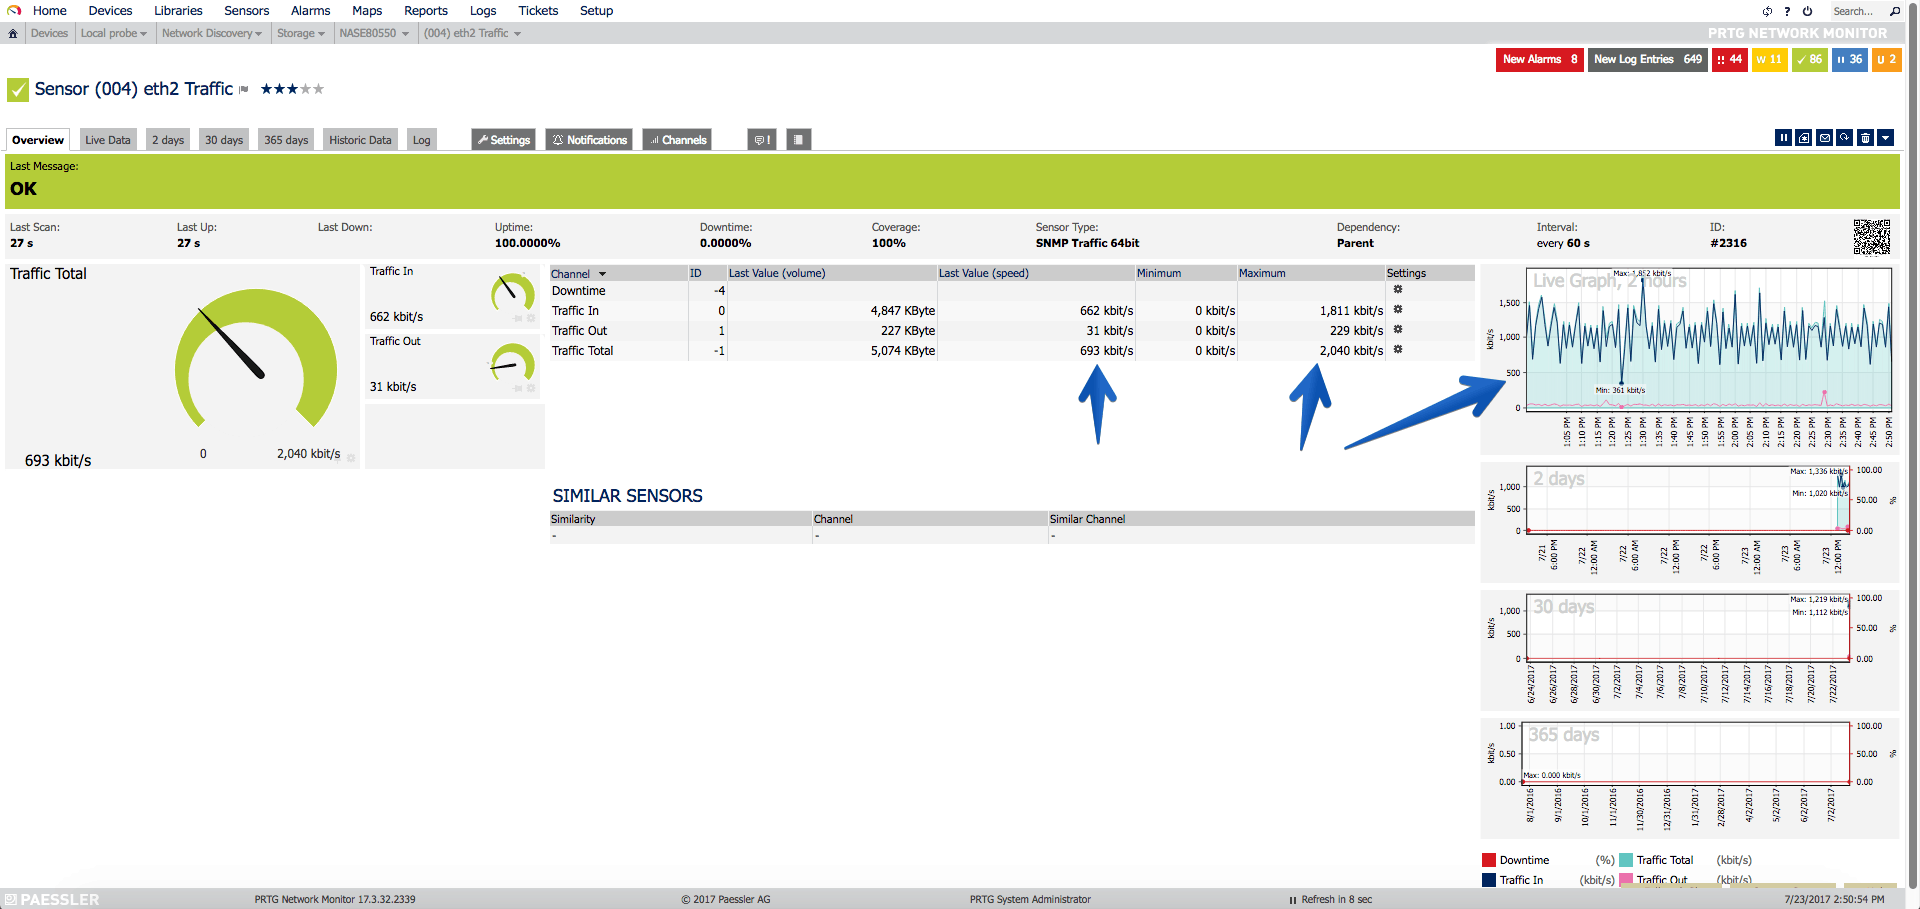
 This can be the result after a few minutes of monitoring, here you can see the bandwidth this interface had during that period of time, really useful:
 We can use as well the sensor called SNMP Disk Free to monitor our shared folders, especially useful for Virtualized environments:
 The sensor will show us all the shared folders, and we can pick the ones we want to monitor:
 That’s all folks, we can now create the PRTG Map I showed you at the beginning of the post, in just a few minutes we can do something similar, or even better. Don’t forget PRTG has a free version as well.
Did you integrate the free script from Slack that’s available from PRTG to trigger you any notifications when you are away from your monitoring station?
Hello,
Not yet, but I will write about it soon too 🙂 I usually use the SMTP notifications, email is at the end something you always have with you, in your pocket, desktop, etc. But slack can be a good candidate for a blog, thanks for comment!
Agreed, email still the basic but when we are on the move, other source of notifications such as Slack notifications or SMS (which is also supported by PRTG) would be a good options.
Hello Jorgeuk,
can you tell me, how i get the the pic of qnap in my map?
Hi Ricardo,
I just used some images from google, like
https://www.google.co.uk/search?q=qnap+back&source=lnms&tbm=isch&sa=X&ved=0ahUKEwjT3fWE6I3WAhVjIsAKHWTfC58Q_AUICygC&biw=1920&bih=910
or
https://www.google.co.uk/search?biw=1920&bih=910&tbm=isch&sa=1&q=qnap+front&oq=qnap+front&gs_l=psy-ab.3..0i24k1l3.18683.19178.0.19267.5.5.0.0.0.0.63.200.4.4.0….0…1.1.64.psy-ab..1.4.199…0i30k1.JKko7EYOWJw
And merged them in Paint.
Best regards
Okay, thank you very much. I thought perhaps it’s a graphic i can choose in prtg!
Hi Ricardo,
Well, it’s super easy to combine the images on a jpg and upload it, you have even more control 🙂
Thank you for taking the time to read it and comment!
Thanks for the awesome idea.
I have created my own for home borrowing your idea, and it ROCKS!!!
Very happy to read your tip.
Wish you have more health 😀
Apologies for a thread necromancy – at the start of the article, you said about the QNAP dashboard map at the end of the article. You never go on to show how to make that dashboard. Do you have an article about creating that?
Can you share your map please, I also have a 4 bay QNAP and don’t want to reinvent the wheel 🙂 Nice work!!