
 Greetings friends, as I have told you in previous posts, and surely you are seeing in all media, vCenter for Windows will be obsolete in the next version of VMware, which makes us start migrating to vCenter Server Appliance for Linux (VCSA 6.5).
The new VCSA 6.5 comes with many enhancements such as HA, Backup, and very basic web monitoring to see CPU and RAM, I leave you some interesting articles:
- VMware: Cómo actualizar de manera sencilla VMware vCenter Server Appliance 6.5 al nuevo 6.5 Update 1 (VCSA 6.5 U1)
- VMware: Cómo resetar la password de root de VCSA 6.5 en 60 segundos
- VMware: Cómo configurar VCSA 6.5 HA, la nueva alta disponibilidad de vCenter Server Appliance
- VMware: Backup de vCenter Server Appliance (VCSA) 6.5
- VMware: Restore de vCenter Server Appliance (VCSA) 6.5
- VMware: Instalando VCSA 6.0 U1, y vistazo rápido a novedades VAMI y PSC Web Client
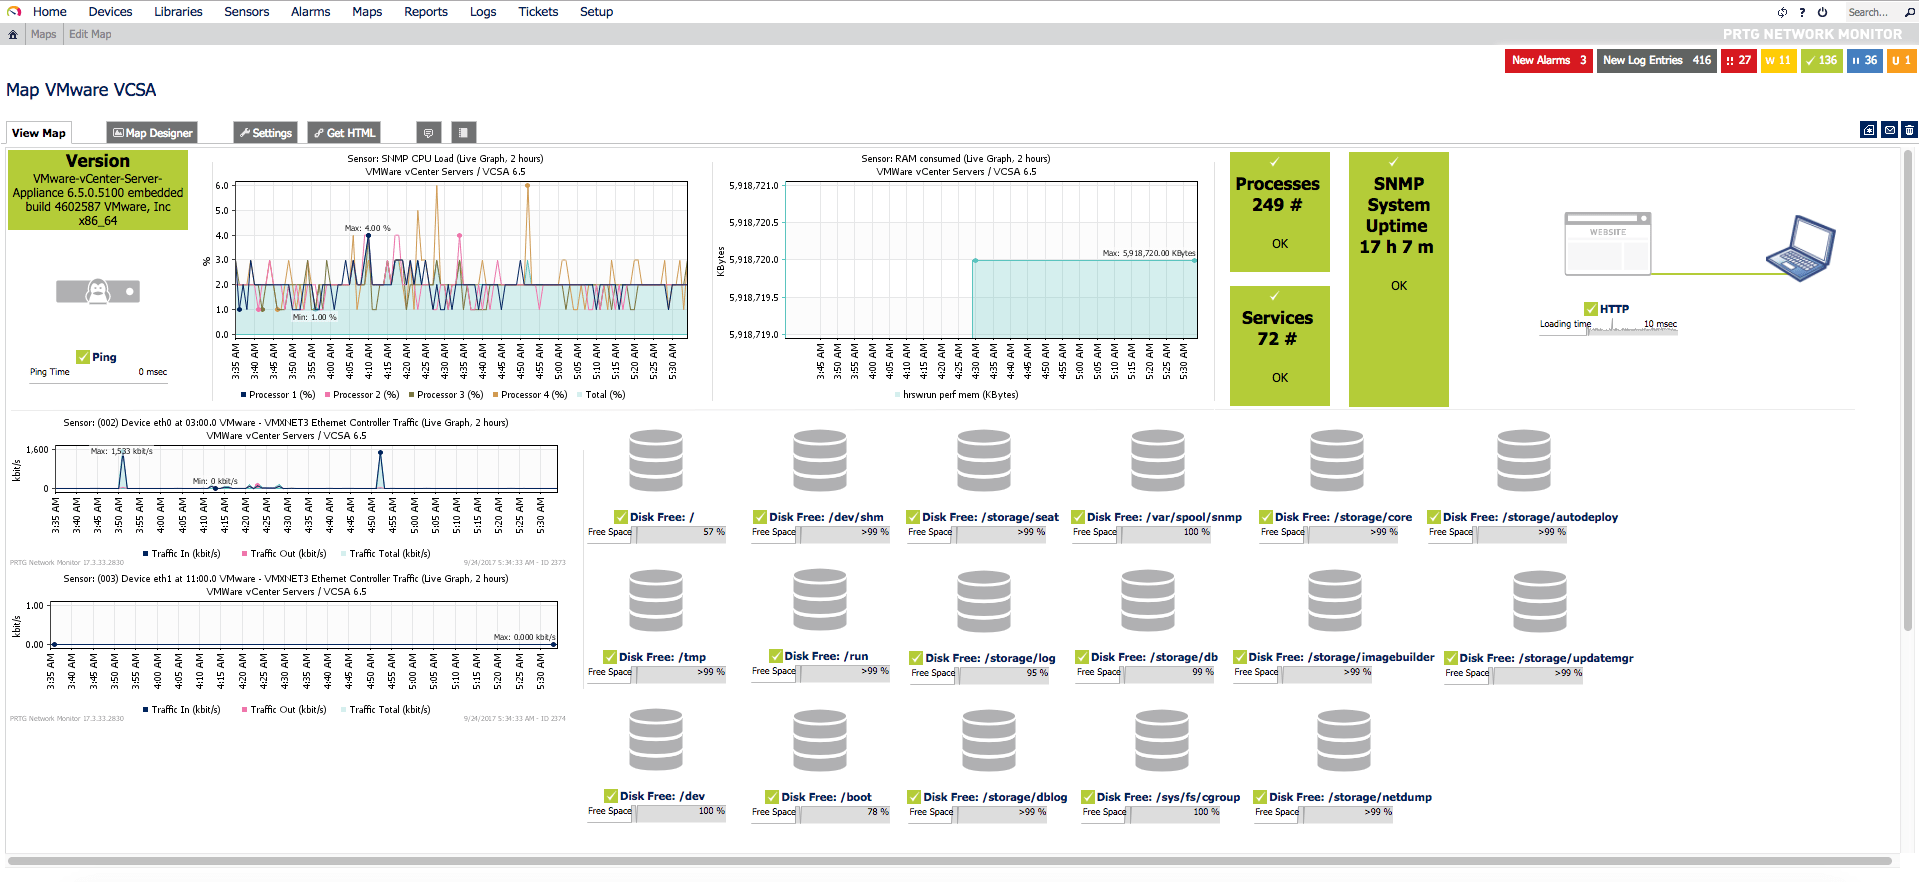
Without further delay, let’s start the article, at the end we can have a Dashboard similar to this one using the always recommended PRTG Network Monitor:
How to enable SNMP in VCSA 6.5
The first step is to activate SNMP in our VCSA 6.5, to do this we will log in through SSH, without entering the shell, we will launch the command snmp. get, to check the state of our SNMP:
VMware vCenter Server Appliance 6.5.0.10000

Type: vCenter Server with an embedded Platform Services Controller

Last login: Tue Sep 19 13:46:09 2017 from 192.168.0.248
Connected to service

    * List APIs: "help api list"
    * List Plugins: "help pi list"
    * Launch BASH: "shell"

Command> snmp.get
Config:
   Enable: False
   Users:
   Notraps:
   Privacy: none
   Loglevel: warning
   V3targets:
   Pid: n/a
   Syslocation: ''
   Targets:
   Remoteusers:
   Authentication: none
   Communities: ''
   Engineid: ''
   Port: 161
   Syscontact: ''

Command>
We see that for now it is disabled with what we can go to the next step, which is to configure it and add the Hosts that we want to receive traps.
In the following command I’m going to configure SNMP in a basic way using the public community, at the same time I’m going to tell you that I want you to send me all the traps to the PRTG Host, and later on I want you to only send me the warning and error notifications.
There are four levels of logging for debug|info|warning|error traps (“debug” is the most detailed, and “error” the least detail). Come on, don’t forget the snmp. enable command to enable it:
Command> snmp.set --communities public
Command> snmp.set --targets 192.168.1.15@162/public
Command> snmp.set --loglevel warning
Command> snmp.enable
If we launch the snmp. get command again now, we’ll see the result of our configuration:
Command> snmp.get
Config:
   Enable: True
   Users:
   Notraps: ''
   Privacy: none
   Loglevel: warning
   V3targets:
   Pid: 12921
   Syslocation: ''
   Targets:
     1:
         Ip: 192.168.1.15
         Port: 162
         Community: public
   Remoteusers:
   Authentication: none
   Communities: public
   Engineid: 80001adc806e16804020bbc65900000000
   Port: 161
   Syscontact: ''

Command>
We could also throw a test trap at our PRTG:
Command> snmp.test
Results:
   Message: A warmStart notification was sent to 1 target.
   Success: True
Now that we already have SNMP running, we could from a computer with VCSA’s IP access launch the following command that will give us back everything it’s showing by SNMP:
snmpwalk -v2c -c public TU_VCSA_IP_O_HOSTNAME |more
Algo así veremos si todo ha ido bien:
SNMPv2-MIB::sysDescr.0 = STRING: VMware-vCenter-Server-Appliance 6.5.0.5100 embedded build 4602587 VMware, Inc x86_64
SNMPv2-MIB::sysObjectID.0 = OID: SNMPv2-SMI::enterprises.6876.4.7
DISMAN-EVENT-MIB::sysUpTimeInstance = Timeticks: (7840447) 21:46:44.47
SNMPv2-MIB::sysContact.0 = STRING:
SNMPv2-MIB::sysName.0 = STRING: vcsa.zimbra.io
SNMPv2-MIB::sysLocation.0 = STRING:
SNMPv2-MIB::sysServices.0 = INTEGER: 72
SNMPv2-MIB::sysORLastChange.0 = Timeticks: (1) 0:00:00.01
SNMPv2-MIB::sysORID.1 = OID: SNMPv2-MIB::snmpMIB
SNMPv2-MIB::sysORID.2 = OID: IF-MIB::ifMIB
SNMPv2-MIB::sysORID.3 = OID: IP-MIB::ip
SNMPv2-MIB::sysORID.4 = OID: IP-MIB::ip.24
SNMPv2-MIB::sysORID.5 = OID: UDP-MIB::udp
SNMPv2-MIB::sysORID.6 = OID: TCP-MIB::tcp
SNMPv2-MIB::sysORID.7 = OID: SNMPv2-SMI::mib-2.47
SNMPv2-MIB::sysORID.8 = OID: HOST-RESOURCES-MIB::hostResourcesMibModule
SNMPv2-MIB::sysORID.9 = OID: SNMPv2-SMI::enterprises.6876.53
SNMPv2-MIB::sysORID.10 = OID: SNMPv2-SMI::enterprises.6876.1.10
SNMPv2-MIB::sysORDescr.1 = STRING: SNMPv2-MIB, RFC 3418
SNMPv2-MIB::sysORDescr.2 = STRING: IF-MIB, RFC 2863
SNMPv2-MIB::sysORDescr.3 = STRING: IP-MIB, RFC 4293
SNMPv2-MIB::sysORDescr.4 = STRING: IP-FORWARD-MIB, RFC 4292
SNMPv2-MIB::sysORDescr.5 = STRING: UDP-MIB, RFC 4113
SNMPv2-MIB::sysORDescr.6 = STRING: TCP-MIB, RFC 4022
SNMPv2-MIB::sysORDescr.7 = STRING: ENTITY-MIB, RFC 4133
SNMPv2-MIB::sysORDescr.8 = STRING: HOST-RESOURCES-MIB, RFC 2790
SNMPv2-MIB::sysORDescr.9 = STRING: VMWARE-VCHA-MIB, REVISION 201602030000Z
SNMPv2-MIB::sysORDescr.10 = STRING: VMWARE-SYSTEM-MIB, REVISION 201008020000Z
SNMPv2-MIB::sysORUpTime.1 = Timeticks: (1) 0:00:00.01
SNMPv2-MIB::sysORUpTime.2 = Timeticks: (1) 0:00:00.01
SNMPv2-MIB::sysORUpTime.3 = Timeticks: (1) 0:00:00.01
SNMPv2-MIB::sysORUpTime.4 = Timeticks: (1) 0:00:00.01
SNMPv2-MIB::sysORUpTime.5 = Timeticks: (1) 0:00:00.01
SNMPv2-MIB::sysORUpTime.6 = Timeticks: (1) 0:00:00.01
SNMPv2-MIB::sysORUpTime.7 = Timeticks: (1) 0:00:00.01
SNMPv2-MIB::sysORUpTime.8 = Timeticks: (1) 0:00:00.01
SNMPv2-MIB::sysORUpTime.9 = Timeticks: (1) 0:00:00.01
SNMPv2-MIB::sysORUpTime.10 = Timeticks: (1) 0:00:00.01
Something like this, we’ll see if everything went well.
Importing VMware MIBs into PRTG
This step is important, but fortunately for you, we already have the step-by-step in another blog post:
Configuring the Trap Sensor in PRTG
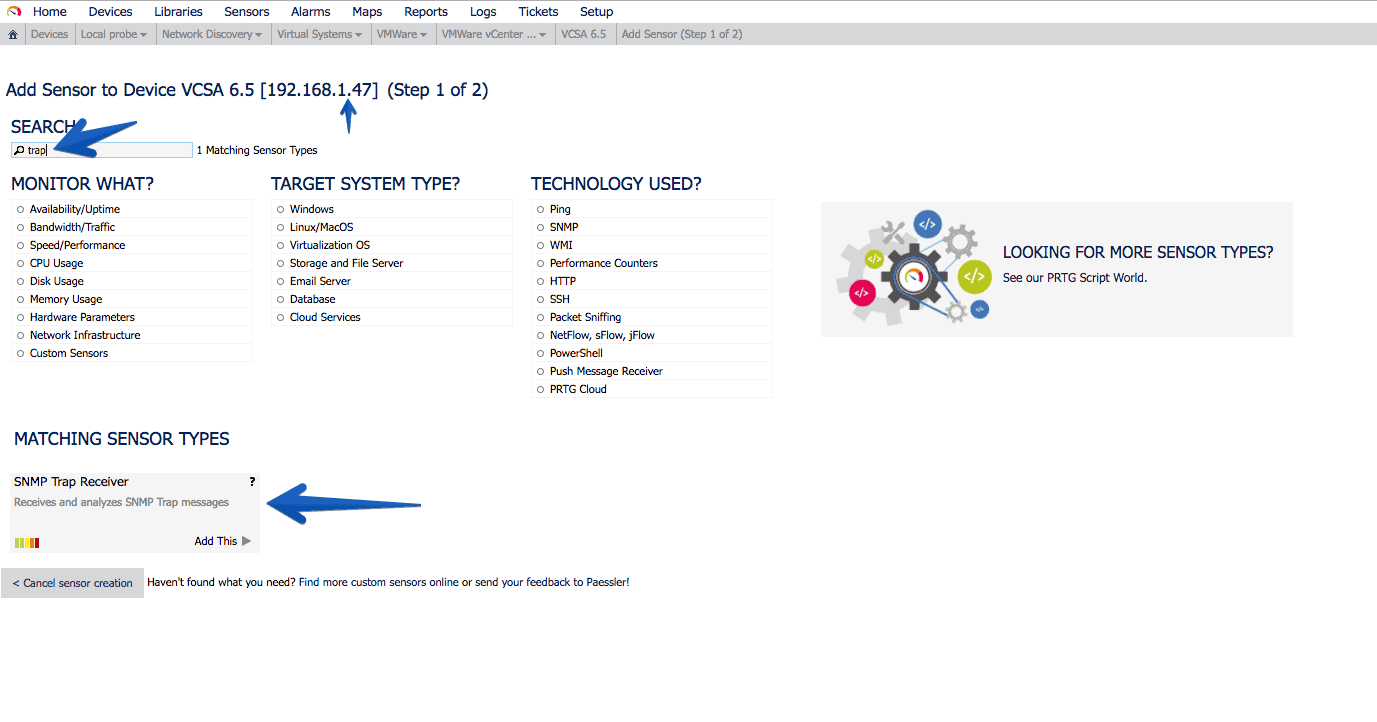
In PRTG it’s so simple how to add a new Sensor, search for Trap, and select the sensor called SNMP Trap Receiver:
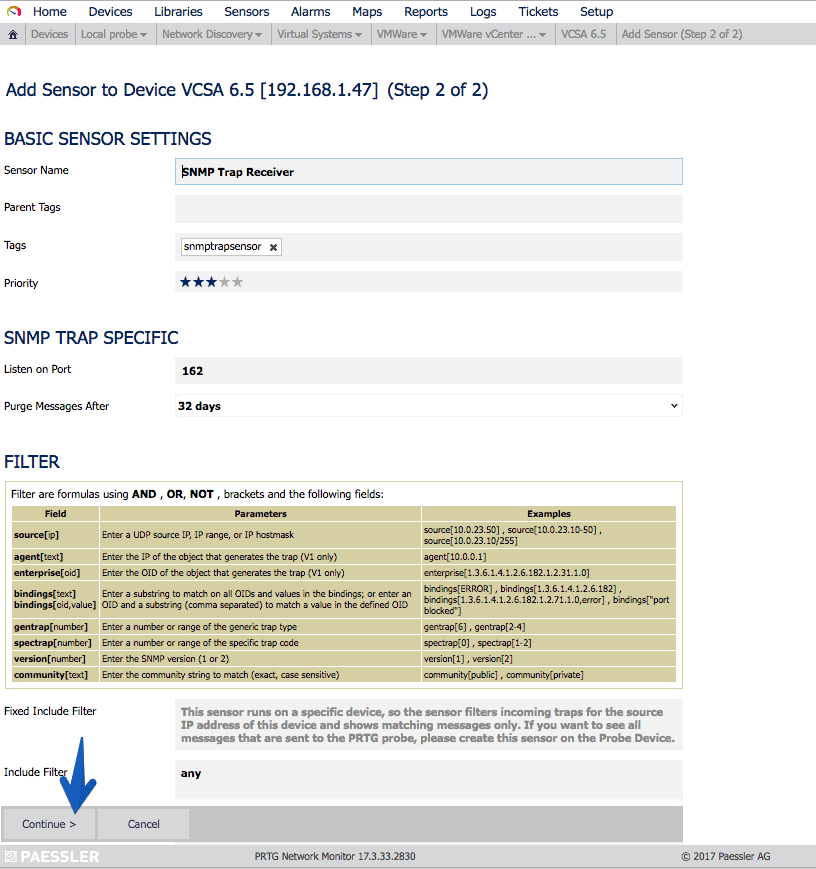
 The configurations are not very complicated, and you just have to give Continue:
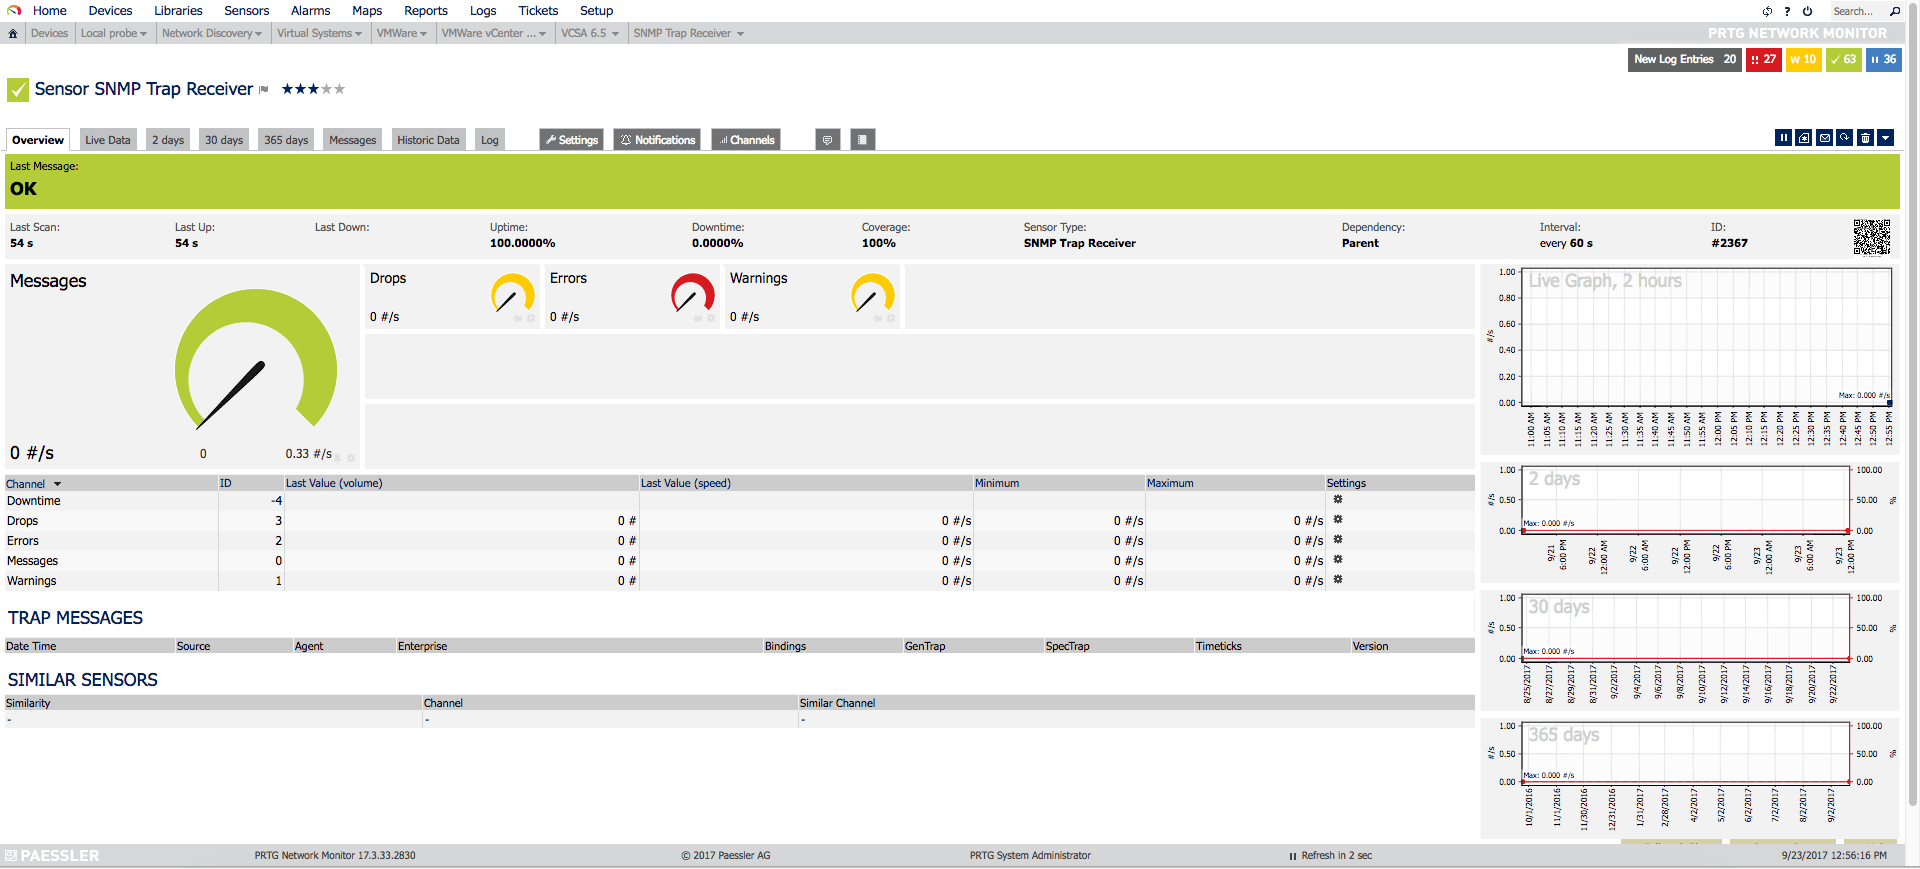
 The sensor will show us the number of Errors and Warnings as we receive the traps of each type:
Creating the VCSA 6.5 Host in PRTG
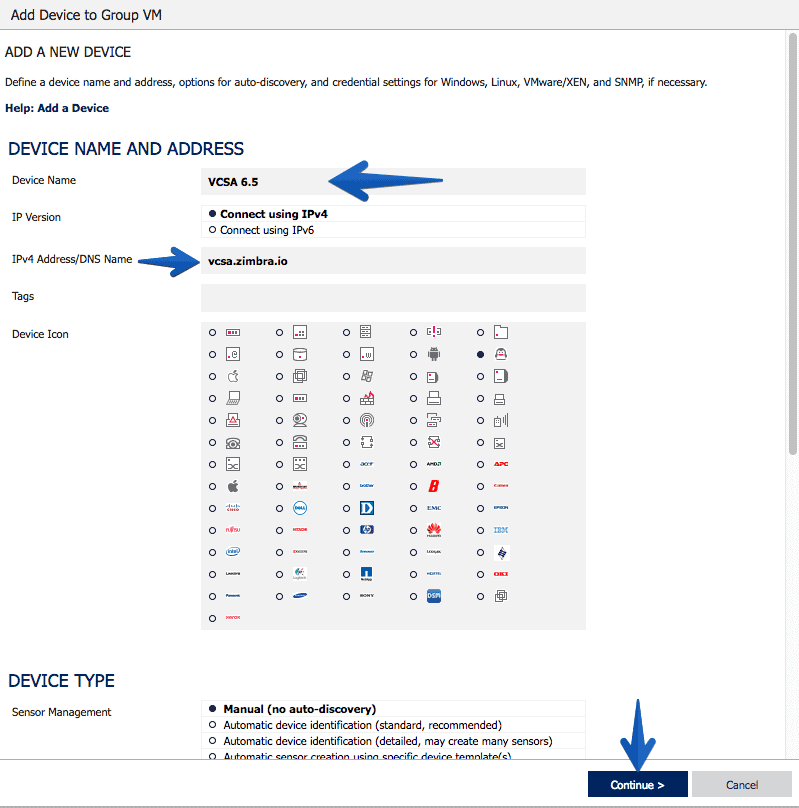
As always PRTG makes everything wonderfully simple, we will create a new Host, with the IP or hostname of our VCSA, an icon and press Continue, and that’s it:
Understanding what we can and want to monitor with SNMP in VCSA 6.5
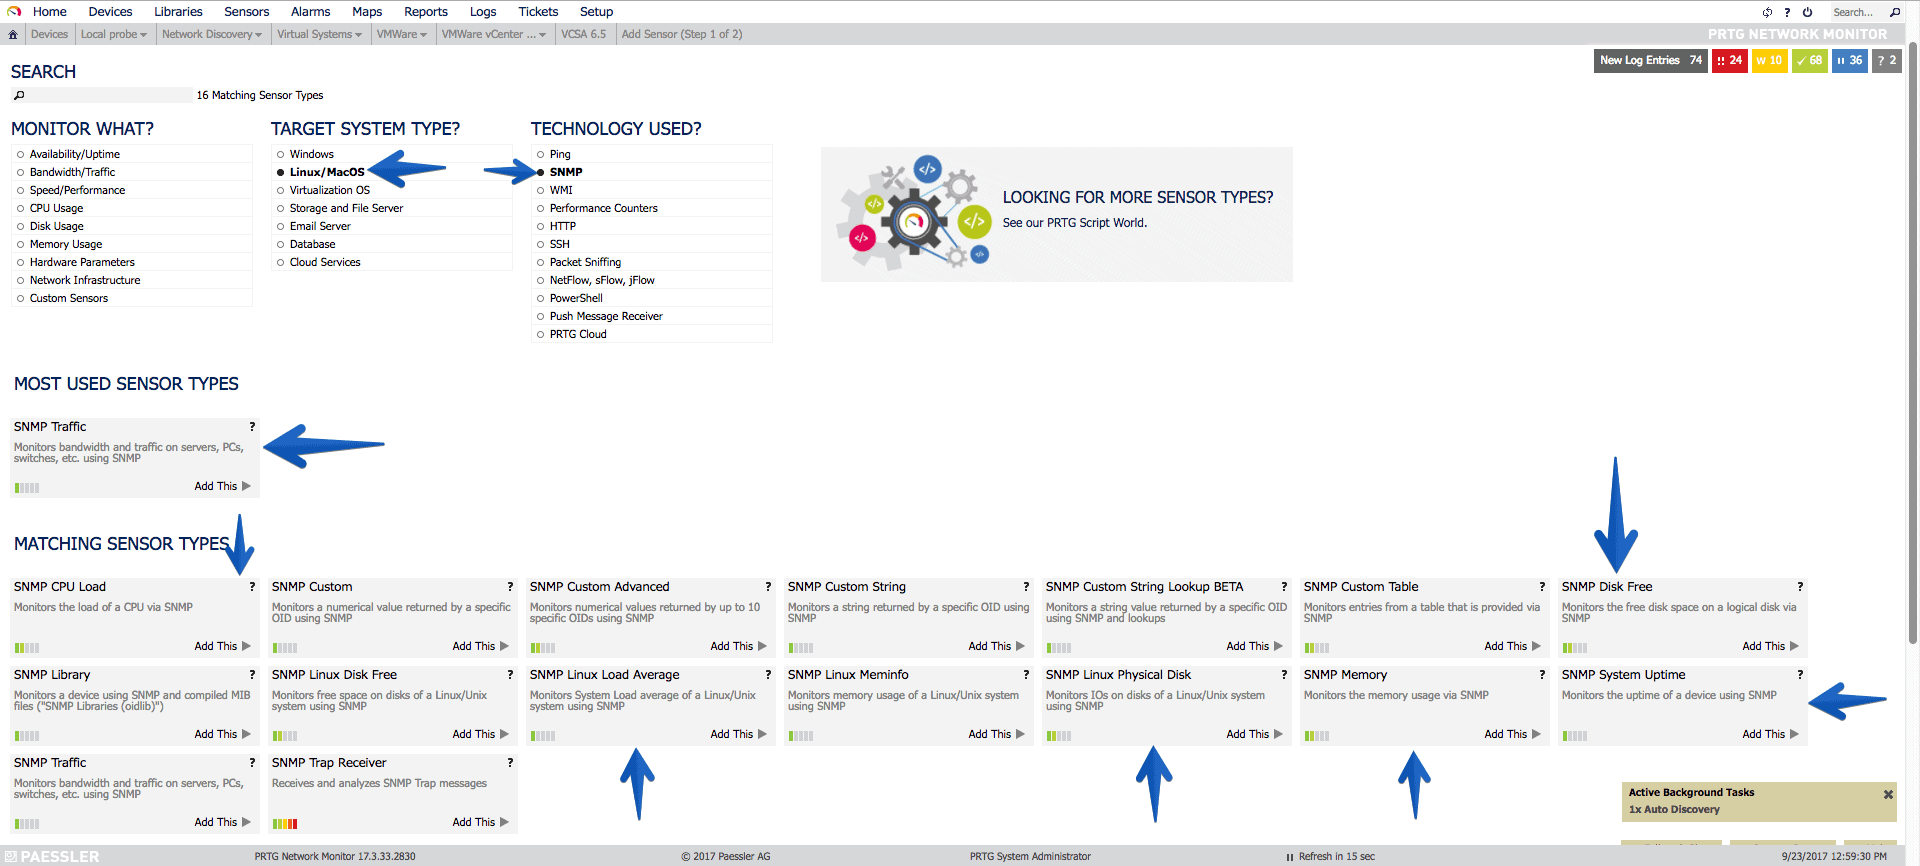
Fantastic, now that we have everything ready, we have to think about what we want to monitor in our VCSA, usually and as it is a Linux and SNMP environment, if we filter we get:
- That we can filter CPU, Disk Space, Network Traffic, Uptime, etc.
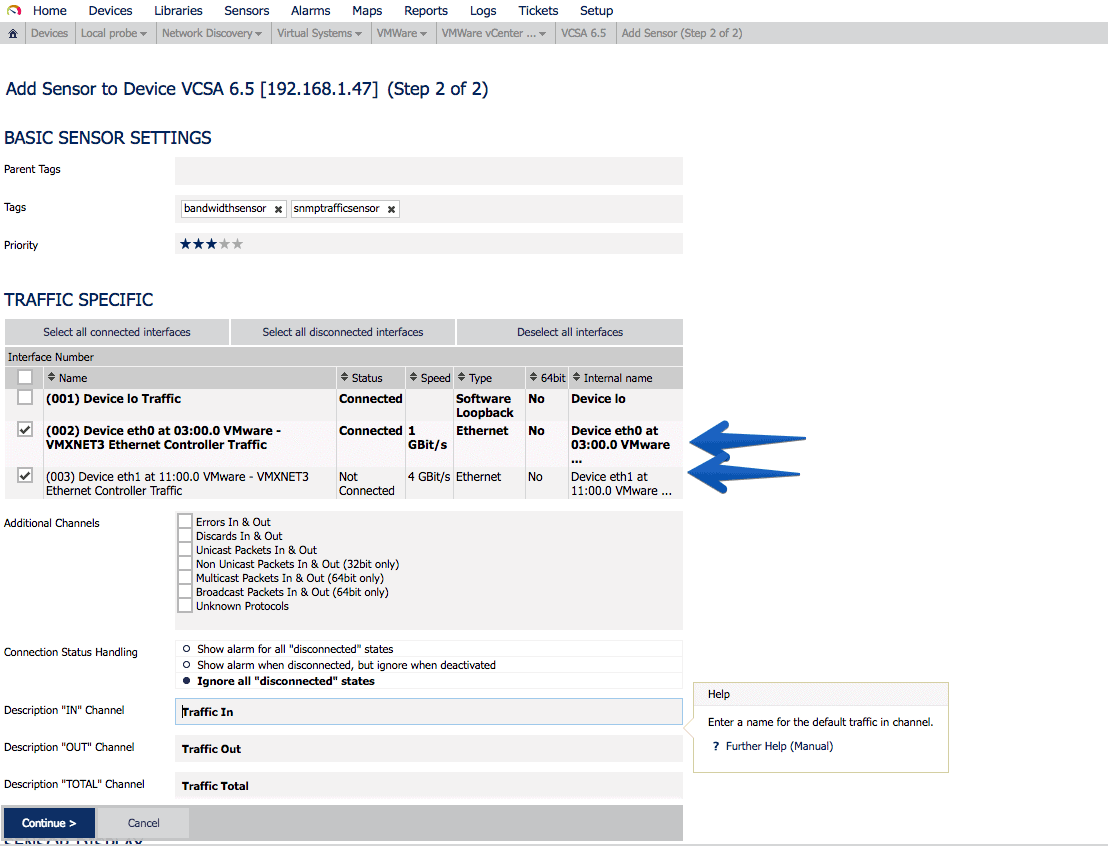
 Let’s start with the simple, with the interfaces of Network, in my case I have two interfaces since one is for HA, the so-called eth1. It’s always okay to monitor it and set an alarm when traffic alerts us, this will be that the HA process has been executed:
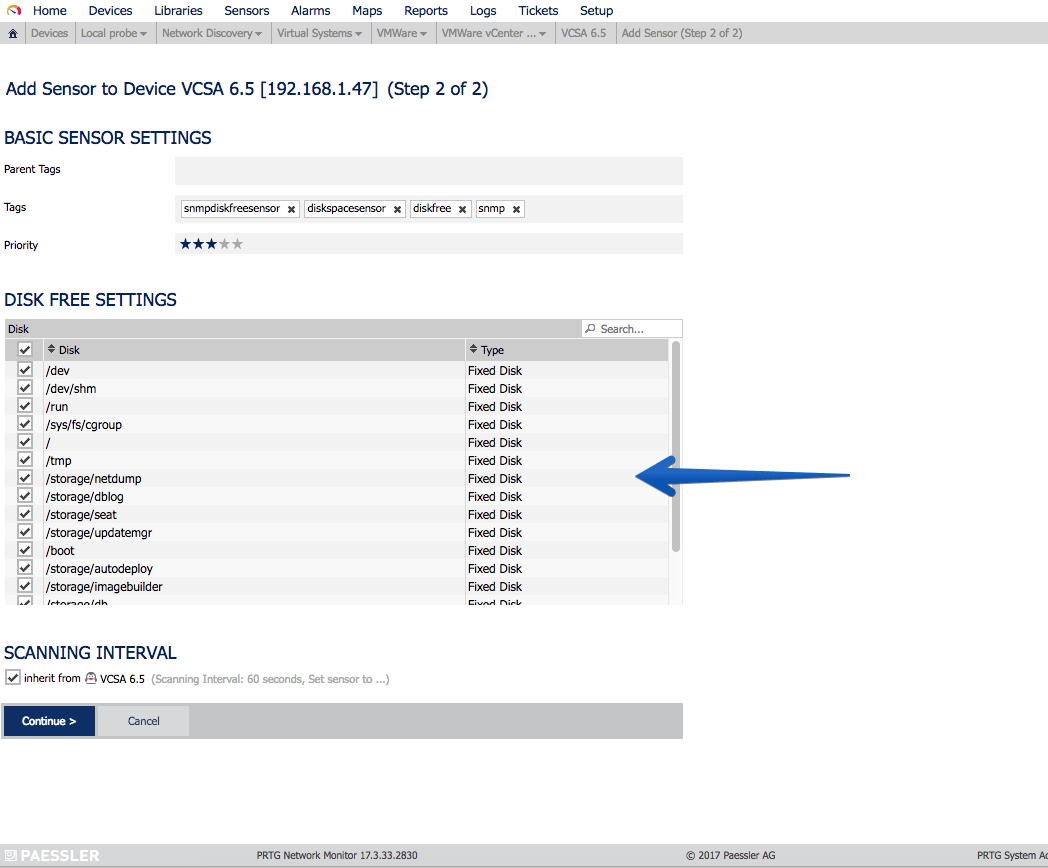
 Another very interesting sensor is undoubtedly the SNMP disk sensor, where we can monitor all our mounting points, which as you know VCSA comes with a particular partitioning that I recommend to have watched:
 The always important Uptime to know how long since the VCSA’s on:
 Let’s now use the custom MIBs we imported from VMware:
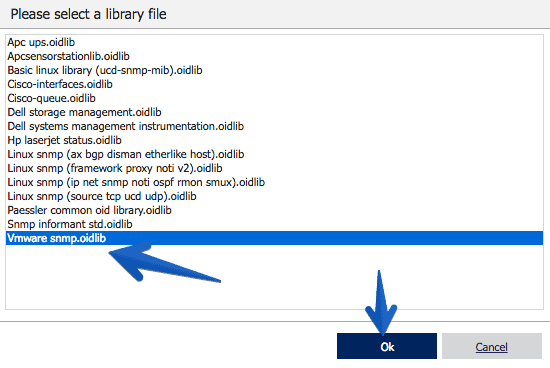
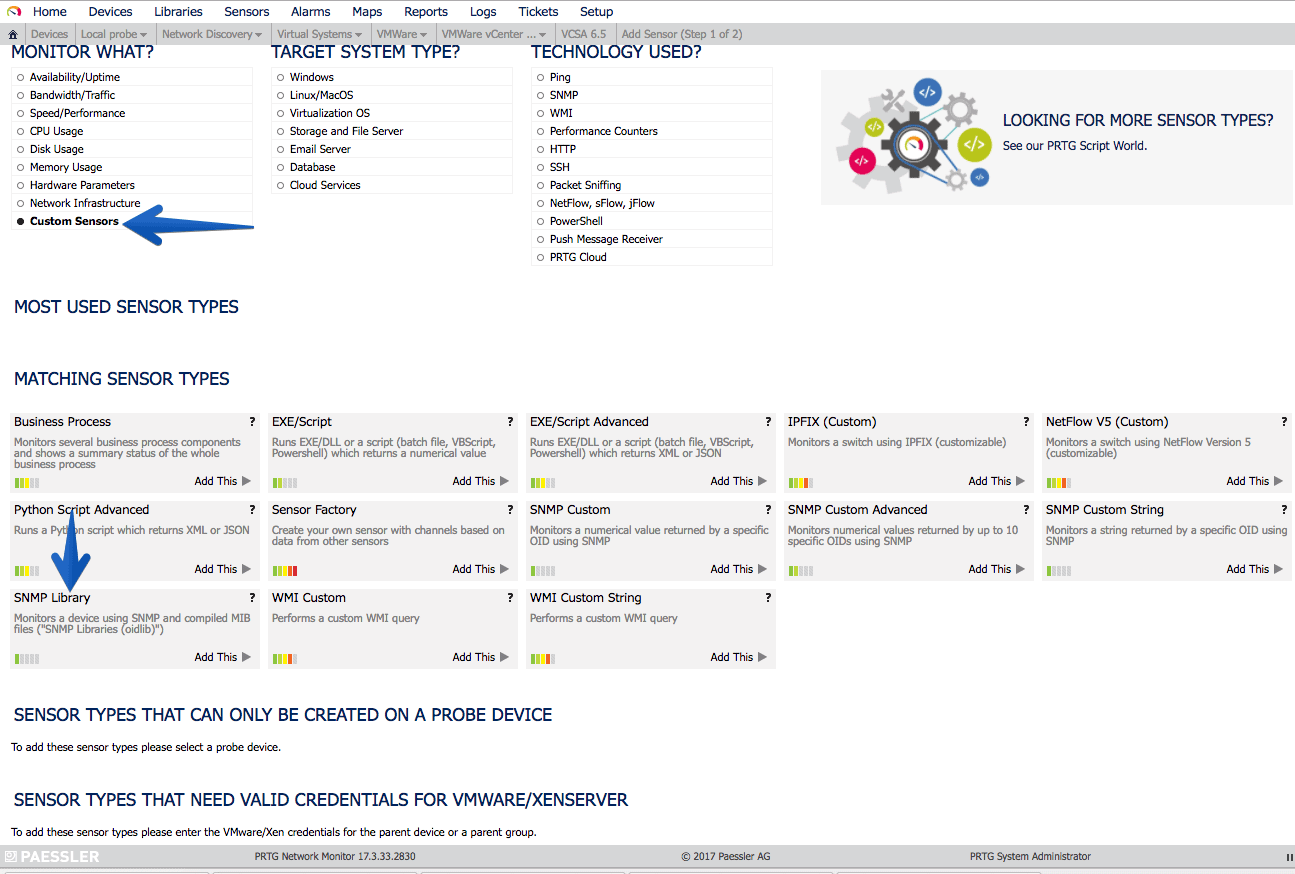 We’ll select our new VMware snmp oidlib:
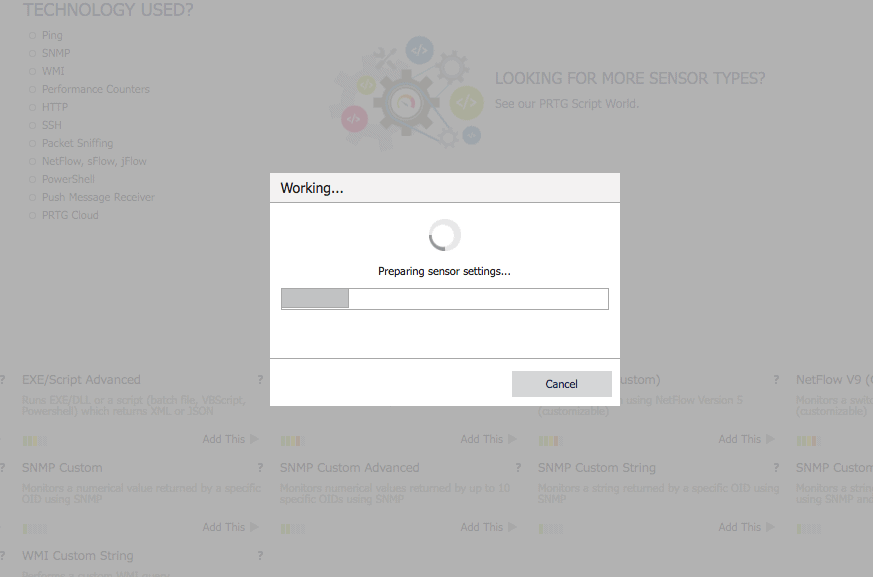
 The process takes a few seconds:
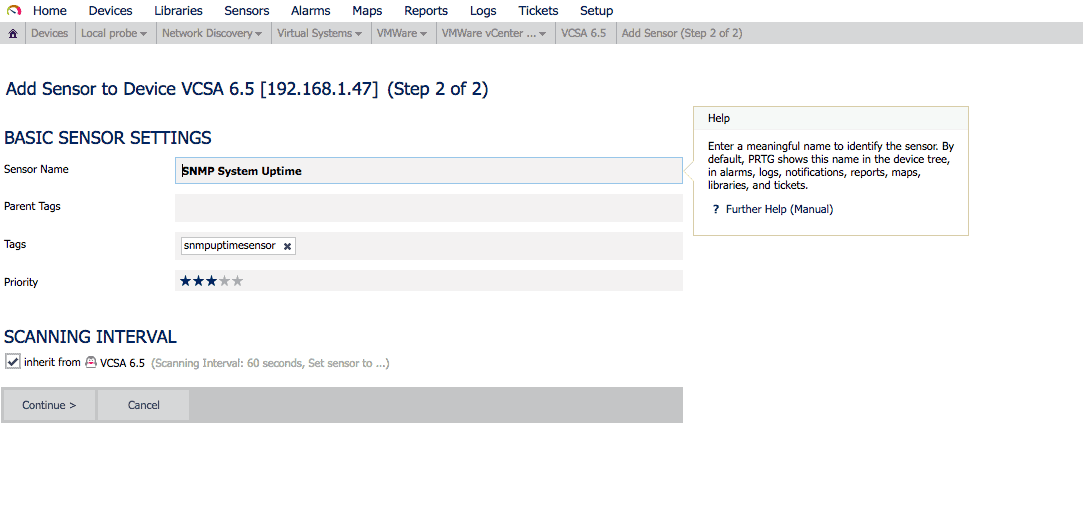
 As you can see in the OID library I now have many new options, in this case I want to monitor the SNMPv2-MIB-system-sys-descr:
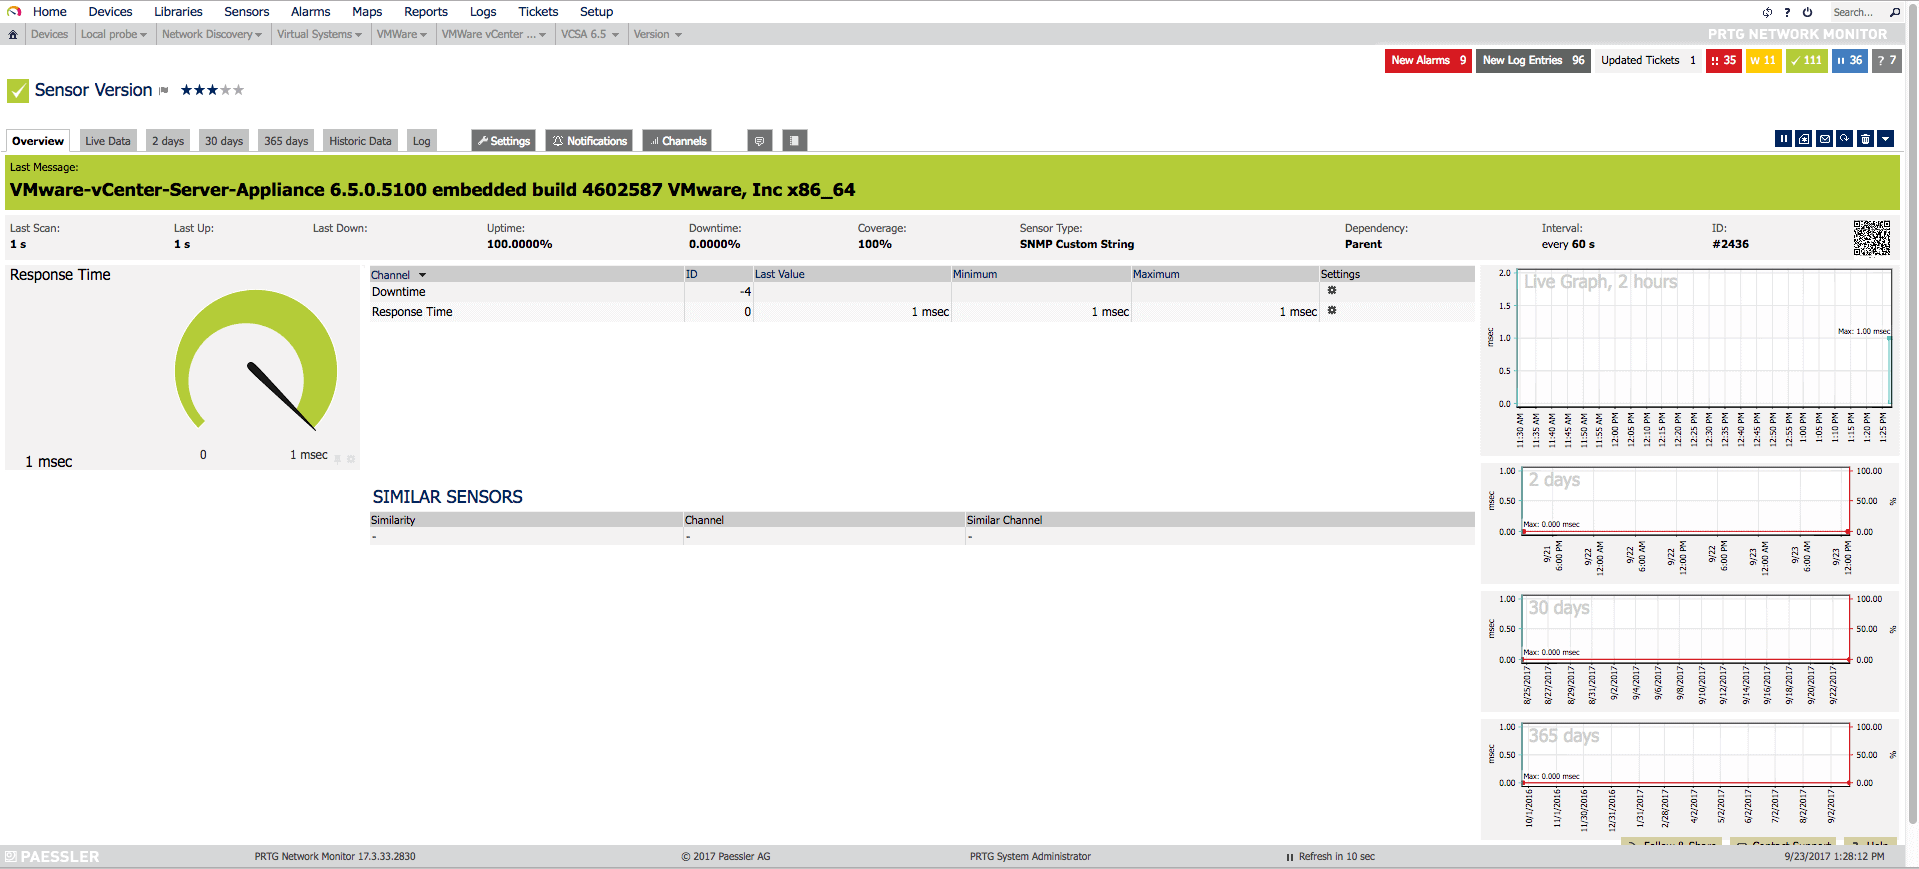
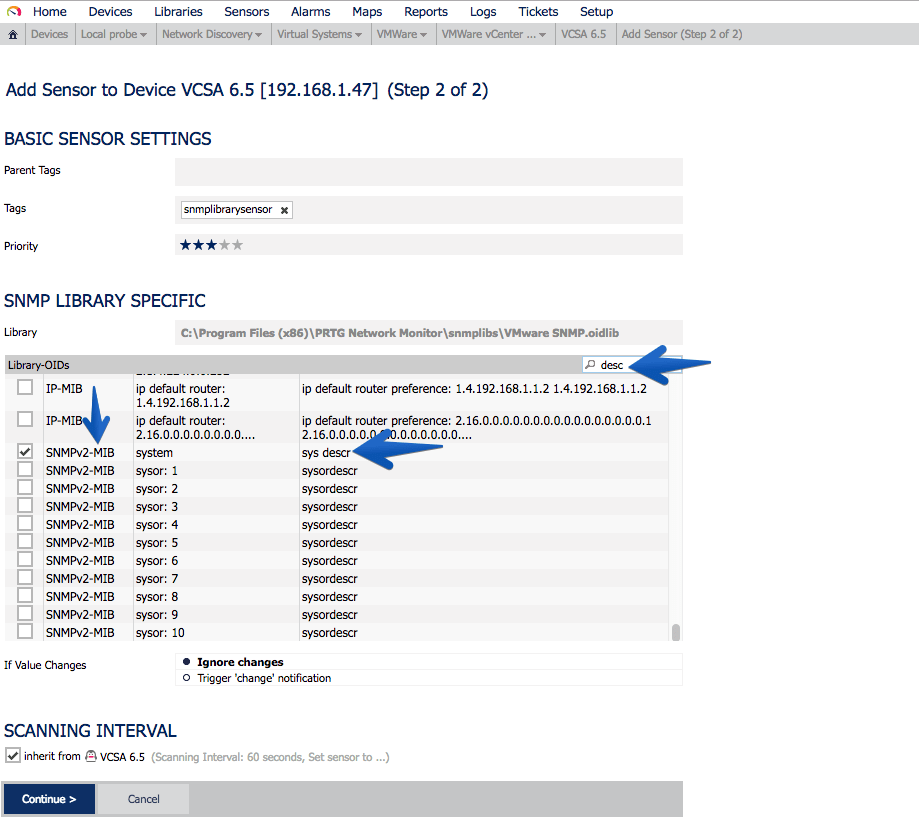 This sensor will remain in the following way, so that we can know the exact version that VCSA is running, without the need for Login, etc.
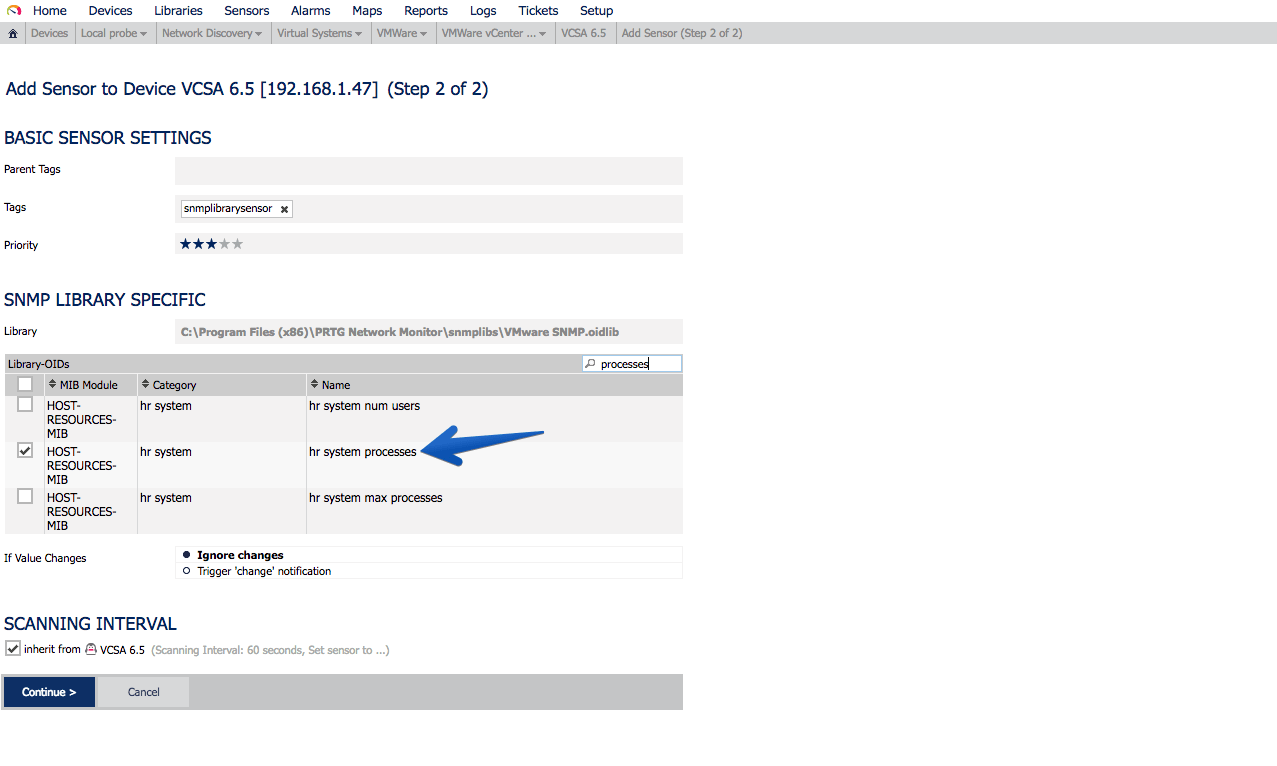
 Another very important sensor is the processes that are running, to know if for any reason we have more or less processes running than usual:
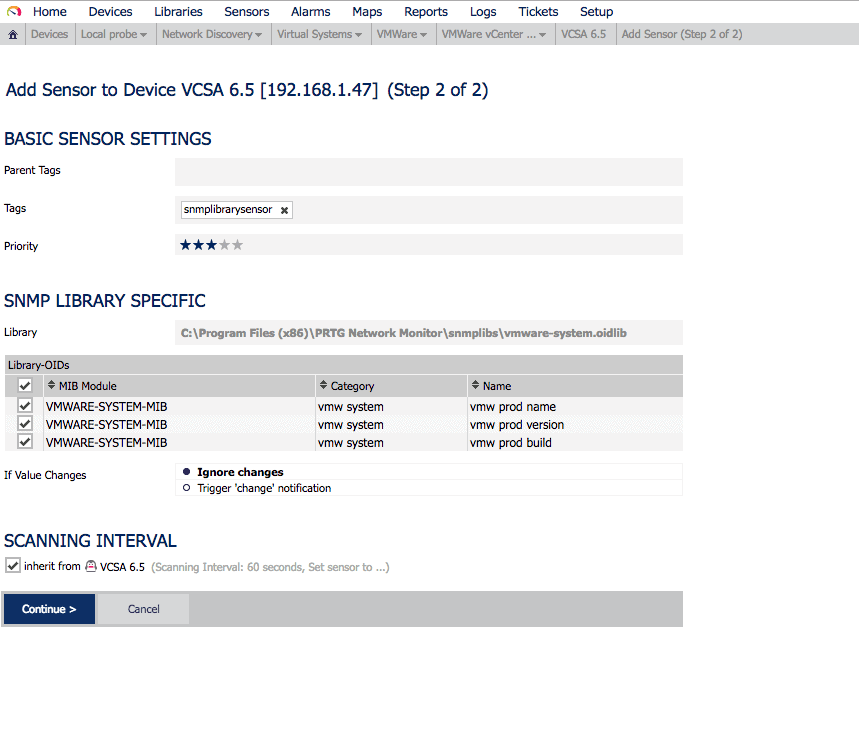
 If we use the MIB called VMWARE-SYSTEM-MIB, we can extract in a granular way the product name, version and build, this of course is not limited to VCSA, if we were monitoring more components of VMware that allow SNMP, we can have everything monitored globally with PRTG.
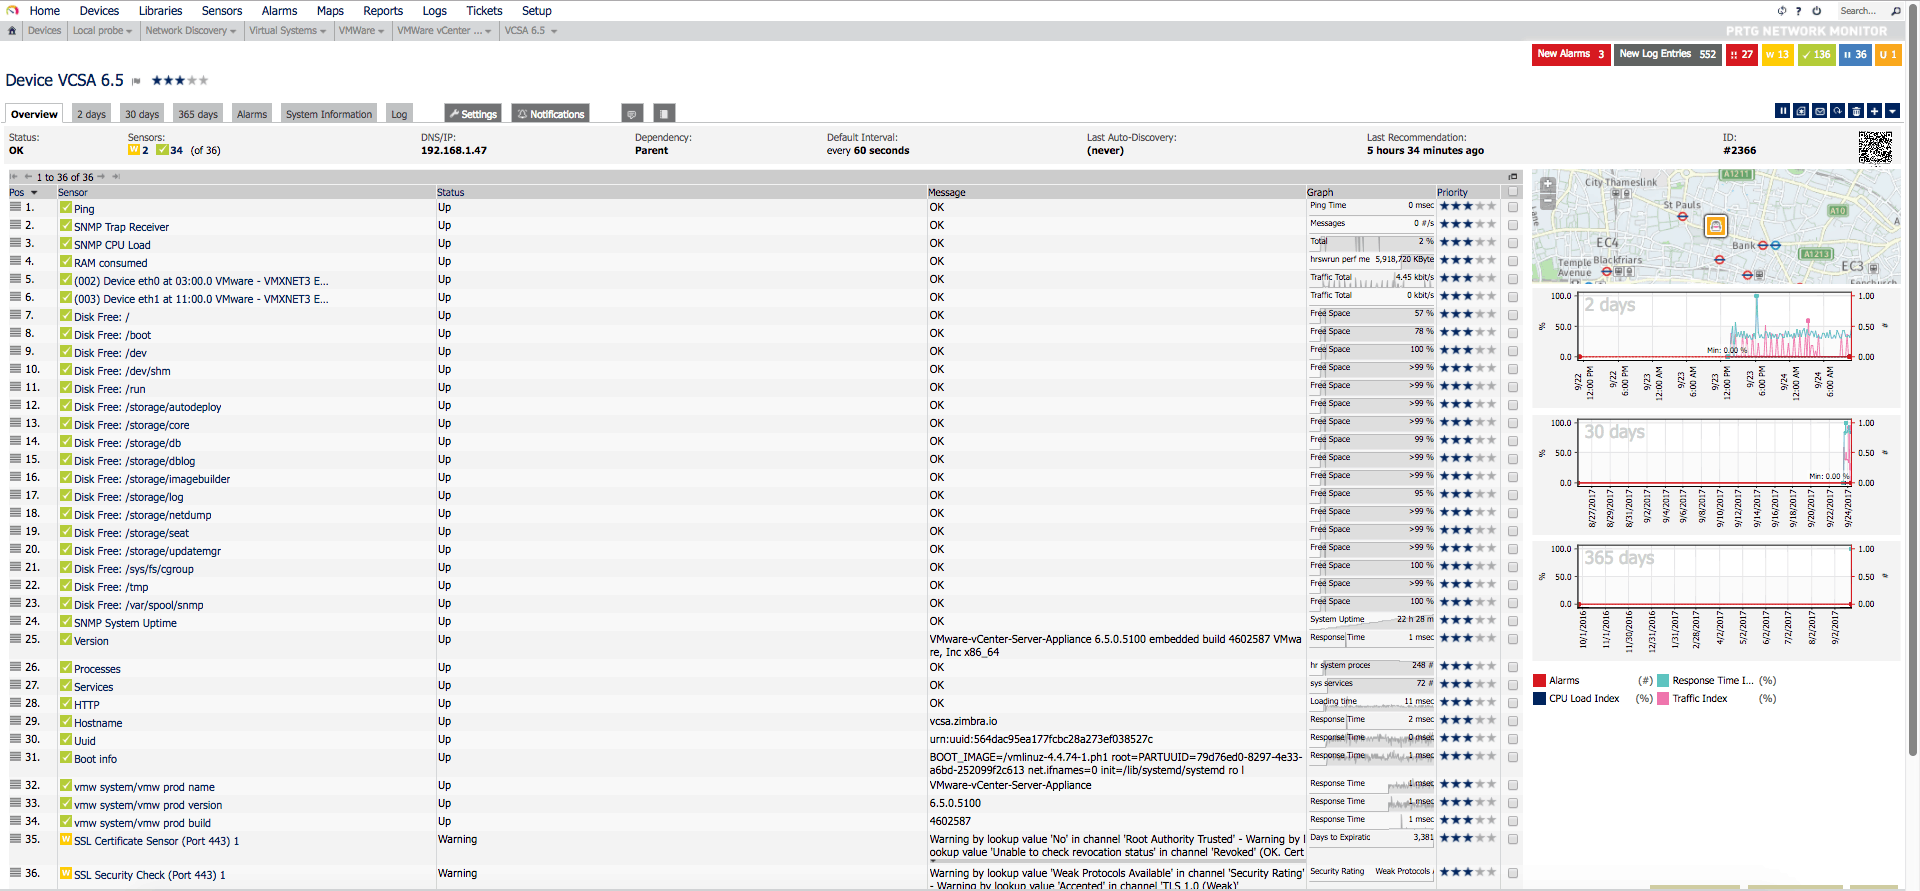
 After a while of monitoring, seeing which sensors to add, which not, and so on, we’ll see our VCSA with all these sensors:
 And if we work a little bit on the PRTG Map, we can get something as visual as this:
This is perfect for having it on the NOC screens, or to introduce different customers.
There’s more information about SNMP here:
Wish List
Some things I’d like VMware to include in future SNMP updates:
- SNMP MIB for clearer RAM
- MIB SNMP for system Load
- MIB SNMP to better monitor the local database
- MIB SNMP to monitor HA status
- MIB SNMP to monitor the Backup status
Thank you Jorge, awesome article. Rgds my friend.
Thanks Leo!! You can find it in our Language too – https://www.jorgedelacruz.es/2017/09/27/vmware-monitorizando-vcsa-6-5-usando-snmp-y-prtg-network-monitor/ 🙂
Appreciated the comment, take care.
BTW, if you’re still using community strings to configure snmp, please consider moving to SNMPv3. It provides SSL level security (SHA1, AES128), for examples see:
http://blog.epijunkie.com/2015/03/enable-snmpv3-on-vmware-vcsa-6-0/
Also there’s a second command script if using the appliancesh isn’t useful, and it works on VCHA configuration
vicfg-snmp –help
Same command as was used in ESX3i (circa 2007)
Also, here are some KBs from VMware regarding SNMP:
Debugging notification (trap/inform) reception http://kb.vmware.com/kb/2035445
* Downloading MIB modules http://kb.vmware.com/kb/1013445
* Reverse Poll Feature akaSNMP Trap is repeated every 5 minutes http://ikb.vmware.com/kb/2020271
* OID list http://kb.vmware.com/kb/2054359
* Timeouts and SNMP https://ikb.vmware.com/kb/2100602
* Timeouts in ESXi snmp in storage apis: https://ikb.vmware.com/kb/2105674
* Monitoring VCSA using SNMP (2145018) http://kb.vmware.com/kb/2145018
* Understanding Layer 2 networking as reported by ESXi SNMP http://kb.vmware.com/kb/2118059
Thank you Michael, cool stuff here, I’ve used SNMP v1 for testing and easy purposes, but agreed v3 it’s the recommended, I have now another article to write then 🙂
For testing, I suggest using v3 with authLevel noAuthNoPriv.
Its simple to use like snmpv1/v2c.
eg snmpwalk -v3 -u persona -l noAuthNoPriv
is there a way to get esx monitoring through vcenter snmp ? rather then monitoring each esx server individually.
Thanks.
Hello! I will need to check but I’m sure it is a way to obtain those values, you might want to check the next project:
https://github.com/jorgedlcruz/vmware-grafana
It does what you are mentioning it here, but not on SNMP 😛
Best regards
Hello,
I saw you got a sensor RAM consumed. How did you do that? PRTG’s SNMP memory does not work, OID hr storage/ hr memory size keeps returning back value of 0
Hi Fadzli, take a look at my sensor:
https://www.dropbox.com/s/o8sk6zcl3gppuhx/RAM%20consumed%20_%20Sensor%20Details%20_%20PRTG%20Network%20Monitor%20%28WIN-BTLBAM3013F%29%20-%20Google%20Chrome%202018-03-06%2022.34.17.png?dl=1
Cheers
Hello,
is it possible to monitor the alarms in vcenter?
Alarms like vmachines need consolidation.
thank you sir, i tried but couldnt work. then i realised there were missing RPMs in the VCSA which is so strange. Thank you again for all this information!
Hi Jorge, thanks for your great posts about VCSA monitoring!
I looked at your sensor screenshot but wasn’t able to recreate that in my PRTG. Would you please provide some more detailed instructions on how to create that sensor to monitor RAM used inside the VCSA? Thanks a lot
I greatly appreciate this write-up; thank you!
How did you get the build/version/name together in one map object? Did you actually pull them in as one sensor? … because they show as three separate sensors for me.
Ignore! I re-did the import and now have it as one sensor. Thank you. 🙂
Ha! Good to know Ahmed! Cheers!