
 Greetings friends, today I bring you a very interesting entry on how to monitor the status of your Supermicro equipment, in my homelab I have the brand-new Supermicro Superserver 5028D-TN4T
To do this, we will use PRTG again as our application to monitor, we will also monitor the Supermicro using Supermicro IPMI, finally we will make use of Supermicro. mib for the IPMI.
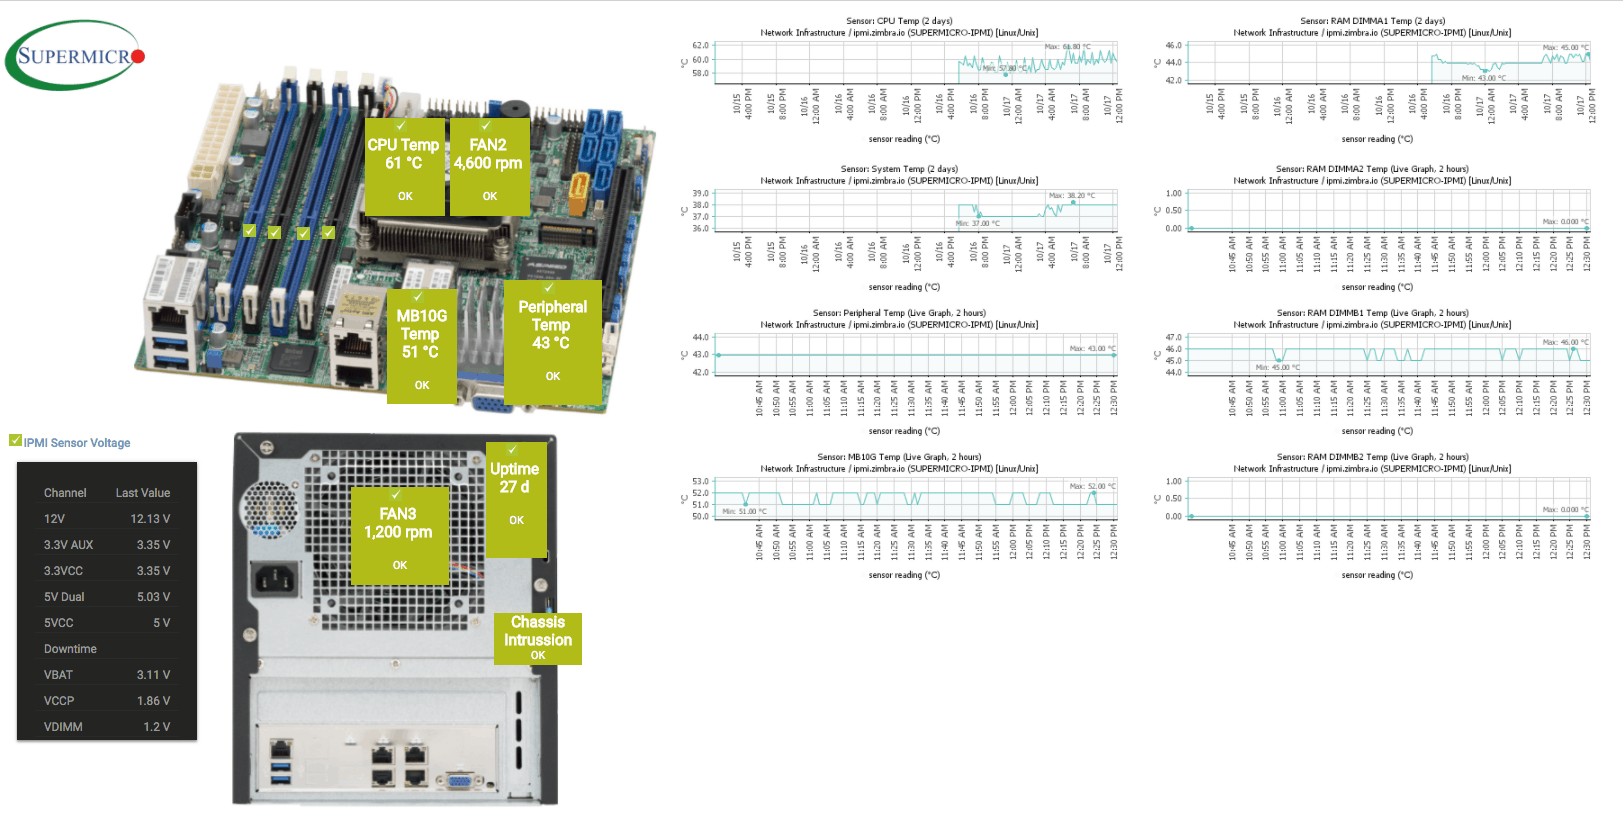
After this tutorial you will be able to have a diagram similar to this one where you can control the temperature of your equipment:
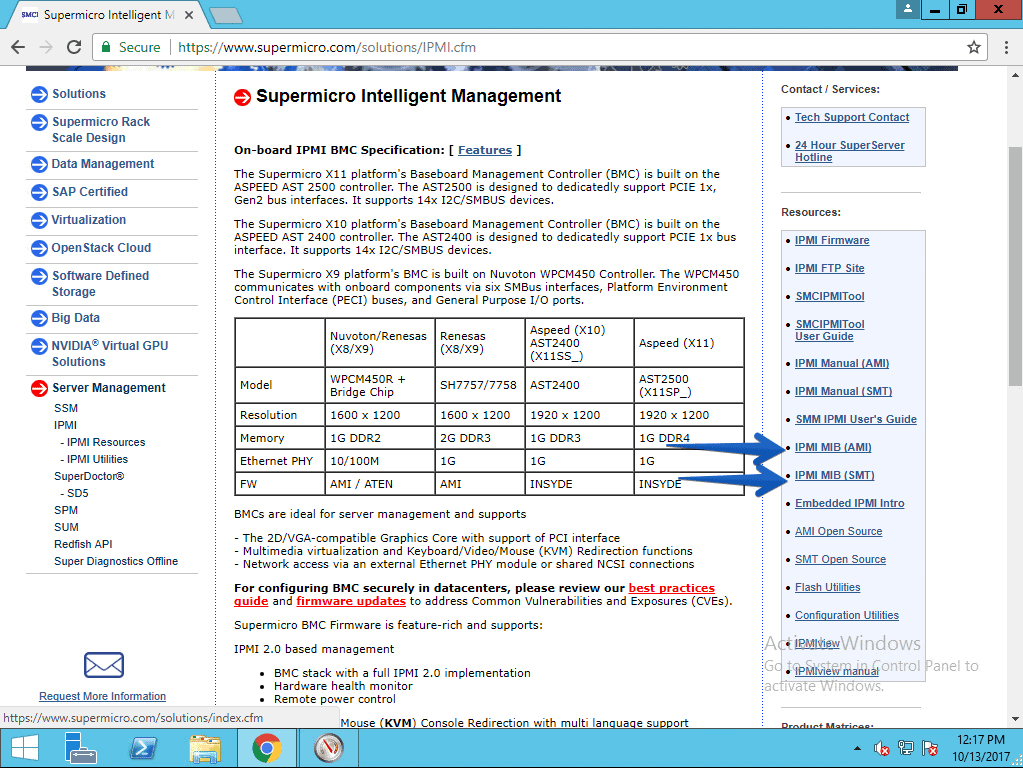
Downloading the MIB from the Supermicro website
We’ll start with the basics, we’ll go to the Supermicro URL where we can download the Supermicro IPMI MIB:
Importing Supermicro MIB into PRTG
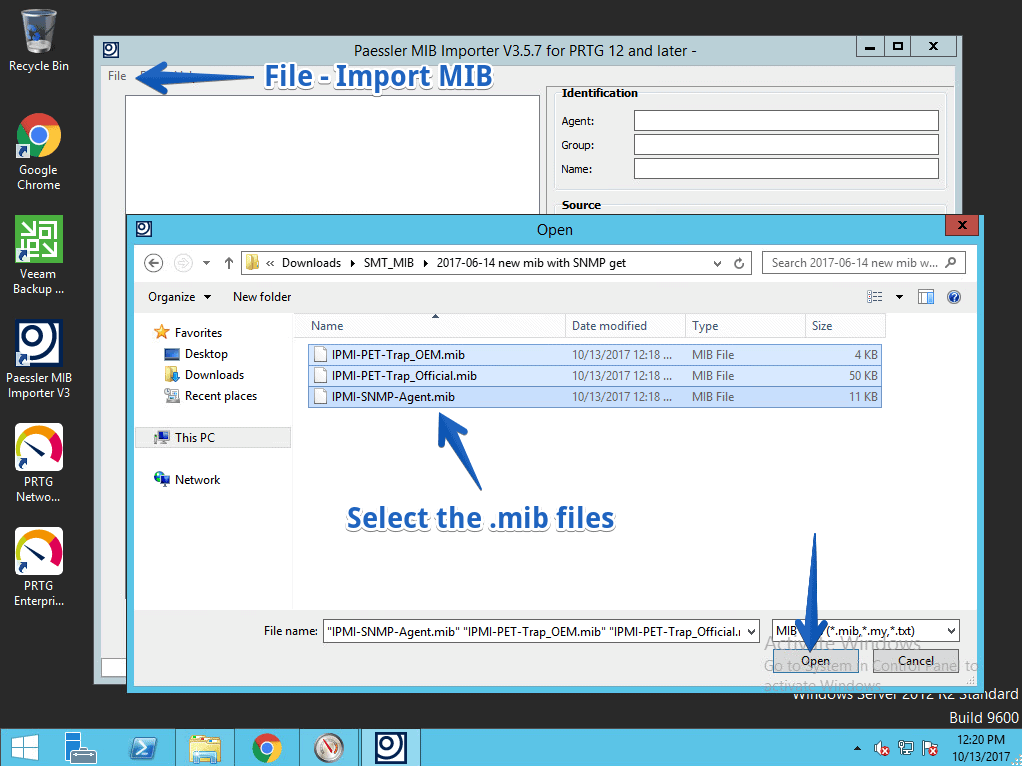
I have already shown you this procedure on previous occasions, but today I am showing it again for Supermicro, we will use the Paessler MIB Importer tool.
Click on File – Import MIB and select the MIBs you have downloaded:
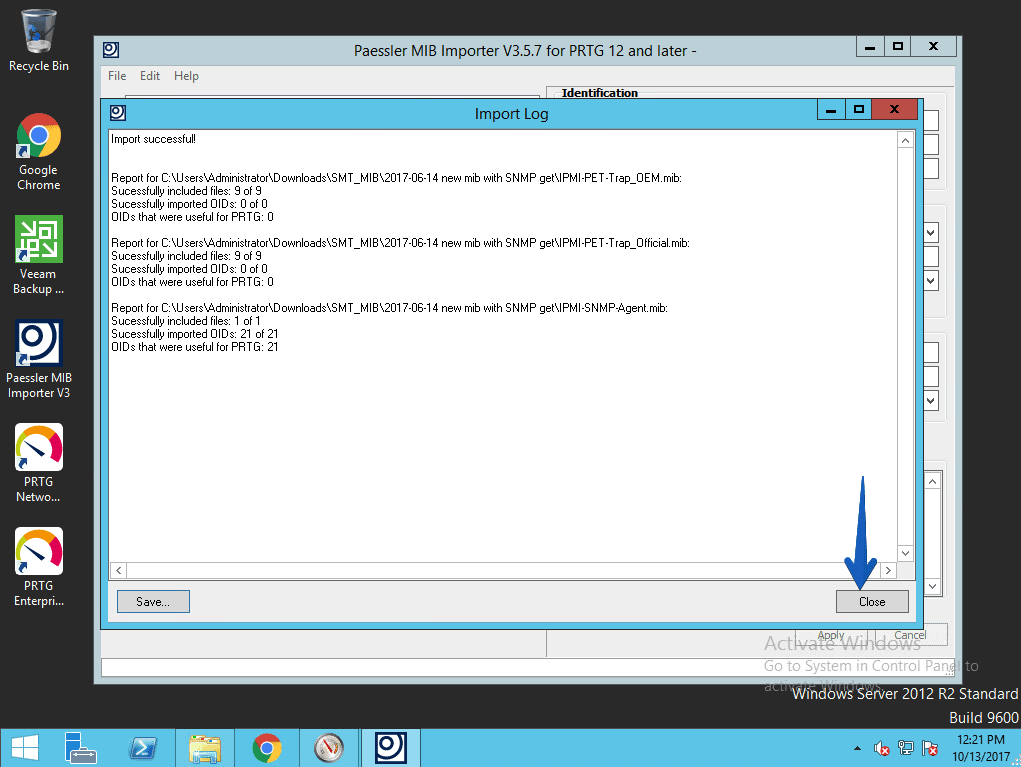
 We will see the message that they have been successfully imported and click Close:
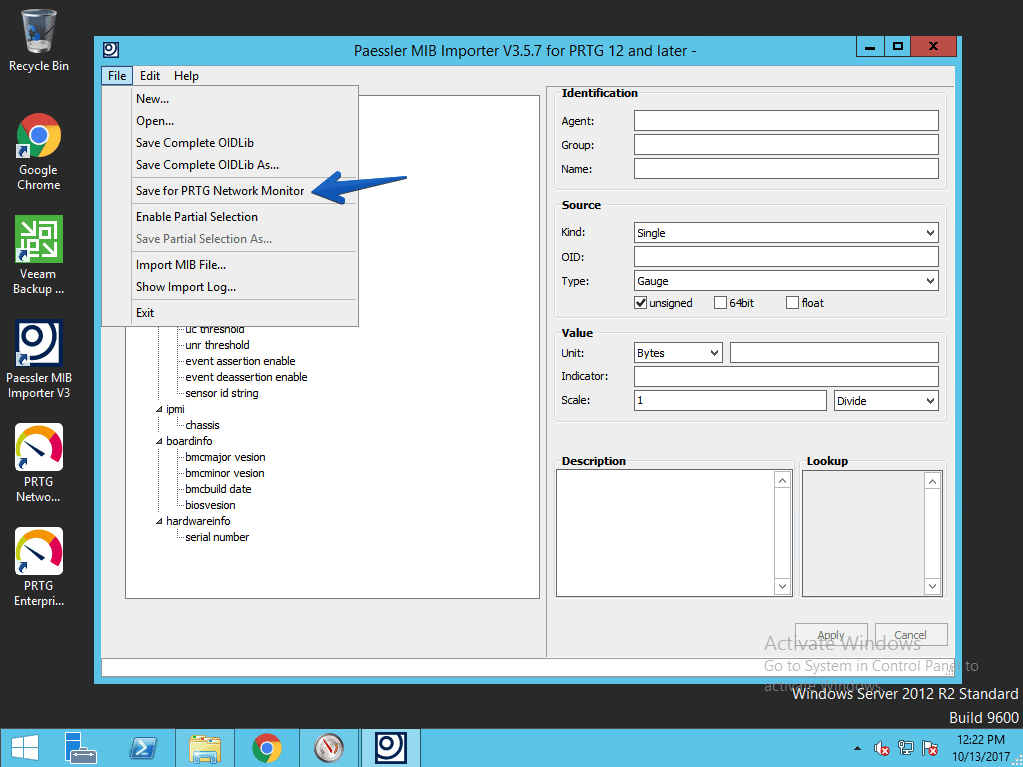
 We will tell you that we want to make a Save for PRTG Network Monitor:
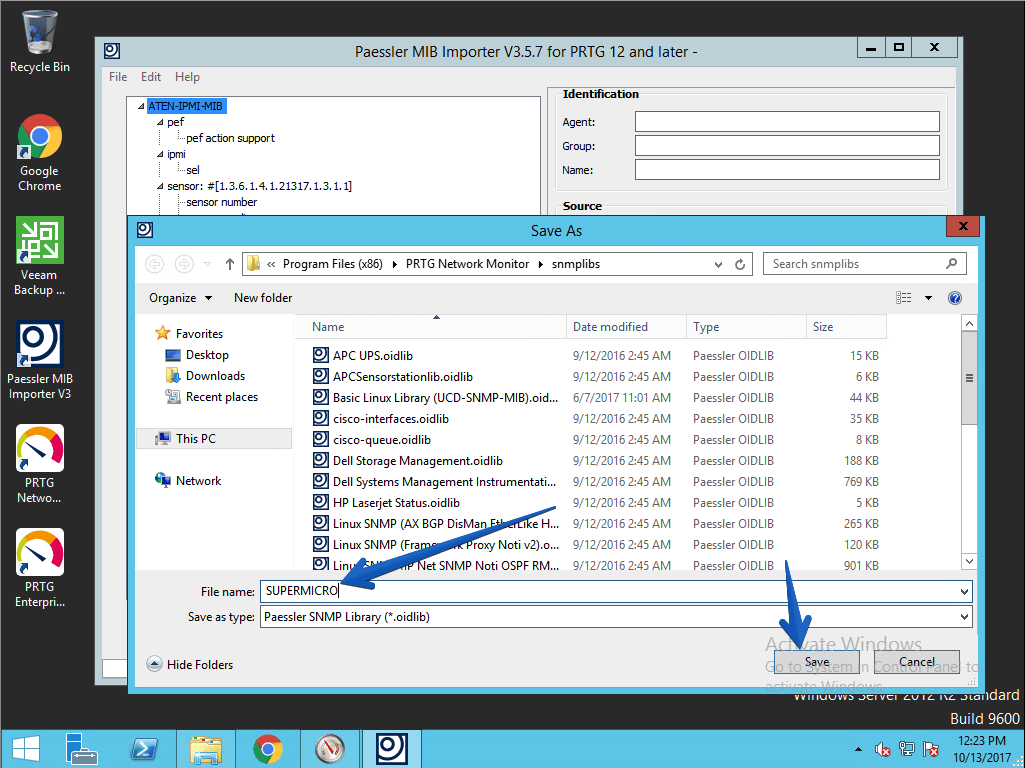
 With the name Supermicro:
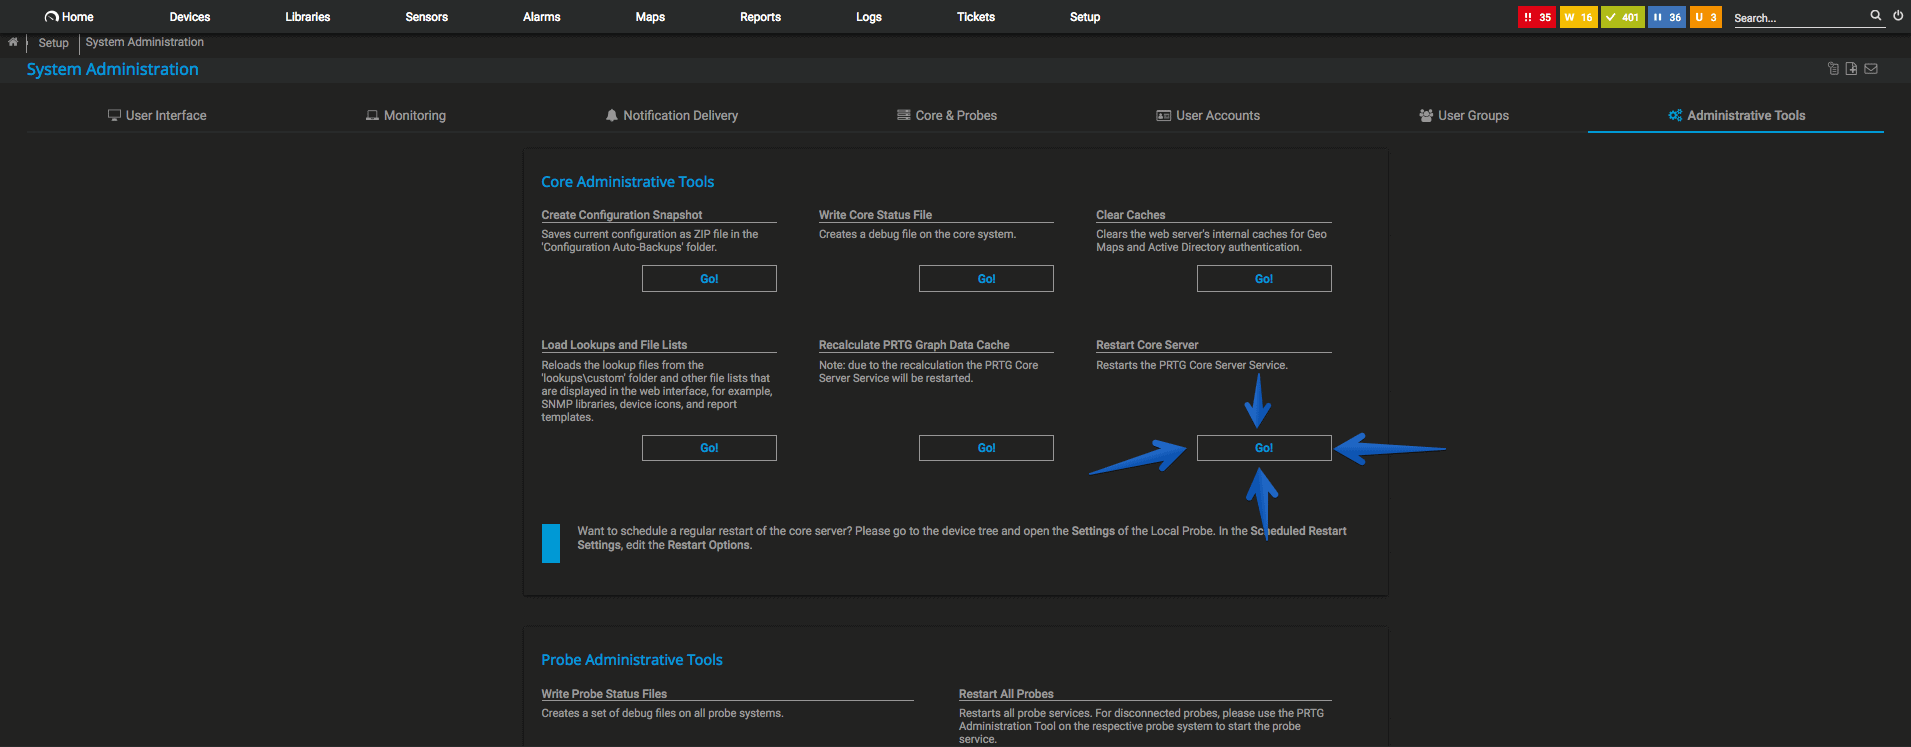
 We restart the core services of PRTG:
Enabling SNMP in our Supermicro IPMI
To monitor Supermicro IPMI using SNMP, we will have to activate and configure the service, to do this we will go to a browser and open the IP of IPMI, enter our credentials and once logged in, we will go to Configuration – SNMP
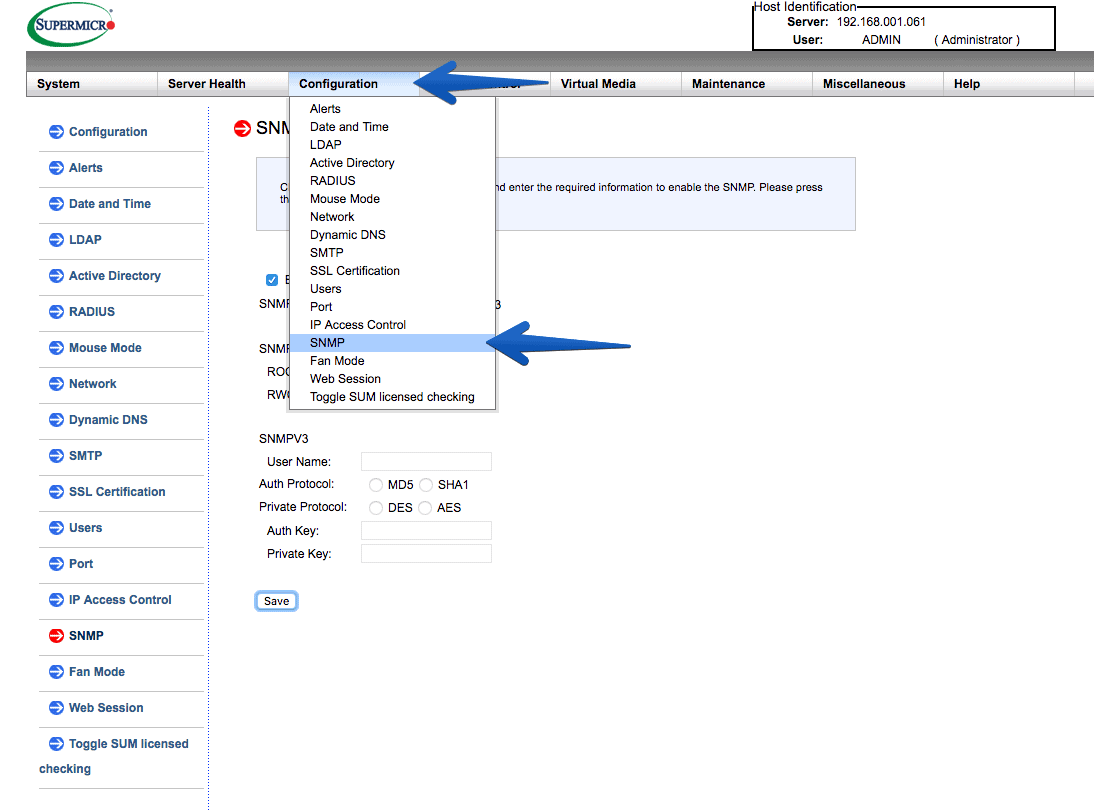 Once there, we will mark the check, and configure the parameters to our liking, in my case SNMPv2 with public community. We could opt for SNMPv3, if we are doing this monitoring in a non-secure VLAN or over the Internet:
 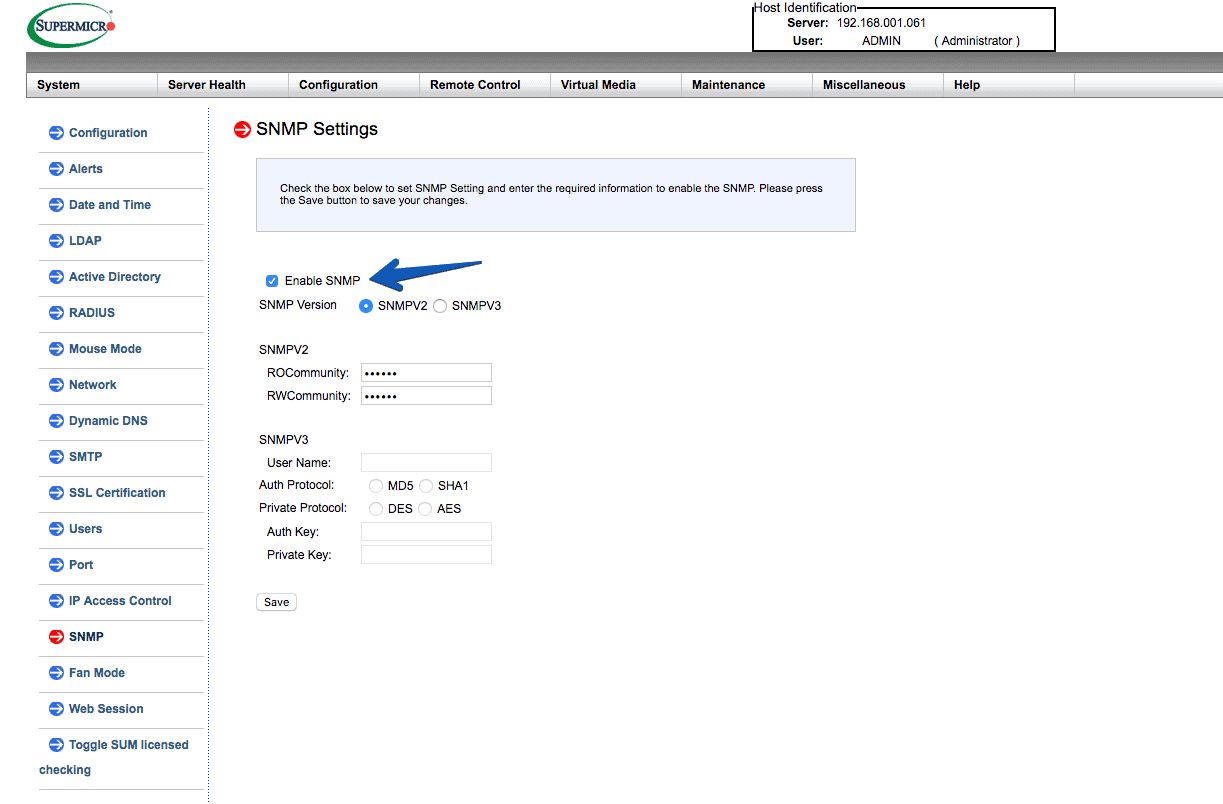 If we launch a snmpwalk -v2c -c public IP |more we can see that it works correctly:
snmpwalk -v2c -c public 192.168.1.61 |more
SNMPv2-MIB::sysDescr.0 = STRING: Linux (none) 2.6.28.9 #1 Fri Jul 17 14:32:46 CST 2015 armv5tejl
SNMPv2-MIB::sysObjectID.0 = OID: NET-SNMP-MIB::netSnmpAgentOIDs.10
DISMAN-EVENT-MIB::sysUpTimeInstance = Timeticks: (16752) 0:02:47.52
SNMPv2-MIB::sysContact.0 = STRING: root@
SNMPv2-MIB::sysName.0 = STRING: (none)
SNMPv2-MIB::sysLocation.0 = STRING: Unknown
SNMPv2-MIB::sysORLastChange.0 = Timeticks: (108) 0:00:01.08
SNMPv2-MIB::sysORID.1 = OID: SNMP-MPD-MIB::snmpMPDCompliance
SNMPv2-MIB::sysORID.2 = OID: SNMP-USER-BASED-SM-MIB::usmMIBCompliance
SNMPv2-MIB::sysORID.3 = OID: SNMP-FRAMEWORK-MIB::snmpFrameworkMIBCompliance
SNMPv2-MIB::sysORID.4 = OID: SNMPv2-MIB::snmpMIB
SNMPv2-MIB::sysORID.5 = OID: TCP-MIB::tcpMIB
SNMPv2-MIB::sysORID.6 = OID: IP-MIB::ip
SNMPv2-MIB::sysORID.7 = OID: UDP-MIB::udpMIB
SNMPv2-MIB::sysORID.8 = OID: SNMP-VIEW-BASED-ACM-MIB::vacmBasicGroup
SNMPv2-MIB::sysORID.9 = OID: SNMP-NOTIFICATION-MIB::snmpNotifyFullCompliance
SNMPv2-MIB::sysORID.10 = OID: NOTIFICATION-LOG-MIB::notificationLogMIB
SNMPv2-MIB::sysORDescr.1 = STRING: The MIB for Message Processing and Dispatching.
SNMPv2-MIB::sysORDescr.2 = STRING: The management information definitions for the SNMP User-based Security Model.
SNMPv2-MIB::sysORDescr.3 = STRING: The SNMP Management Architecture MIB.
SNMPv2-MIB::sysORDescr.4 = STRING: The MIB module for SNMPv2 entities
SNMPv2-MIB::sysORDescr.5 = STRING: The MIB module for managing TCP implementations
SNMPv2-MIB::sysORDescr.6 = STRING: The MIB module for managing IP and ICMP implementations
SNMPv2-MIB::sysORDescr.7 = STRING: The MIB module for managing UDP implementations
SNMPv2-MIB::sysORDescr.8 = STRING: View-based Access Control Model for SNMP.
SNMPv2-MIB::sysORDescr.9 = STRING: The MIB modules for managing SNMP Notification, plus filtering.
SNMPv2-MIB::sysORDescr.10 = STRING: The MIB module for logging SNMP Notifications.
SNMPv2-MIB::sysORUpTime.1 = Timeticks: (81) 0:00:00.81
SNMPv2-MIB::sysORUpTime.2 = Timeticks: (81) 0:00:00.81
SNMPv2-MIB::sysORUpTime.3 = Timeticks: (81) 0:00:00.81
SNMPv2-MIB::sysORUpTime.4 = Timeticks: (92) 0:00:00.92
SNMPv2-MIB::sysORUpTime.5 = Timeticks: (93) 0:00:00.93
SNMPv2-MIB::sysORUpTime.6 = Timeticks: (93) 0:00:00.93
SNMPv2-MIB::sysORUpTime.7 = Timeticks: (93) 0:00:00.93
SNMPv2-MIB::sysORUpTime.8 = Timeticks: (93) 0:00:00.93
SNMPv2-MIB::sysORUpTime.9 = Timeticks: (107) 0:00:01.07
SNMPv2-MIB::sysORUpTime.10 = Timeticks: (108) 0:00:01.08
IF-MIB::ifNumber.0 = INTEGER: 5
IF-MIB::ifIndex.1 = INTEGER: 1
IF-MIB::ifIndex.2 = INTEGER: 2
IF-MIB::ifIndex.3 = INTEGER: 3
Monitoring Supermicro temperature with PRTG
We have everything ready, let’s start with the chicha of the post then, the IPMI shows us very cool information if we go to Server Health – Sensor readings, these are the data we want to monitor with PRTG:
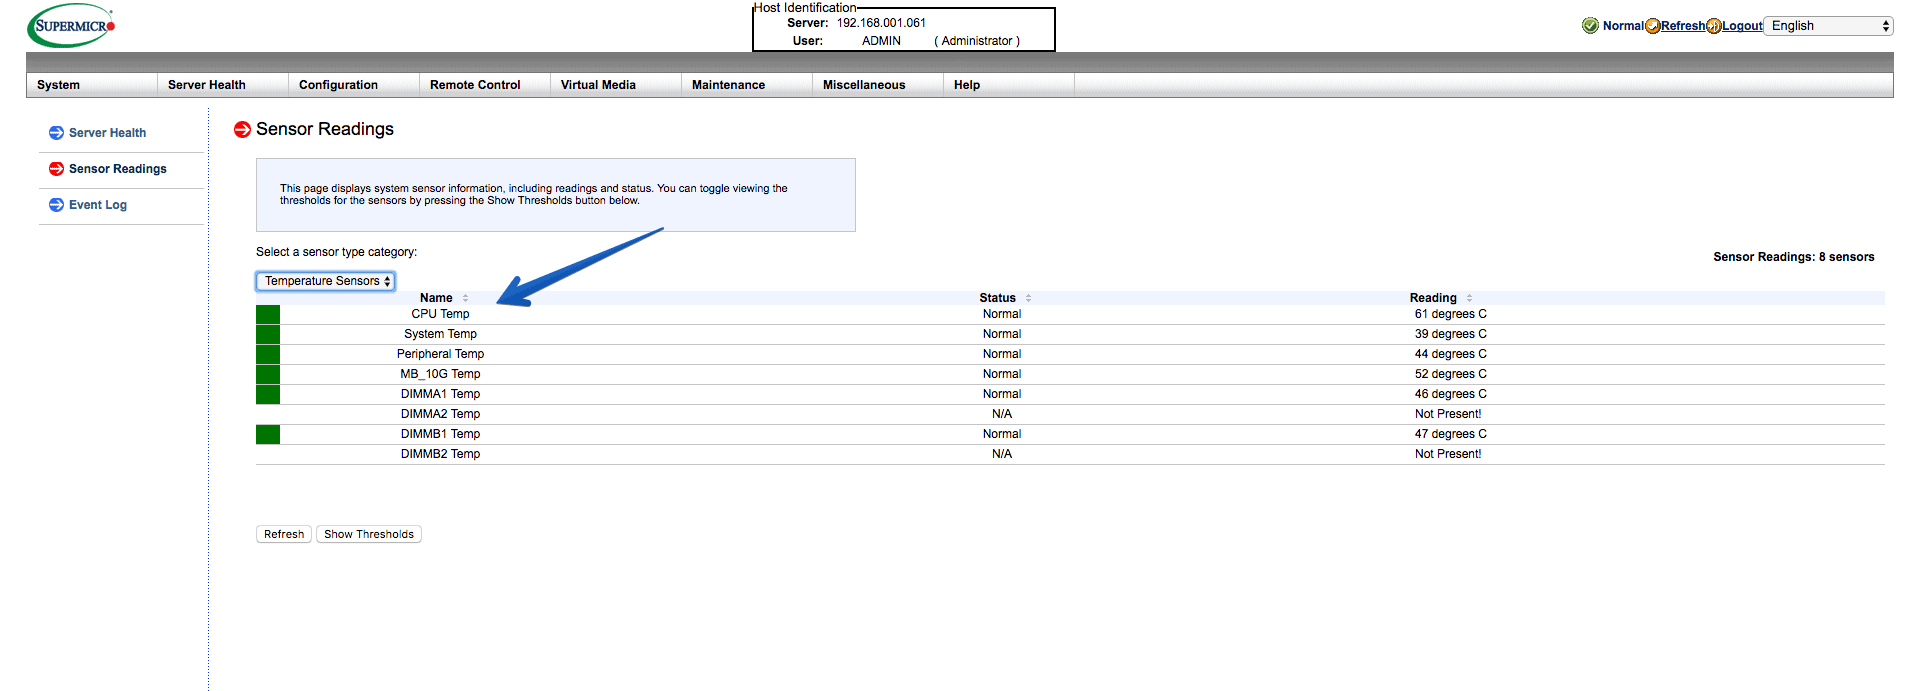 In short, the image we see above would be the following SNMP OID from Supermicro’s MIB, very useful for later use:
CPU - Sensor: 1/sensor reading
SYSTEM TEMP - Sensor: 11/sensor reading
PERIPHERAL TEMP - Sensor: 12/sensor reading
MB10G TEMP - Sensor: 13/sensor reading
RAM DIMMA1 TEMP - Sensor: 176/sensor reading
RAM DIMMA2 TEMP - Sensor:177/sensor reading
RAM DIMMB1 TEMP - Sensor: 180/sensor reading
RAM DIMMA2 TEMP - Sensor: 181/sensor reading
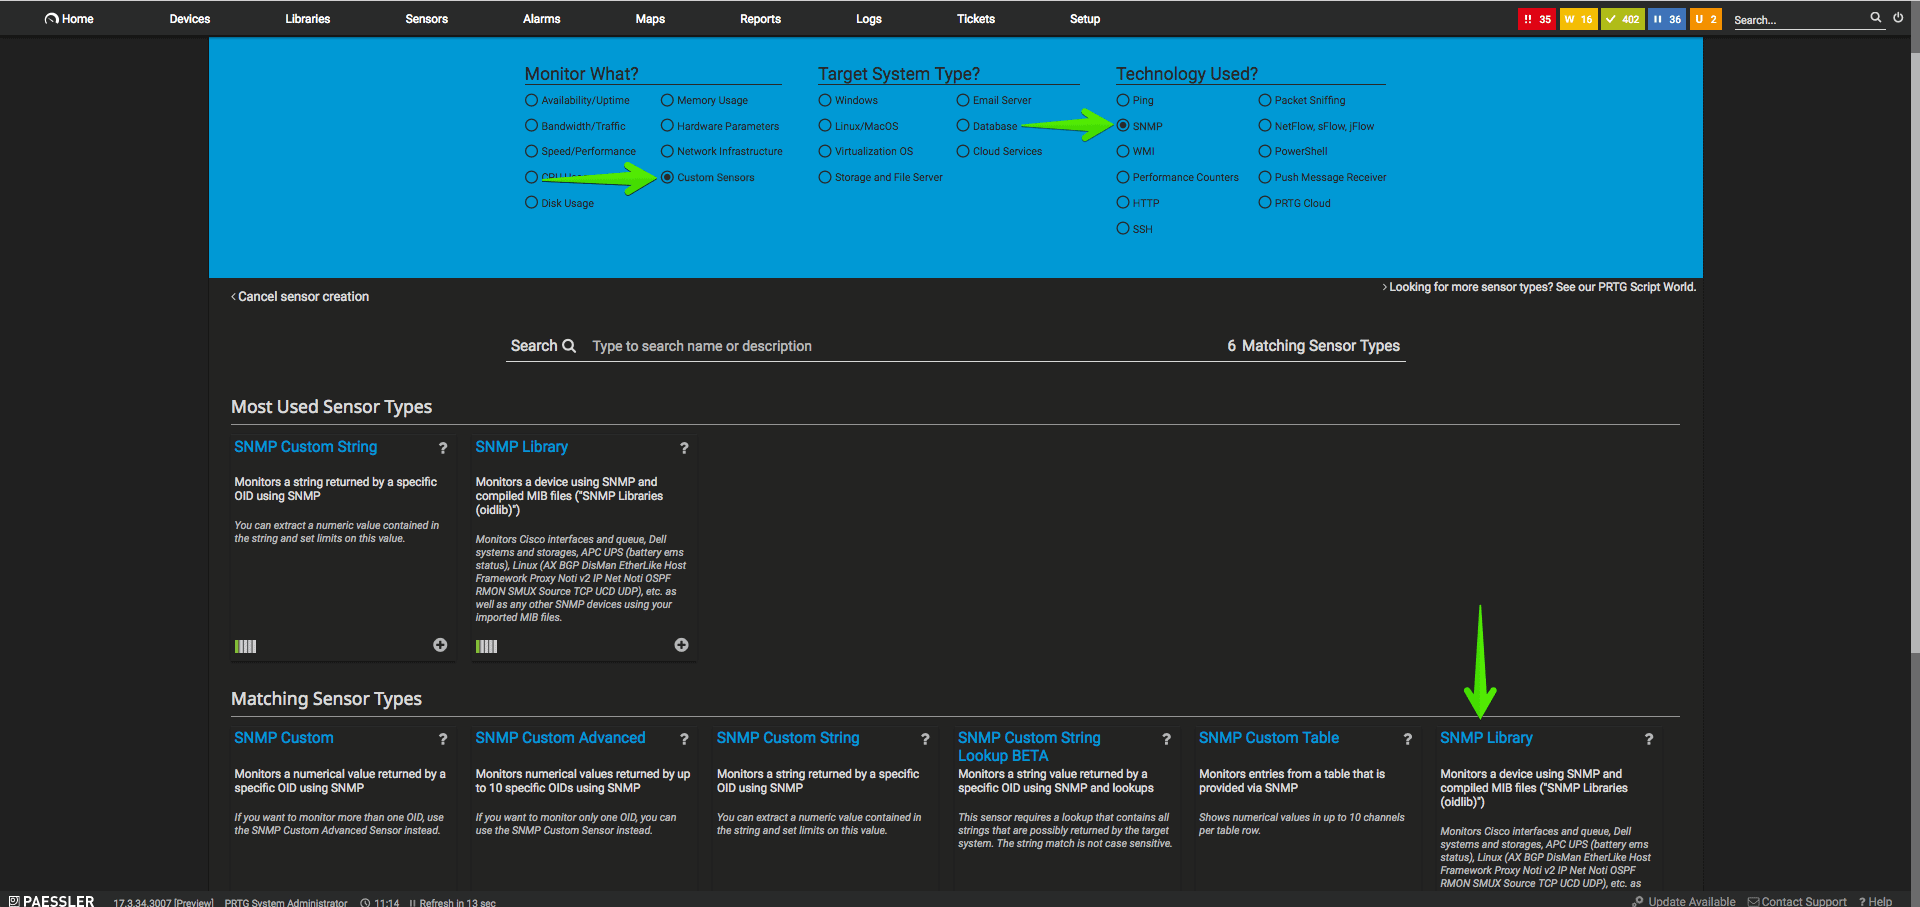
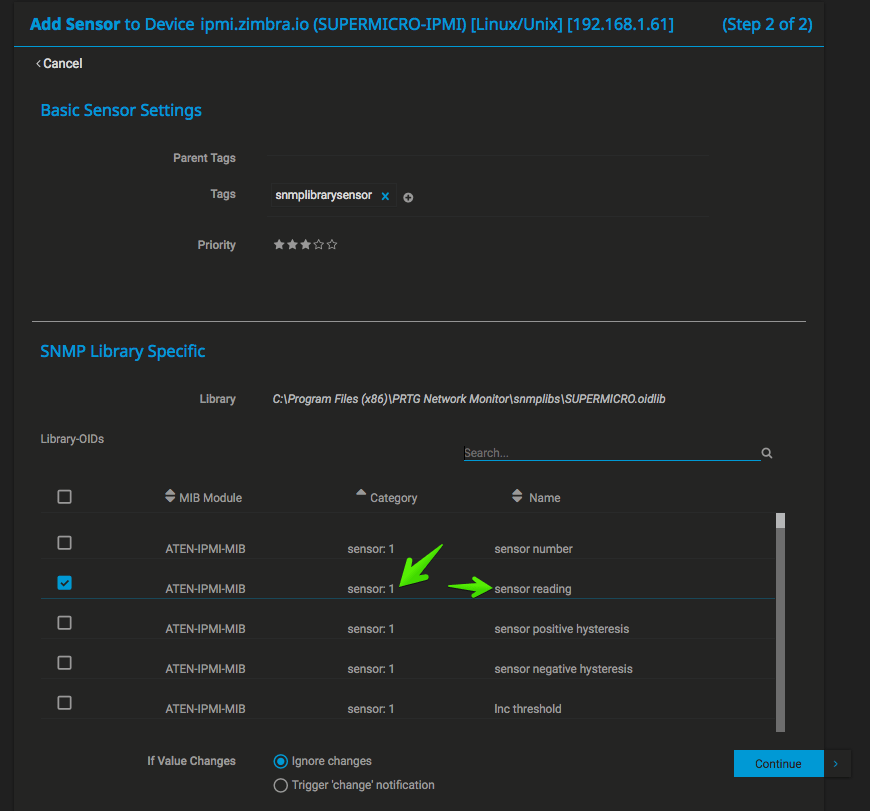
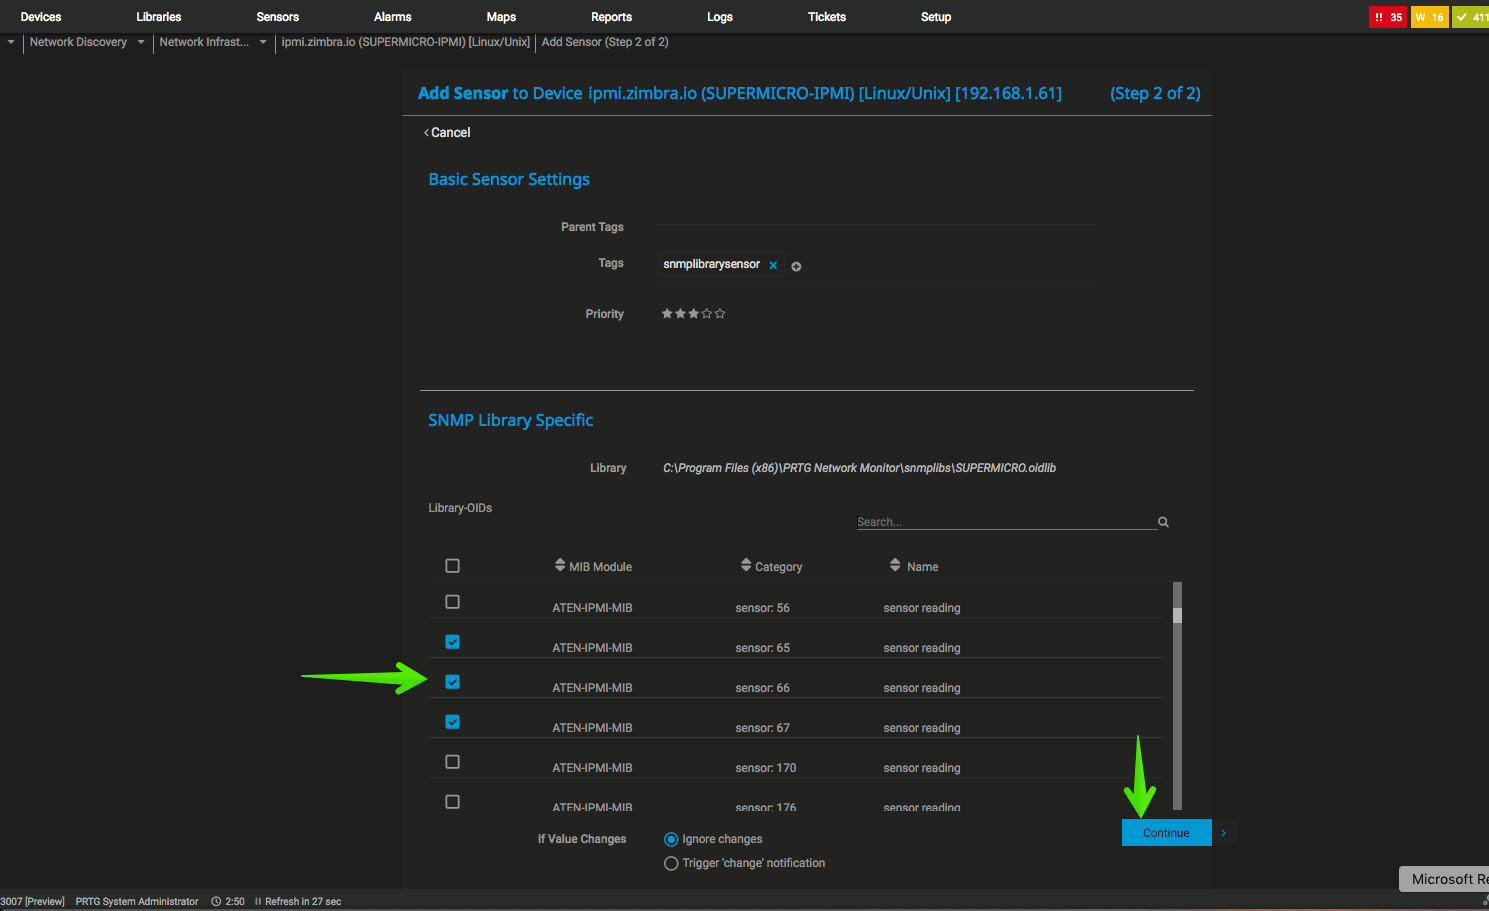
So, we go to our PRTG, and add one by one the ones mentioned above, we go to the Supermicro IPMI device, we will create a new SNMP- Custom type sensor and then we will mark SNMP Library:
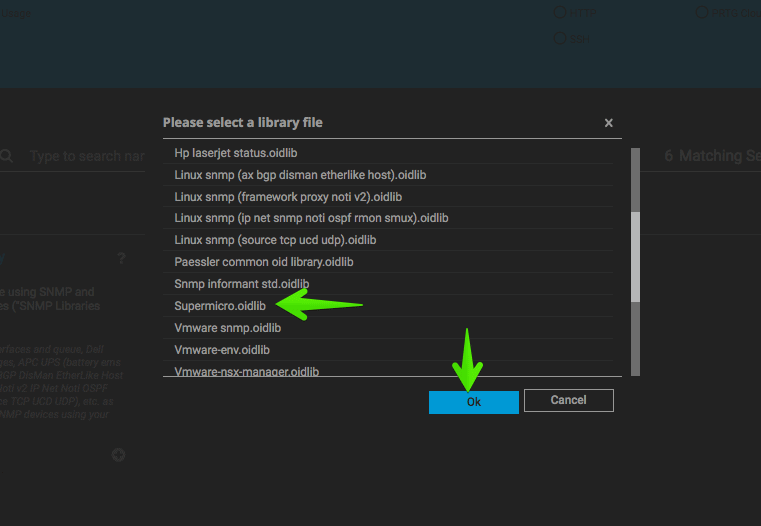
 We will now select the Supermicro library that we have created previously:
 And we will mark the sensors that I have previously mentioned to you, we can select them by searching for them, or scrolling:
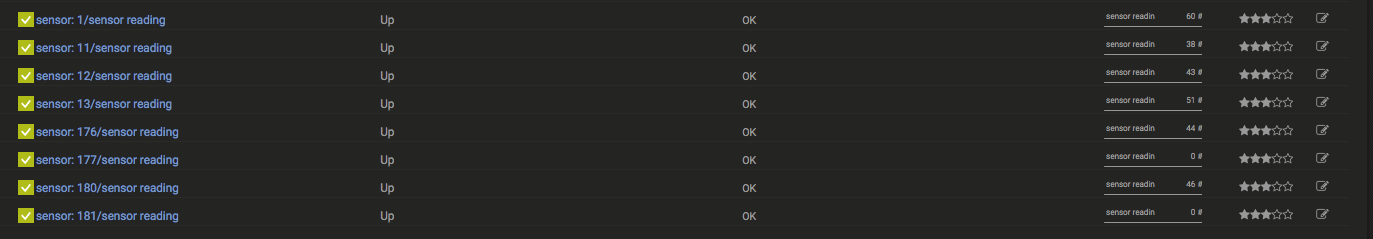
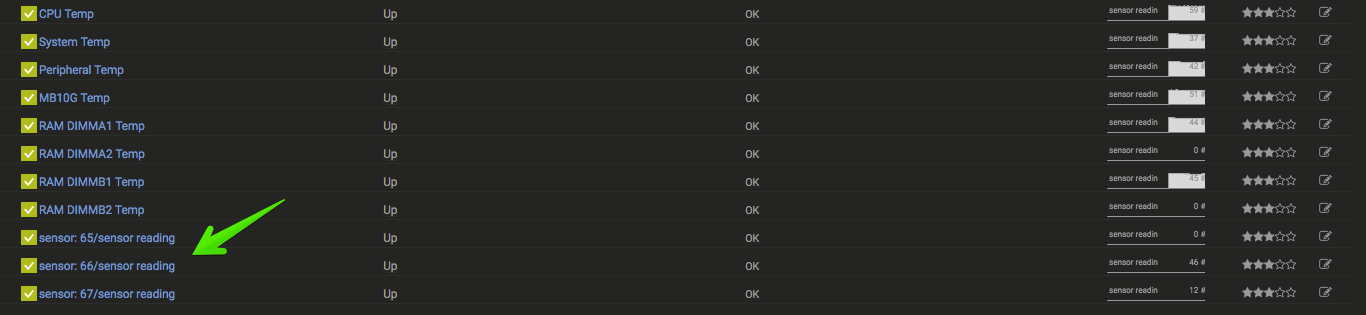
 This is how they will appear by default, with the name not descriptive at all, but at least we know what each one is:
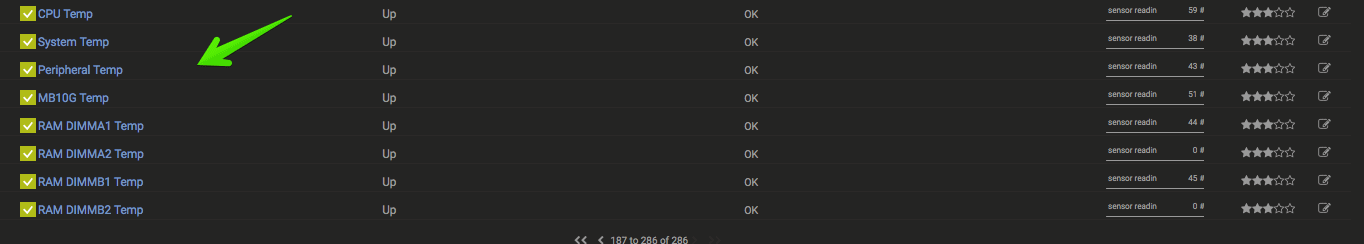
 So renaming each one with the corresponding heat we will have the first part of this article achieved, congratulations!
Monitoring Supermicro fan speed with PRTG
Once we have the temperature of our server, surely we want to monitor also the speed of the fans, since in case one of them fails, we will be able to see that their RPMs drop or stop, and we want to know this detail so that a greater evil doesn’t happen and some component of the server breaks down.
In Supermicro IPMI we can see it in the same Server Health – Sensor Readings:
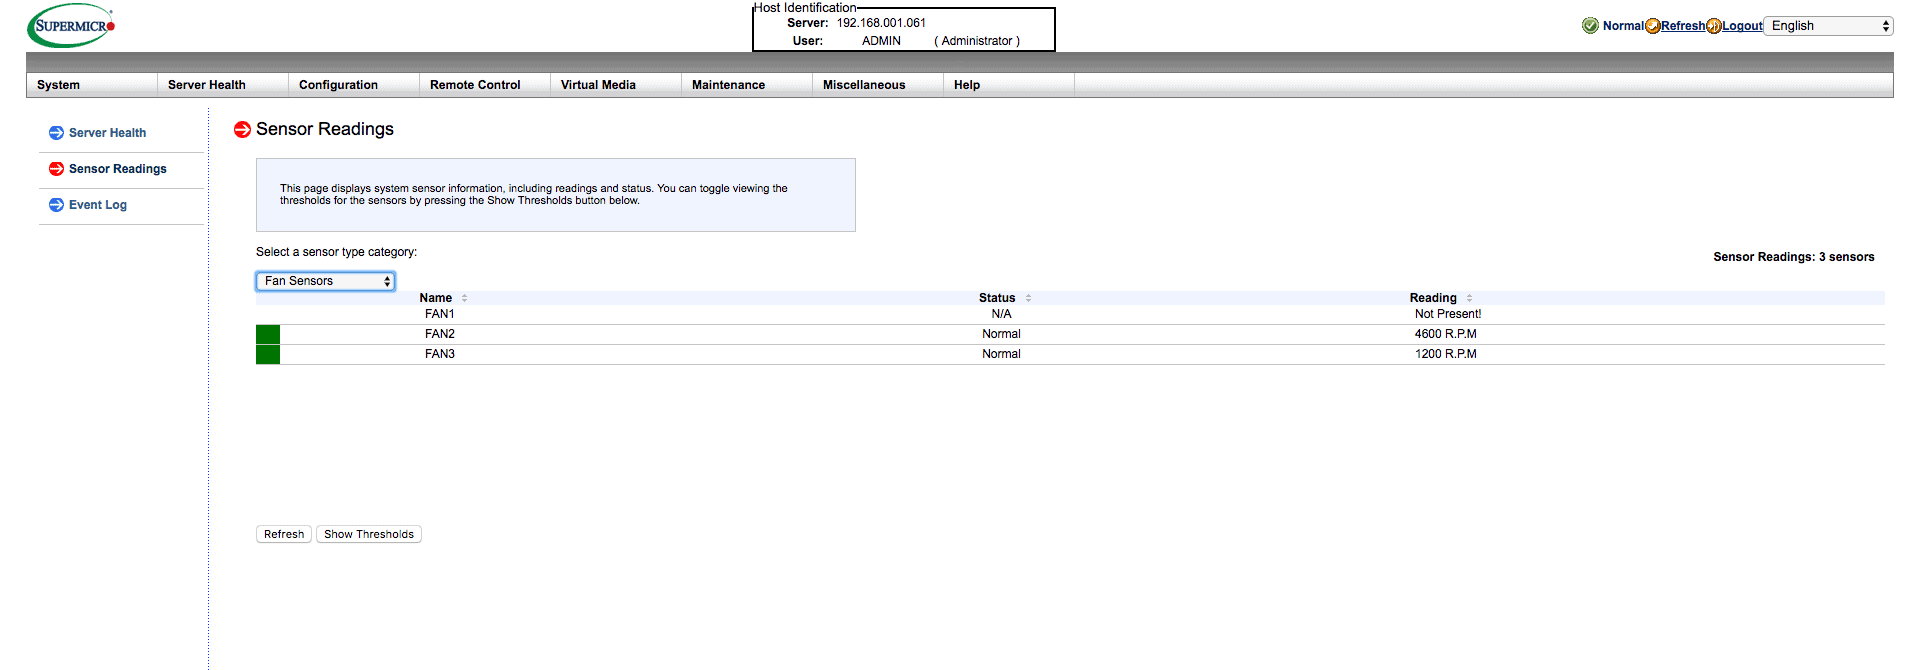 These values are the following at OID level, you know that we need them later:
FAN1 - sensor: 65/sensor id string
FAN2 - sensor: 66/sensor id string
FAN3 - sensor: 67/sensor id string
So, we go to our PRTG, and add one by one the ones mentioned above, we go to the Supermicro IPMI device, we will create a new SNMP- Custom type sensor and then we will mark SNMP Library:
We will now select the Supermicro library that we have created previously:
And we will mark the sensors that I have previously mentioned to you, we can select them by searching for them, or scrolling:
 As before, we will see the result of the sensors with the generic name, without much more information:
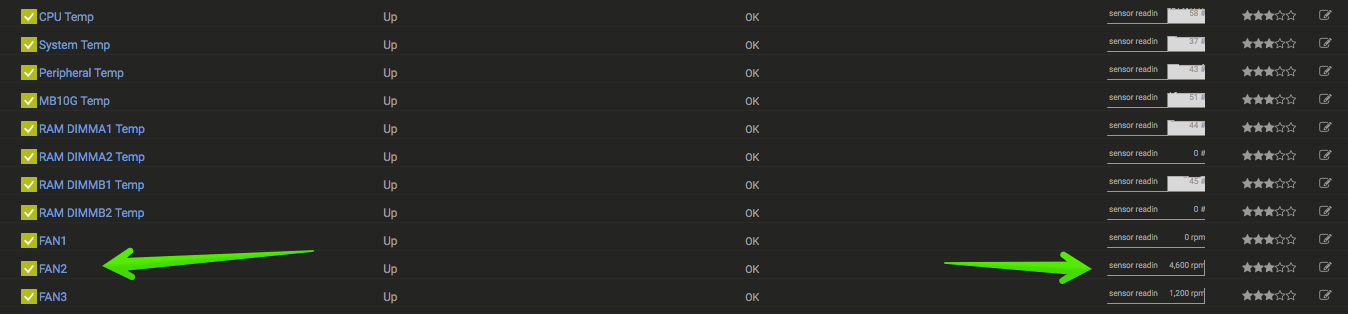
 If we pause to configure its name a little, the value in rpm and multiplied by 100:
 It should stay that way:
Monitoring Supermicro chassis voltage and safety with PRTG
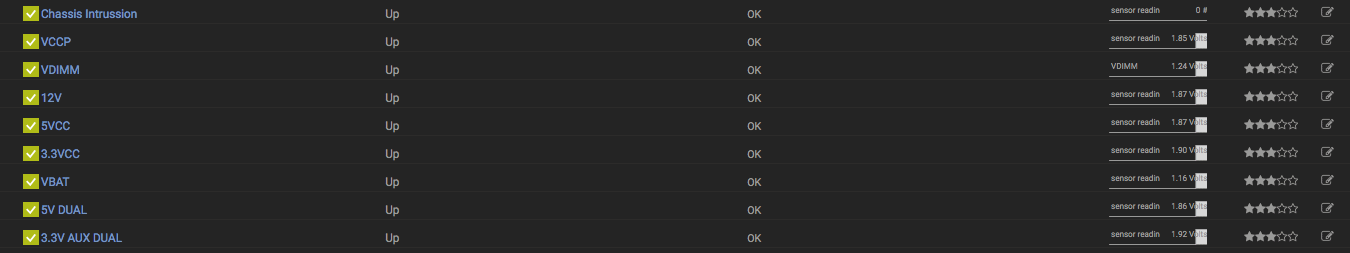
Finally, I want to show you how to monitor the remaining elements, such as the voltage that is receiving the equipment, as well as the chassis alarm, which is activated if you open the casing (very useful to know unexpected accesses). This is what Supermicro’s web IPMI looks like:
 The OID values of these elements are:
Chassis Intrussion sensor: 170/sensor reading
VCCP sensor: 32/sensor reading
VDIMM sensor: 36/sensor reading
12V sensor: 48/sensor reading
5VCC sensor: 49/sensor reading
3.3 VCC sensor: 50/sensor reading
VBAT sensor: 51/sensor reading
5V DUAL sensor: 55/sensor reading
3.3V AUX DUAL sensor: 56/sensor reading
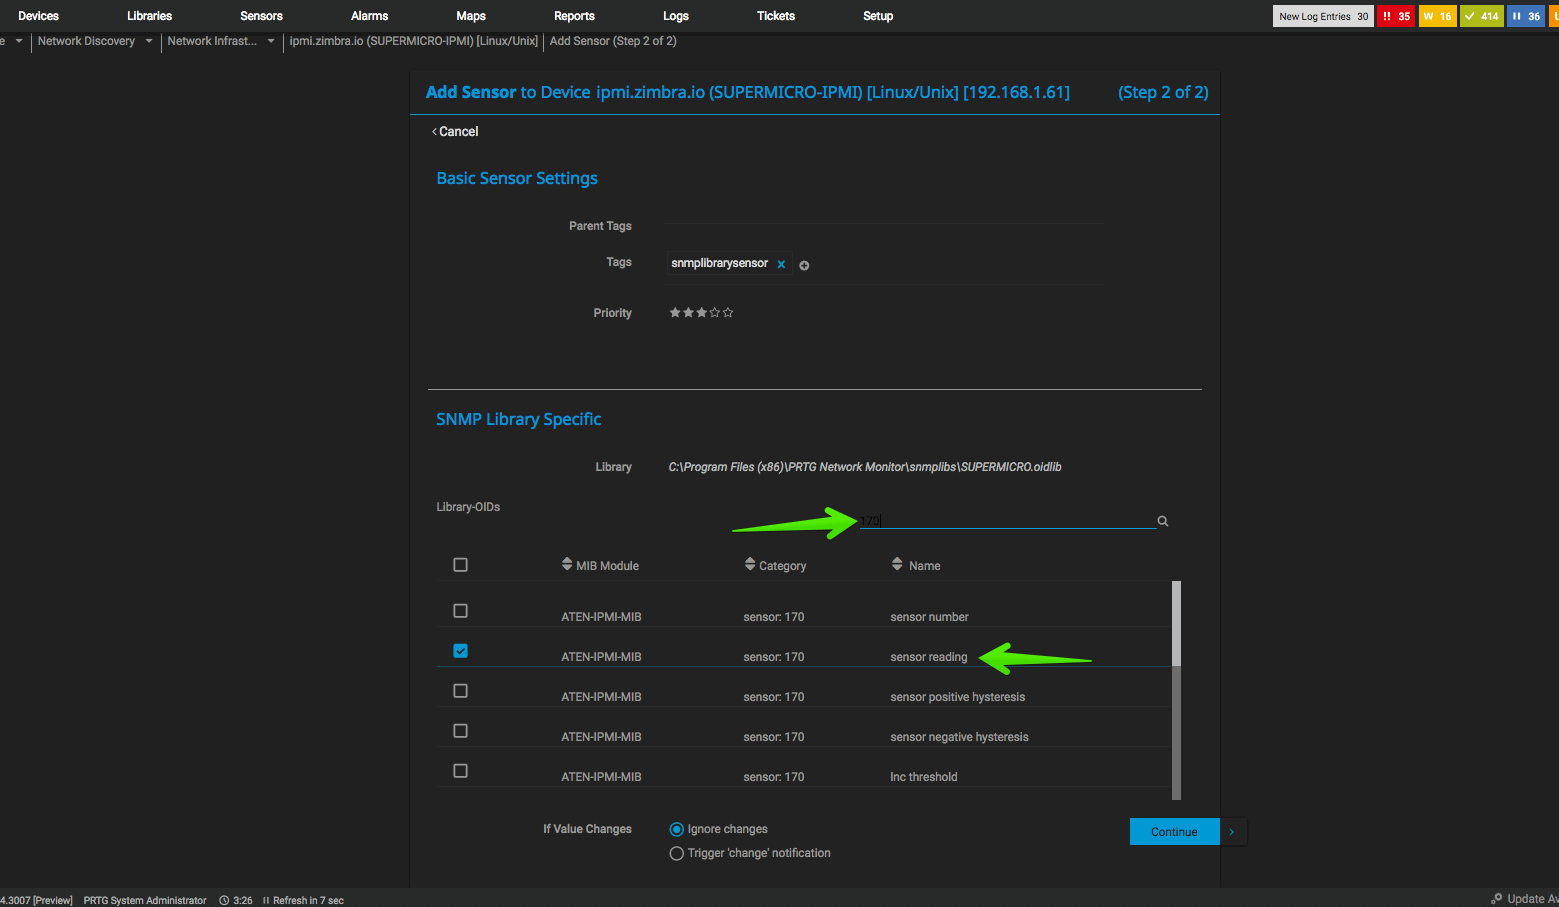
So, we go to our PRTG, and add one by one the ones mentioned above, we go to the Supermicro IPMI device, we will create a new SNMP- Custom type sensor and then we will mark SNMP Library:
We will now select the Supermicro library that we have created previously:
And we will mark the sensors that I have previously mentioned to you, we can select them by searching for them, or scrolling:
 We should have something like this:
 With all this, we could go and create the map, which with a little patience and skill, can look like this or even better!
Related links
I would like to recommend these other entries about PRTG:
- Zimbra: Monitorizando una Infraestructura de Zimbra Collaboration con PRTG
- PRTG: Monitorizando el estado, discos, espacio y mucho más de NAS QNAP
- PRTG: Cómo monitorizar tus Certificados SSL: expiración,seguridad y más
- Veeam: Monitorizando los trabajos de Veeam Backup – Replication con PRTG
- En busca del Dashboard perfecto: InfluxDB, Telegraf y Grafana – Parte III, Integración con PRTG
- Cómo Monitorizar VMware vSphere 6.x (ESXi y vCenter Windows) usando PRTG
Thanks for this. I will find it very useful in the coming weeks.
Hi Jorge,
Thanks a lot for your post, this helped me a lot! is it possible monitor the local disks of the supermicro servers ? I didn’t find how to…
mit Redfish 3.80 haben sich die SensorReadingIDs geändert:
SensorReading IDString
sensorReading.1 CPU Temp
sensorReading.2 System Temp
sensorReading.3 Peripheral Temp
sensorReading.4 MB_10G Temp
sensorReading.5 DIMMA1 Temp
sensorReading.6 DIMMA2 Temp
sensorReading.7 DIMMB1 Temp
sensorReading.8 DIMMB2 Temp
sensorReading.9 FAN1
sensorReading.10 FAN2
sensorReading.11 FAN3
sensorReading.12 FAN4
sensorReading.13 VCCP
sensorReading.14 VDIMM
sensorReading.15 12V
sensorReading.16 5VCC
sensorReading.17 3.3VCC
sensorReading.18 VBAT
sensorReading.19 5V Dual
sensorReading.20 3.3V AUX
sensorReading.21 Chassis Intru
Hi, my prtg reads everything as a string and I can’t set values for alarm nor graphs.
There is no option to set values as integers….
Do you have hints?
Thanks
Andrea