
 Greetings everyone, if you have followed this blog for quite some time, I am sure you have stopped by the blog entry about How to Monitor a vSphere Environment using Grafana, InfluxDB and telegraf. That blog post has tons of comments, and feedback from all of you around the Globe, which is great. Lately I’ve started receiving some comments about a common error that some of you have seen once deployed the solution, the error should say something like this:
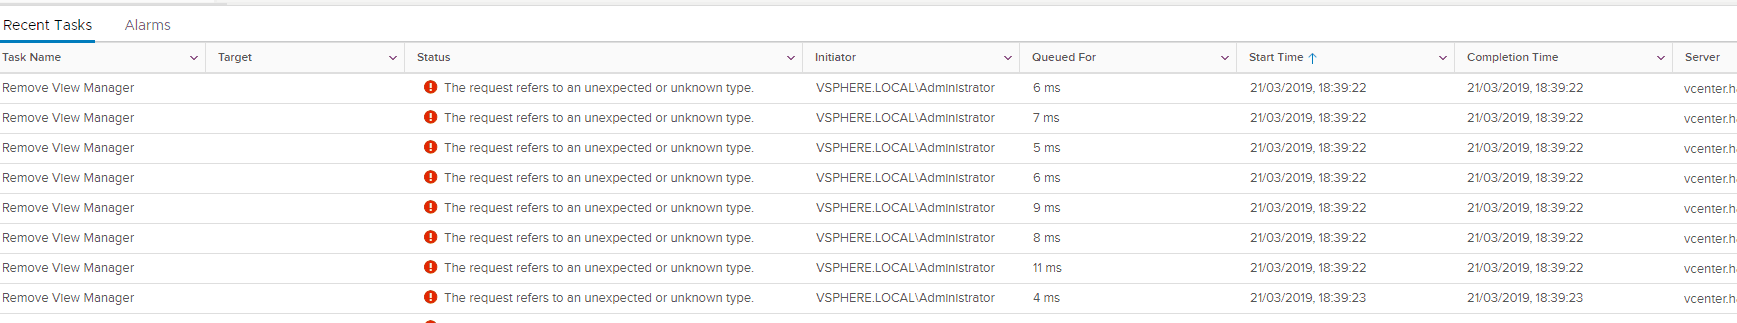
Task Name: Remote View Manager, Status: The request refers to an unexpected or unknown type
And it will look this on the vSphere Client, thanks to Stuart Kennedy for the screenshot:
 This is due to an old telegraf version you might be using, and the solution it is quite simple, upgrade to the latest telegraf version.
How to upgrade to the latest version of telegraf
The first thing you can do, for your own knowledge, it is to check which version you are running, it is as easy as run the next command:
telegraf --version
The telegraf version with the fix for vSphere to avoid the notification it comes starting telegraf v1.10.1, so if you do not have it just yet, keep reading.
You can upgrade with the service running, but just to be on the safe side, let’s stop the telegraf service now:
service telegraf stop
And now depending if you have installed from the repository, or from the packages you should follow the relevant step for you.
If you have installed telegraf from the repository, just run the usual commands of your distro to update and upgrade the packages:
Debian/Ubuntu
apt-get update && apt-get upgrade
RedHat/CentOS
yum update && yum upgrade
If running from the packages, download and install it depending your OS:
Debian/Ubuntu
wget https://dl.influxdata.com/telegraf/releases/telegraf_1.10.1-1_amd64.deb
sudo dpkg -i telegraf_1.10.1-1_amd64.deb
RedHat/CentOS
wget https://dl.influxdata.com/telegraf/releases/telegraf-1.10.1-1.x86_64.rpm
sudo yum localinstall telegraf-1.10.1-1.x86_64.rpm
During the install it is more than probable that the system will ask you if you want to replace your config with the new one from the package, let’s say N just to be on the safe side:
Configuration file '/etc/telegraf/telegraf.conf'
 ==> Modified (by you or by a script) since installation.
 ==> Package distributor has shipped an updated version.
   What would you like to do about it ?  Your options are:
    Y or I  : install the package maintainer's version
    N or O  : keep your currently-installed version
      D     : show the differences between the versions
      Z     : start a shell to examine the situation
 The default action is to keep your current version.
*** telegraf.conf (Y/I/N/O/D/Z) [default=N] ? N
And finally you can start the service again:
service telegraf start
As easy as this is, please try it and let me know if the error is gone after you have run all the needed steps.
Leave a Reply