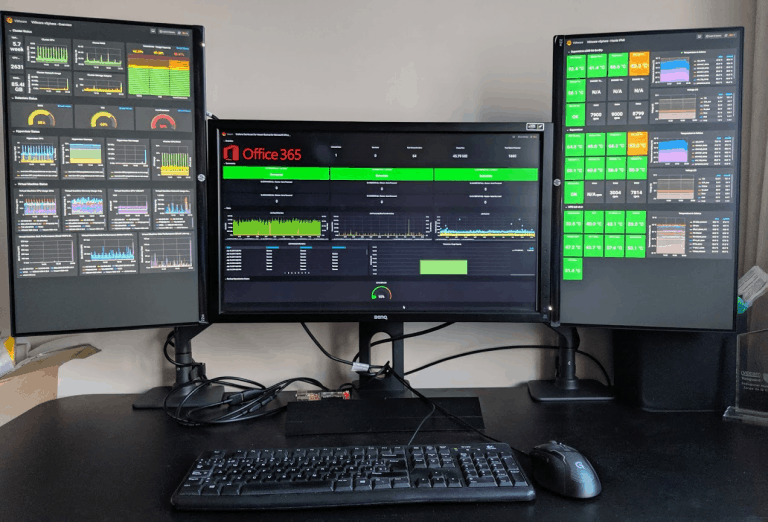
Greetings friends, I have been telling you throughout the series on Grafana many things, from how to monitor Linux, Windows, Veeam, VMware, and also the Server temperature using IPMI. Today I thought it convenient to show you the step by step to be able to visualize our Dashboards, if we have followed all the series will be already about 16

