
 Greetings friends, after so many years counting all the possibilities Grafana, InfluxDB and Telegraf, I have come to realize that we have never dealt with the subject of notifications, so that Grafana alerts us when a value exceeds a certain threshold.
Grafana has several methods of sending notifications, Email, Slack and many others that you can see here:
Today I come to tell you how to configure the notification to Microsoft Teams
Webhook Configuration in Microsoft Teams
To be able to receive notifications to a specific channel, we will have to create a Webhook in the channel we need, normally it would be a channel to receive alarms, instead of bombarding the General channel or similar.
In the channels where we need notifications, imagine that we want a certain team to receive notifications of their applications, we will go to the channel – Connectors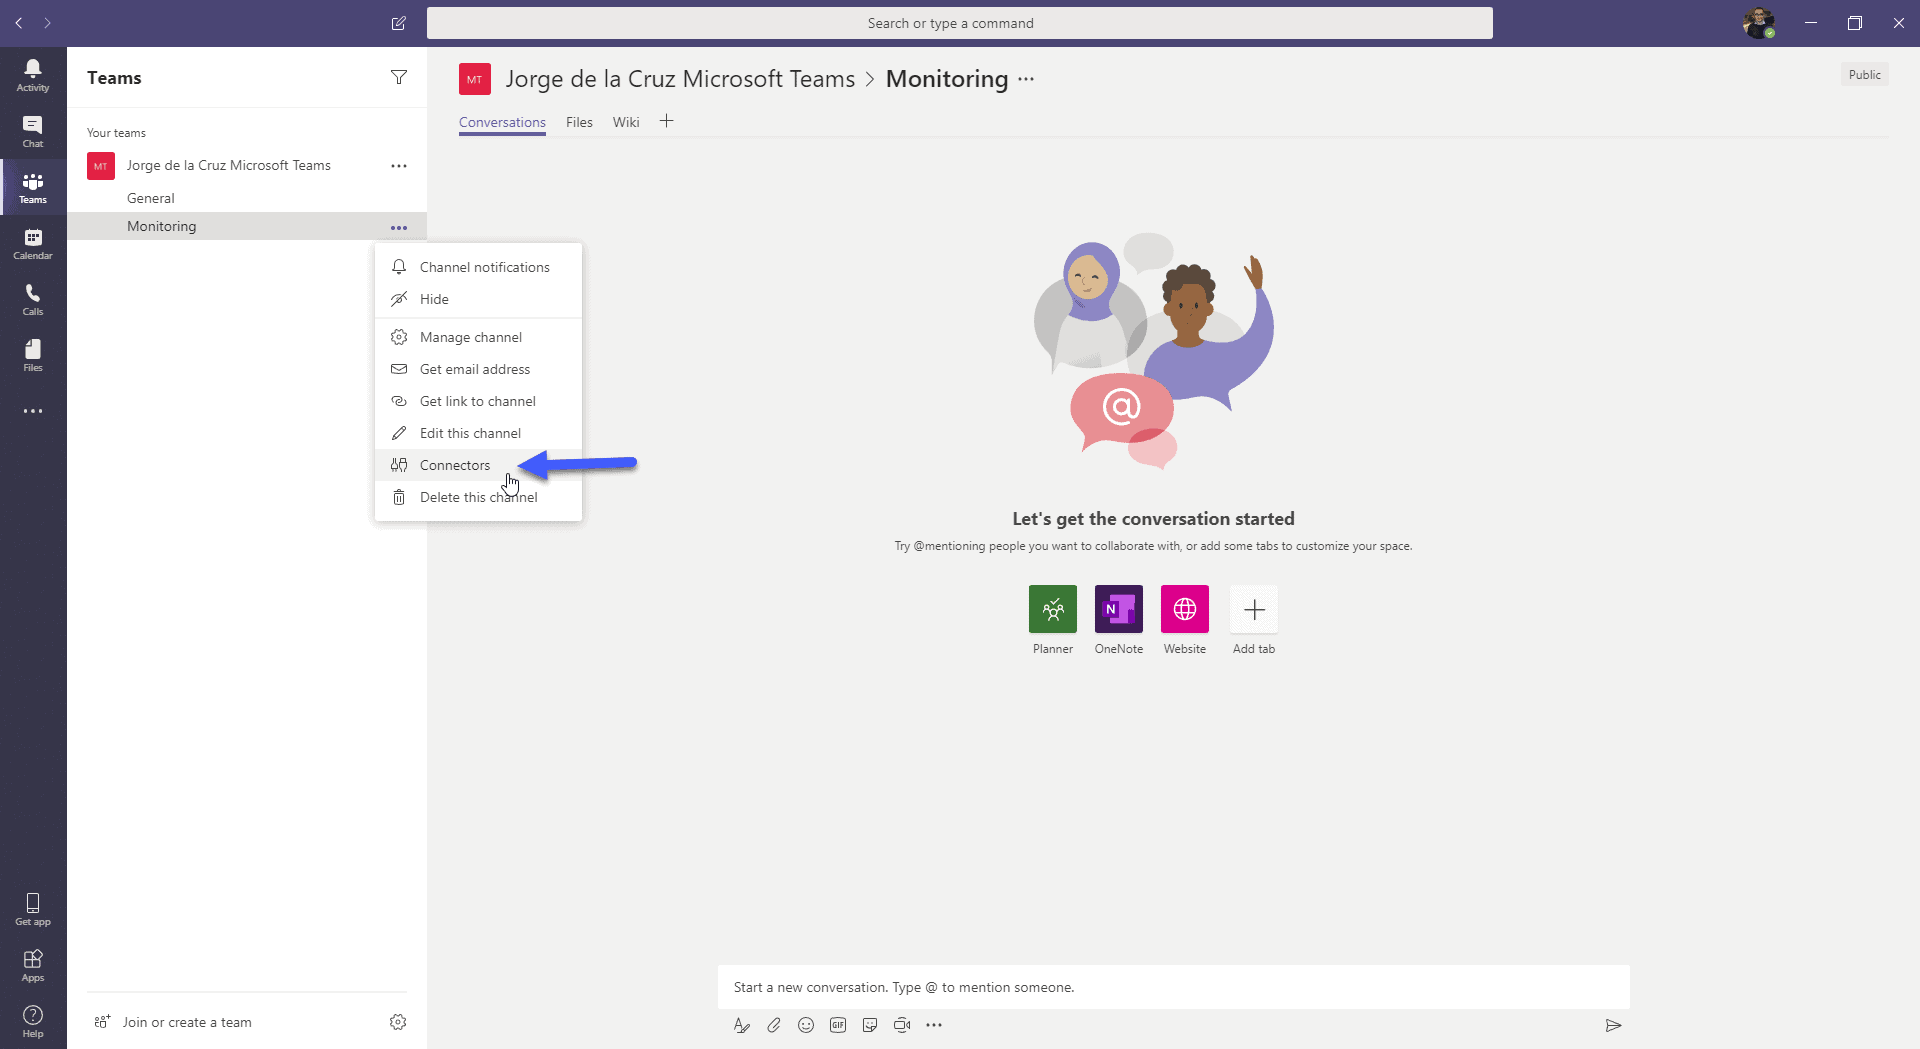 Select the connector called Incoming Webhook:
 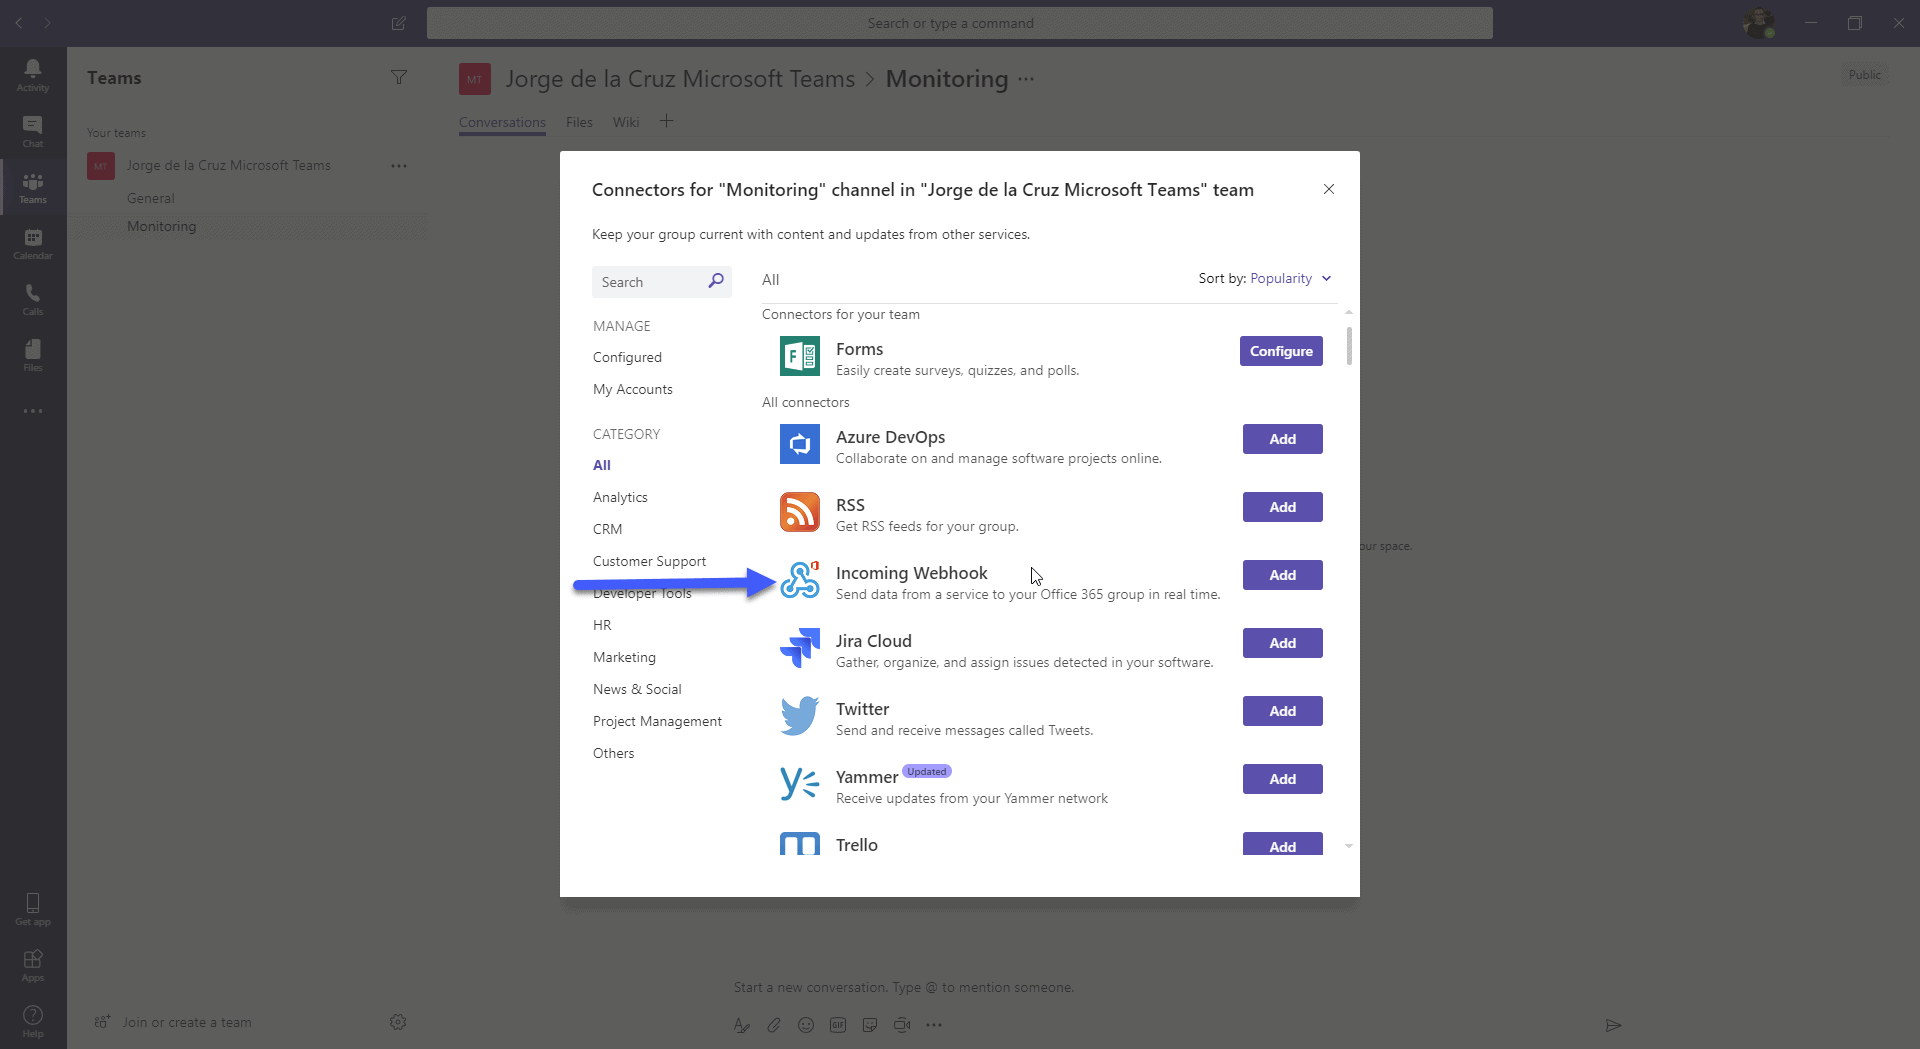 Select now the big button called Add:
 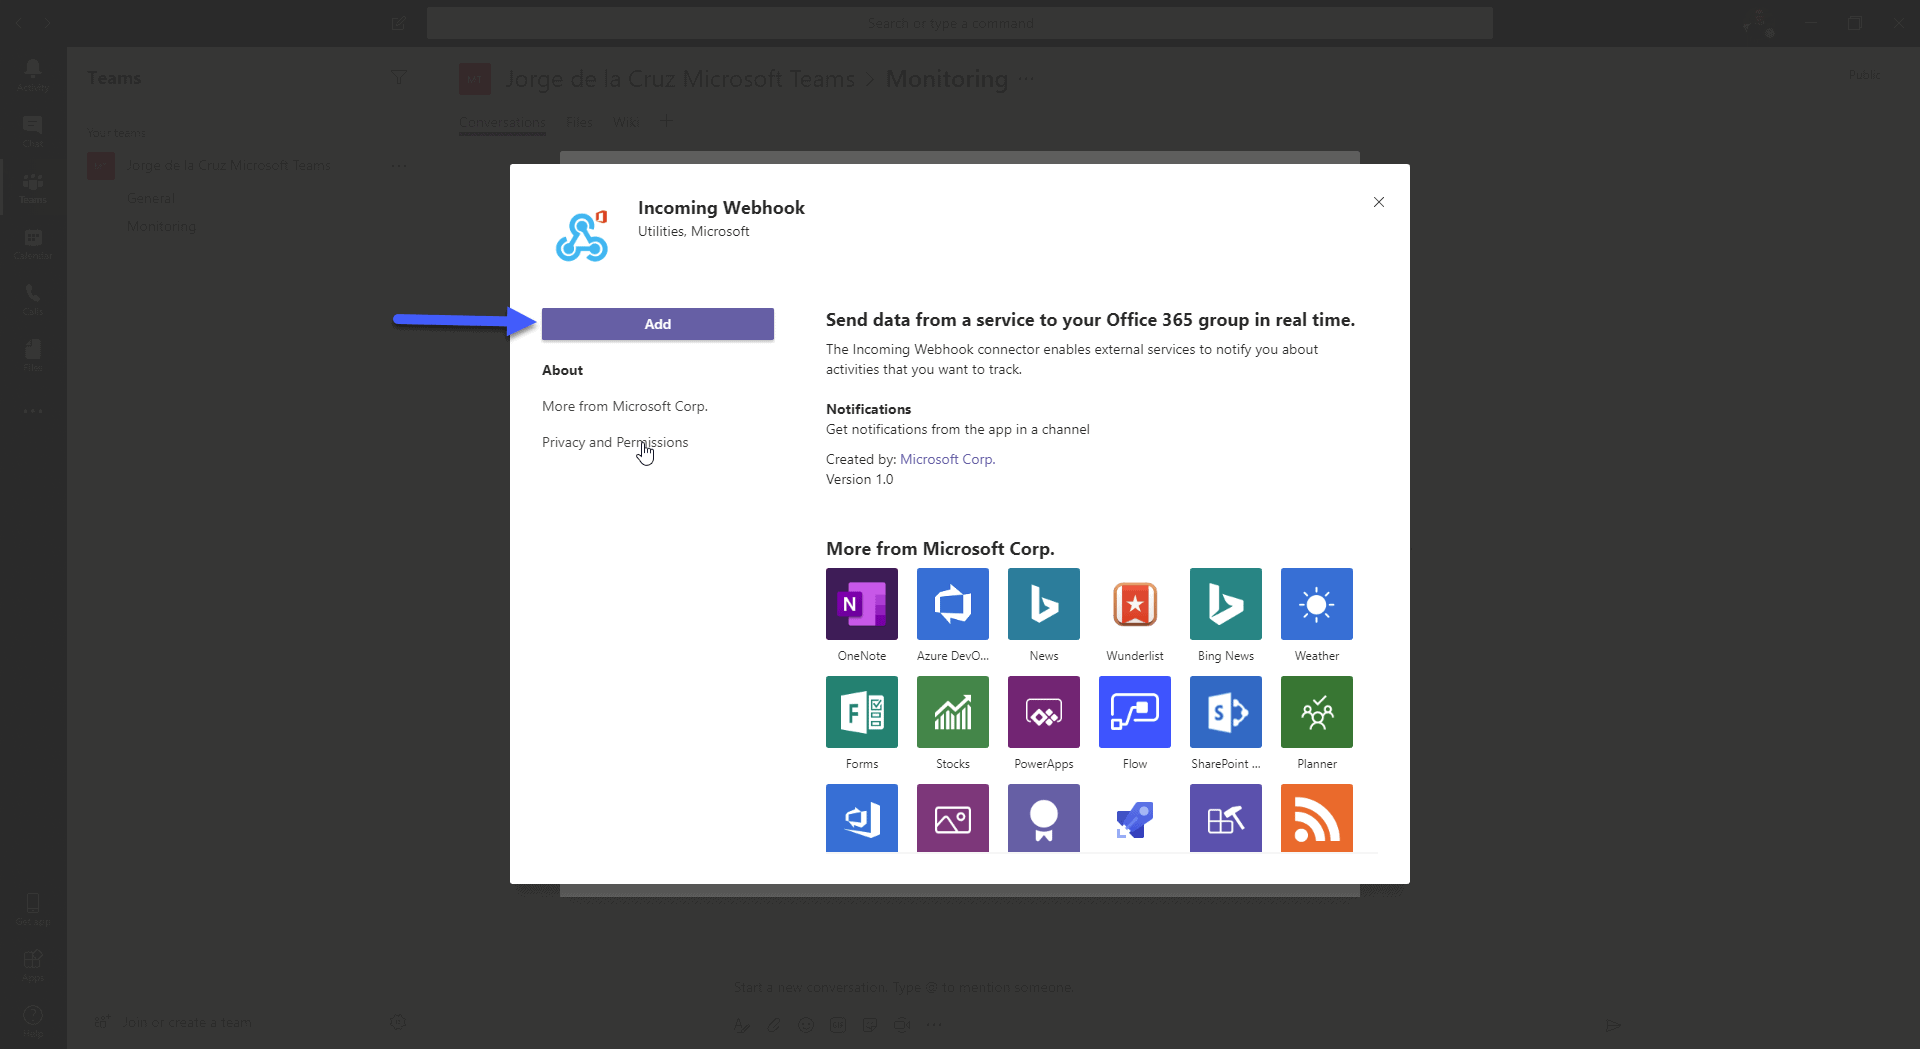 Select the name we want for our Webhook, as well as an icon that we like:
 When you click Create, will show a unique URL with the Incoming Webhook, this is the address we want to use in Grafana:
Configuration of our alarms in Grafana
Now that we have everything ready, we can go to our Grafana, and in the menu on the left we can click on Alerting – Add channel: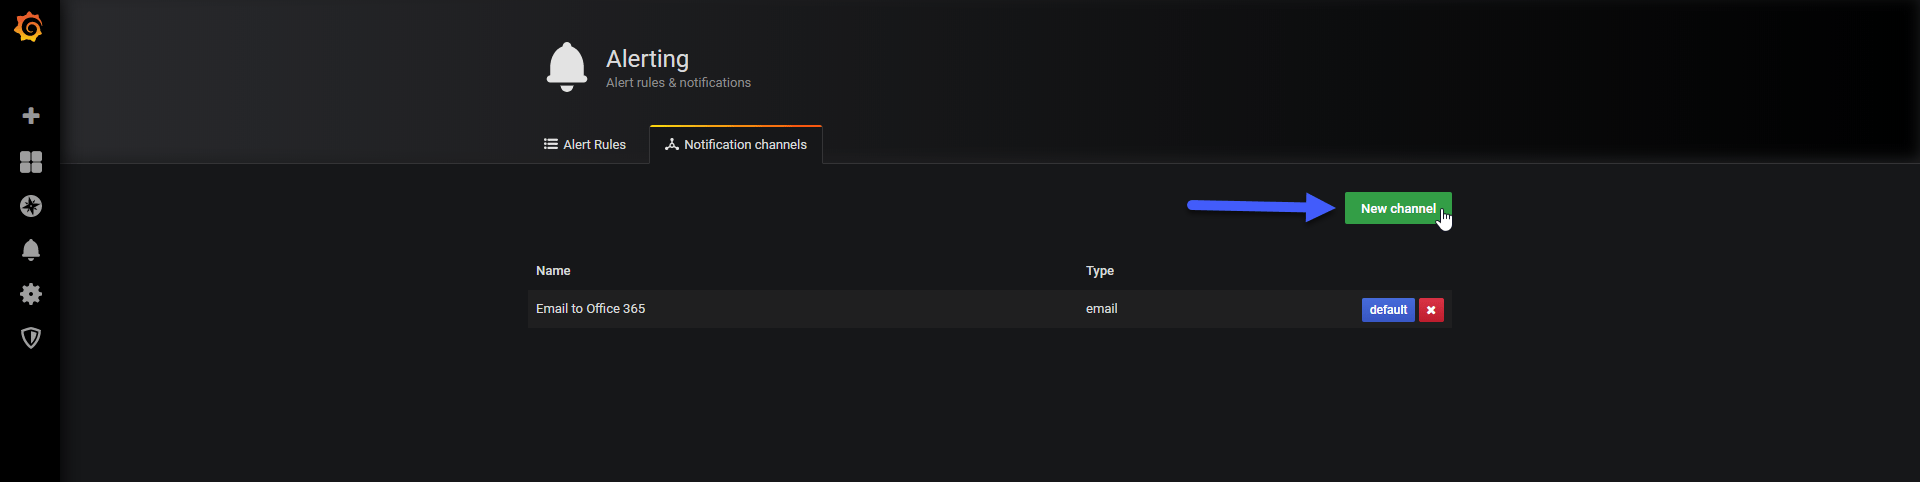 We will select a name that we like, besides selecting the values that we want in the options, we have to mark Default and for example images if we want to receive images in our Teams:
  When making a test, we will be able to see in our channel of Microsoft Teams an alert of test:
 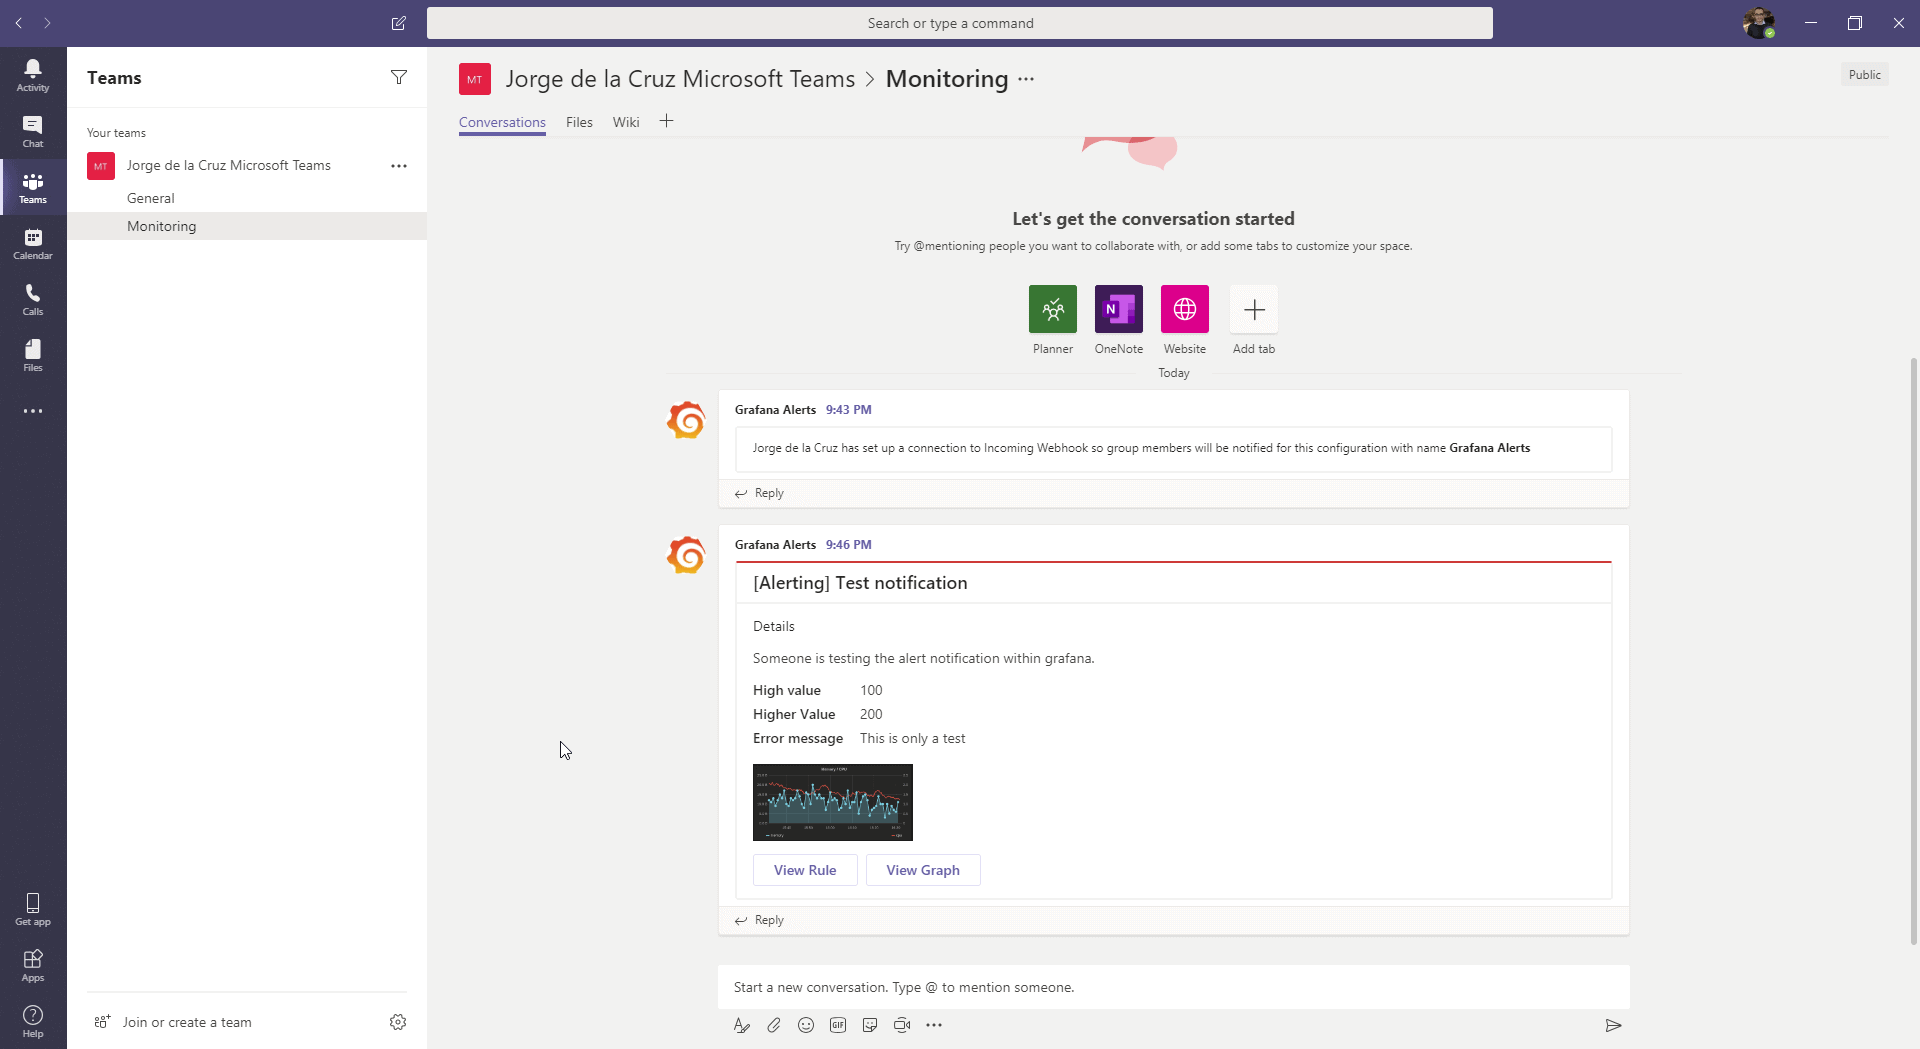 Inside our Dashboards of Grafana, we will select the graph of which we need to extract the value to monitor with thresholds:
 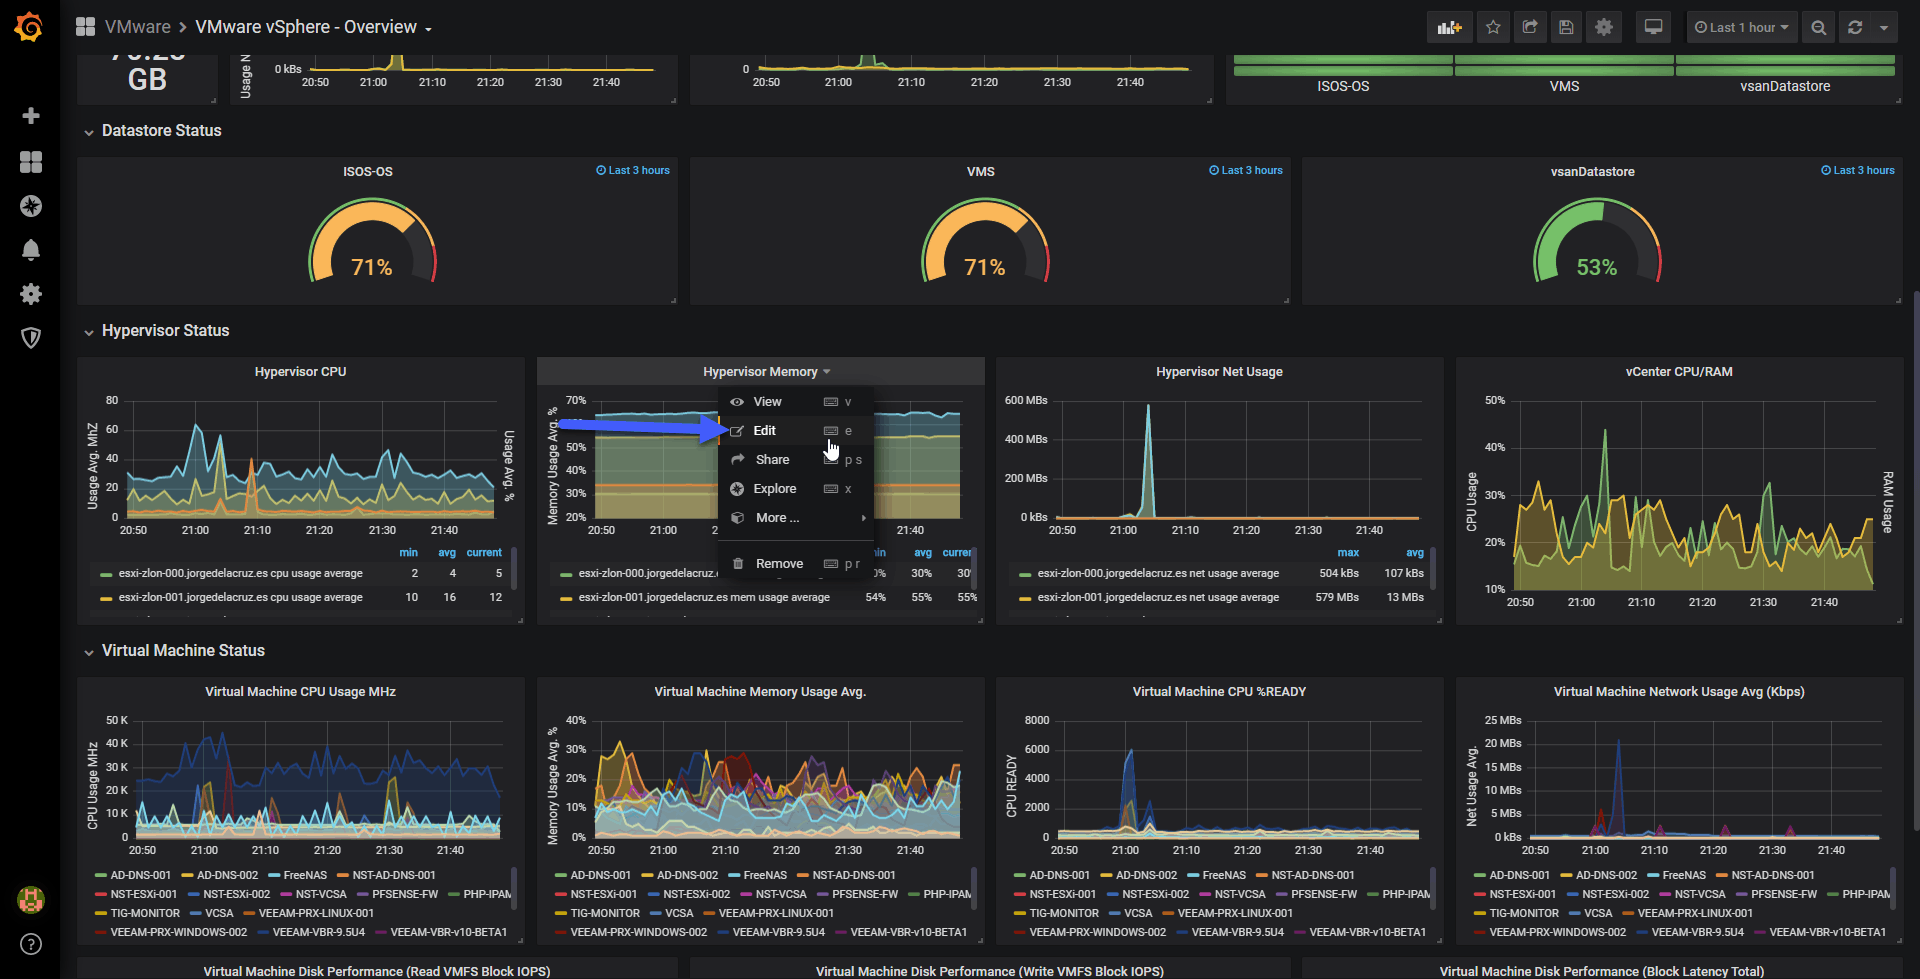 We will go to the Alerting part, is an icon on the left very easy to discern, we will introduce now the thresholds of the query we need, for how many minutes it has to happen to be considered alarm, and we will see below the notifications to Email and Teams:
 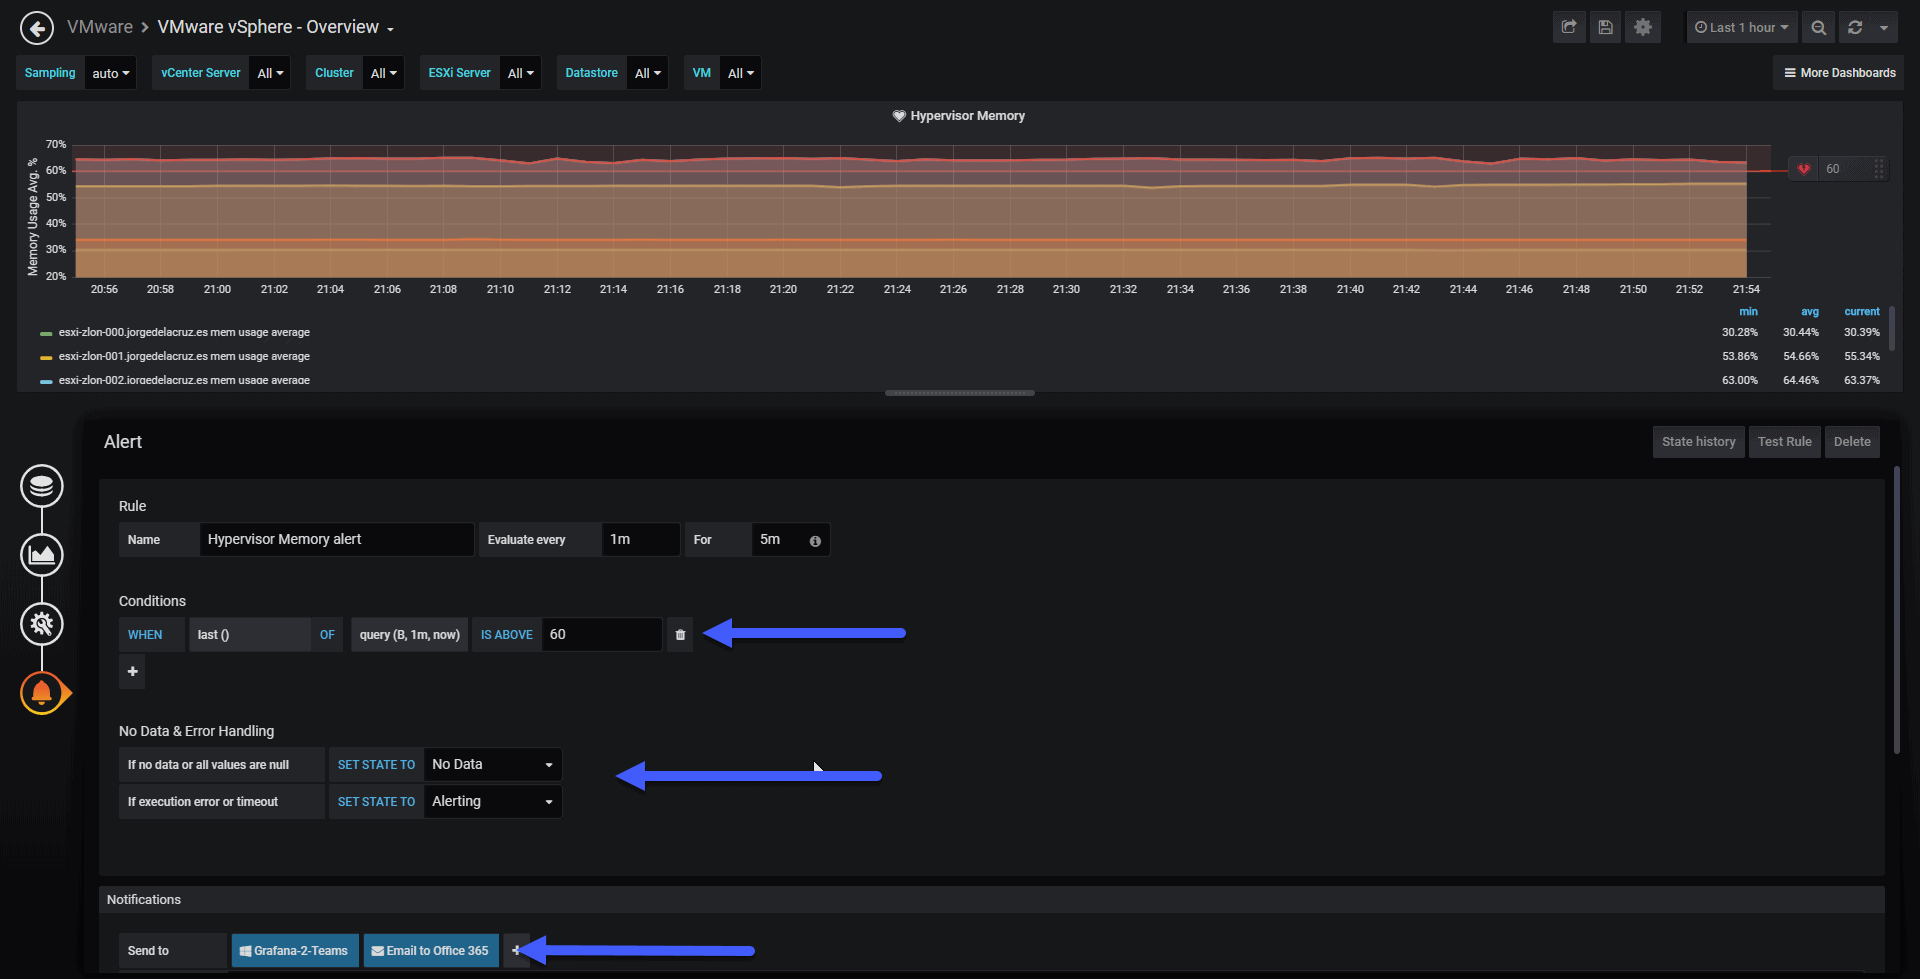 When we exceed the threshold we have introduced, during the time stipulated, we will receive the alarm in the Microsoft Teams channel:
  An important issue, not all the ways of showing metrics allow us notifications, for example the singlestat does not allow it, but the graphs do.
Nothing more friends, I hope you like it, and you will find it useful.
hi, I’m trying to set up this alert here, but I get the error:
t=2019-10-28T15:09:20+0000 lvl=eror msg=”Failed to send teams notification” logger=alerting.notifier.teams error=”Post https://outlook.office.com/webhook/d6929fff-e319-4a0c-bedc-57da6f663121@ce849bab-cc1c-465b-b62e-18f07c9ac198/IncomingWebhook/e97727a32d764620b0e5ef0d23443/ad71f4a5-d3bb-4049-87e7-4f3fa3860725: dial tcp: lookup outlook.office.com on 127.0.0.11:53: no such host”
Do you know what may cause it ?
Hello Danilo,
Does your Grafana server has access to the Internet, not only that, but also proper DNS resolution? It seems that the DNS server 127.0.0.11 on the port 53 can not be reached, which it is a really weird DNS configuration anyways.
Take a look at your DNS resolution on your Grafana server.
Best regards
Hi, Thank you! It works fine, but when on mobile device (Android) alert doesn’t give any details about the graph is the alert (so that I can consider is it critical or not). How this could be solved?
Hello Agnese,
Can you please share a screenshot with me? Thank you!
Here the same issue with print screen
https://techcommunity.microsoft.com/t5/Microsoft-Teams/Messages-in-the-mobile-app-channel-don-t-display-any-data-apart/m-p/471307
Hi,
Do you have any idea how to solve it so that mobile shows at least name of graph?
Hello,
It seems it is a bug on Grafana itself, I will need to check on github.
Best regards
I have the same VMWare dashboard as you, but i get this error message when adding the alert.
“Template variables are not supported in alert queries”
Don’t you use template variables?
Best regards
Hello,
For alerts, you need to use a query without a variable, it is a pain to be honest, but I am preparing another post in how to send alerts for this in a better fashion.
jorge
that would be perfect, i would be happy if your post would appear in the matter soon.
Your post helped me a lot! Thanks!
Hello,
/* sorry for my bad english */
Thanks for the post. I’ve already done this configuration but i don’t get how can we see graphs in the alert (on Teams).
When i’m testing it, it’s working fine.
But when i receive a real alert, any graph is present in the alert’s message.
Do you have any idea about how can i solve this please ?
Thanks,
Jordan
I am getting alert on team but with {} what that means
I’m running grafana on a VM and when I tried to test it, it failed with x509: certificate signed by unknown authority error message. Do you have an idea to solve this?
Hello,
I always run Grafana with valid SSL, try to take a look at the next steps – https://www.jorgedelacruz.es/2019/06/04/grafana-securizando-nuestros-dashboards-en-grafana-usando-https-con-lets-encrypt-de-manera-gratuita-y-renovacion-automatizada/
is it possible to send an alert message to ms teams without any certificates?
For example, in terminal window I can send a message to ms teams via incoming webhook using curl –insecure option.
Thank you very much. So detailed and useful. I got it in the first try.
Very useful! Thanks! Which is in your opinion the best way to send alerts with queries with template and variables?
Still looking for the best option, will post it once finish all the tests 🙂
Hi it’s really nice one to have for the beginner. But, the alert is still being not triggered over teams. What could be the issue? Please suggest some tips.
Hello, let me try tomorrow and will come back to you
Thanks for the response sir!! Just wondering in case you cracked any solution for my question. Please advise.
I am also not able to send alerts from Grfana with Teams