• Skip to main content
  • Skip to secondary menu
  • Skip to primary sidebar
The Blog of Jorge de la Cruz

The Blog of Jorge de la Cruz

Everything about VMware, Veeam, InfluxData, Grafana, Zimbra, etc.

Archives for 23rd January 2020

VMware: How to achieve a perfect metric collection interval with Telegraf, InfluxDB and Grafana

23rd January 2020 - Written in: opensource, vmware

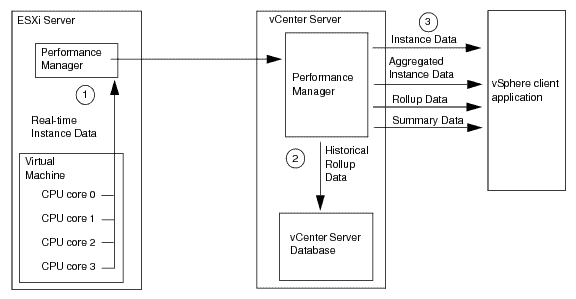
Greetings friends, I have told you in the past how to monitor your VMware environment using InfluxDB, Telegraf, and Grafana, and according to Grafana's dashboard, you are using it with about 4300 people in your Datacenters. All this is great, and I thank you very much for all the support and that so many people have the solution deployed. Now, I

Continue Reading

Primary Sidebar

  • E-mail
  • GitHub
  • LinkedIn
  • RSS
  • Twitter
  • YouTube

Posts Calendar

January 2020
M T W T F S S
 12345
6789101112
13141516171819
20212223242526
2728293031  
« Dec   Feb »

Disclaimer

All opinions expressed on this site are my own and do not represent the opinions of any company I have worked with, am working with, or will be working with.

Copyright © 2025 ยท The Blog of Jorge de la Cruz