
 Greetings friends, since 2016 I have been showing you how to get the Perfect Dashboard using Grafana, InfluxDB, and Telegraf, we have come a long way together, and we have seen how to monitor a myriad of critical components, such as SSL, web page responses, VMware vSphere, Veeam, and much more.
The other day I was telling you how to extract the metrics from Cloudflare, that there we can have a professional website, blog, etc. But it is true that many times we do not have something so sophisticated, and we have a blog in WordPress with Jetpack installed.
So today, we’ll see how to extract information (no limits or restrictions) from the WordPress.com Jetpack API.
Once you have finished this tutorial, you will have something similar to this, it is better to give it several days or weeks to see the full potential: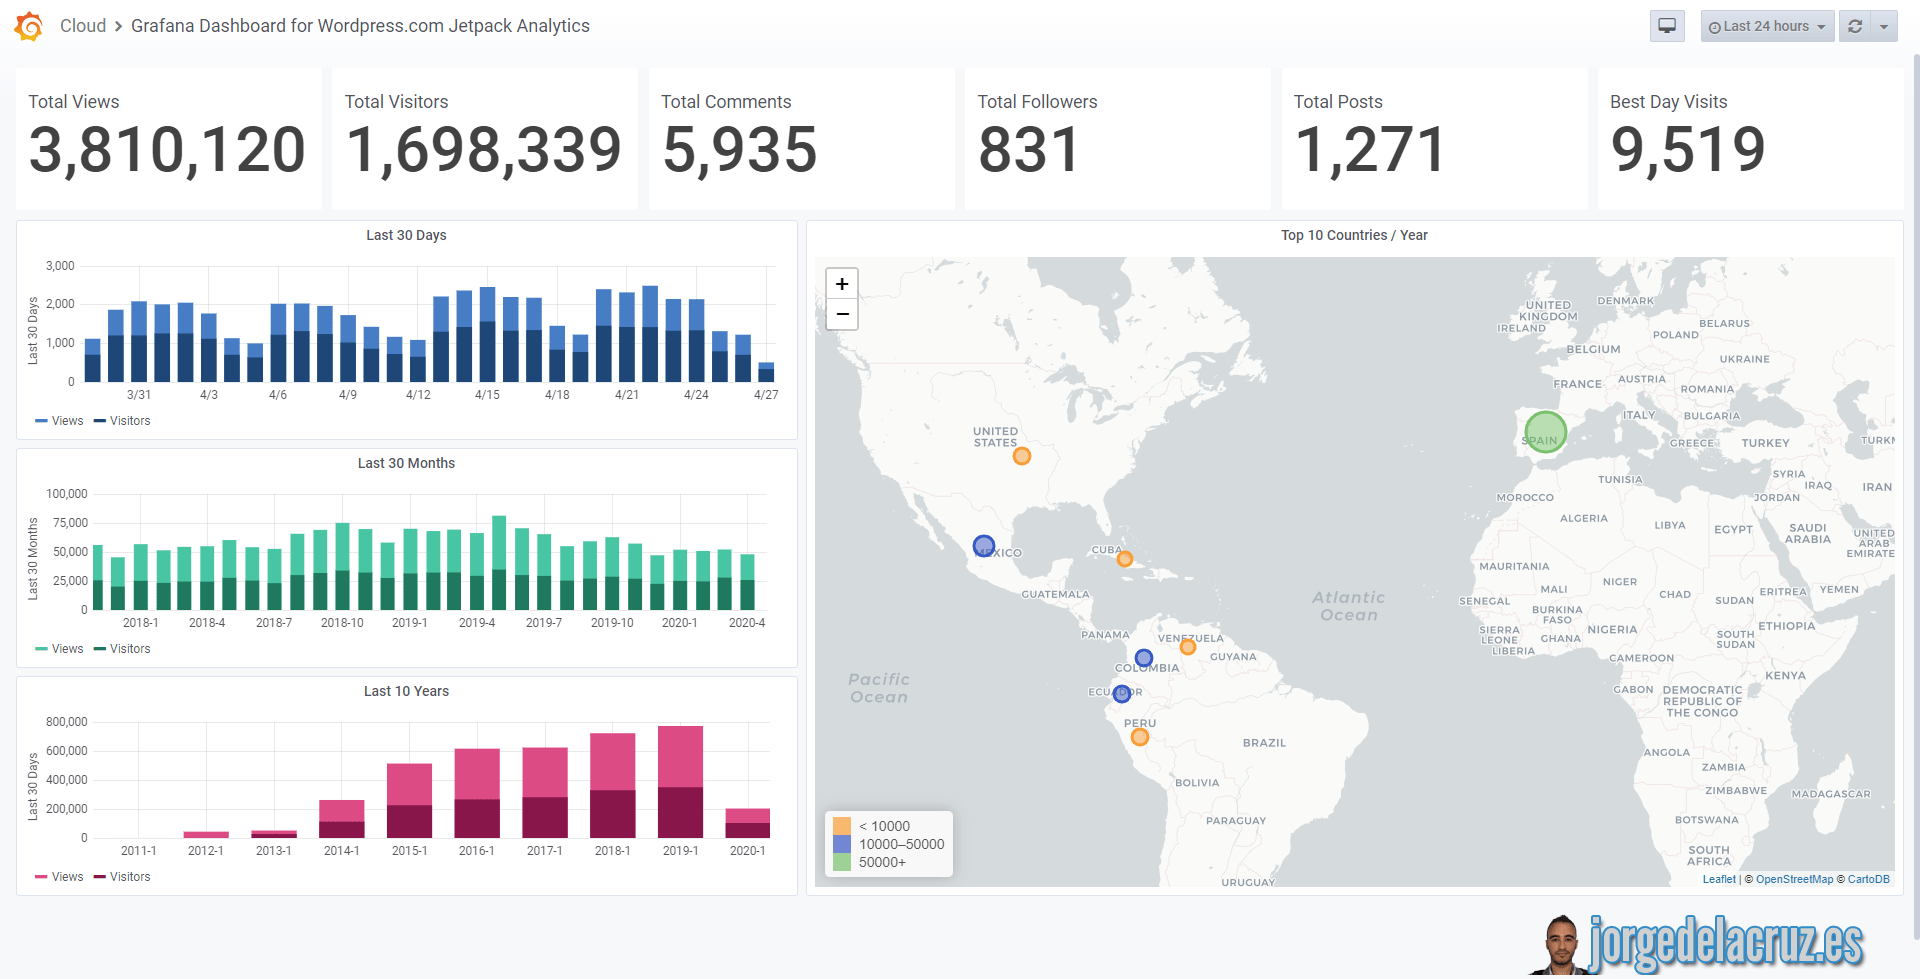
Telegraf, InfluxDB and Grafana topology monitoring WordPress Jetpack
Although I have already shown you on some occasions the diagram of how the monitoring would be using Telegraf, Grafana, and InfluxDB, I leave you again the diagram, this time monitoring the WordPress Jetpack API: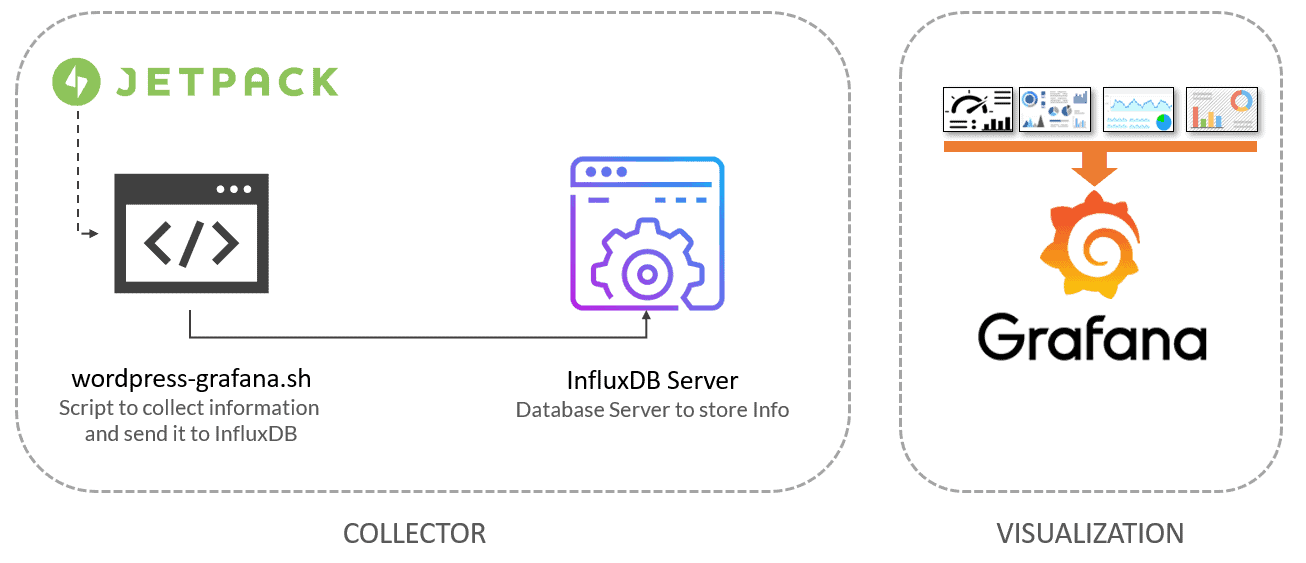
WordPress.com and WordPress RESTful API
The first thing is to understand that there are two different APIs, the WordPress API of our website, which can be accessed if you have not restricted, through http://tusitio.com/wp-json and the WordPress.com API that allows OAuth2, and that has among others, all our Jetpack.
In this tutorial, we will use the WordPress.com API, and of course, I assume that you already have Jetpack installed and configured.
Requirements we will need to make everything work
To get everything working we will need several components, I leave the list here with the link to the subsection:
- Application on WordPress.com
- OAuth2 Server Code
- OAuth2 Access – Bearer
- Application on WordPress.com
To get access to our OAuth2 in an easy way, we’re going to need to create an application in wordpress.com, as simple as going to the following URL and logging in with our wordpress.com credentials (where we have Jetpack configured)
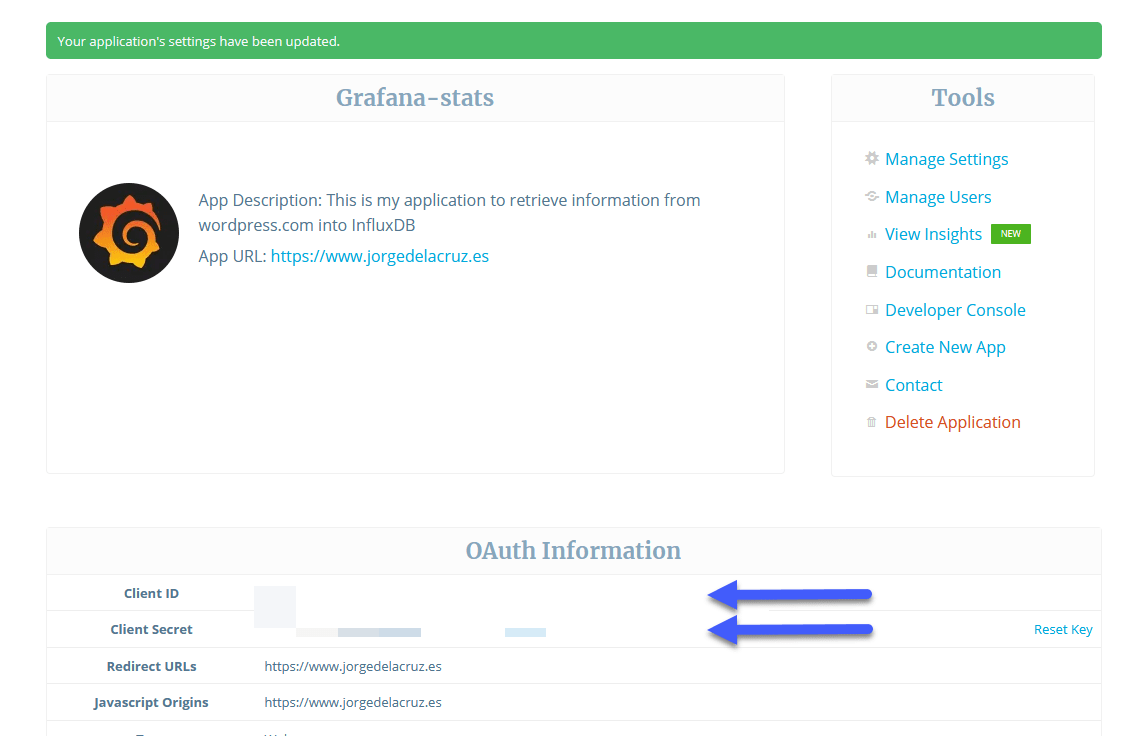
Let’s create an Application: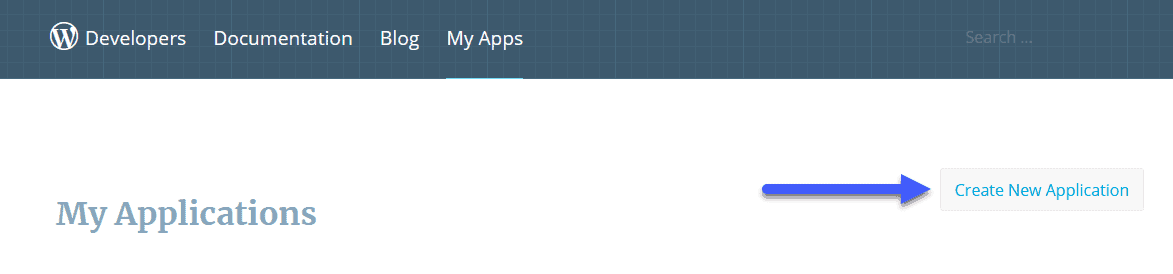 We will introduce a name, an image, a description and in the rest of fields we will put the URL of our site:
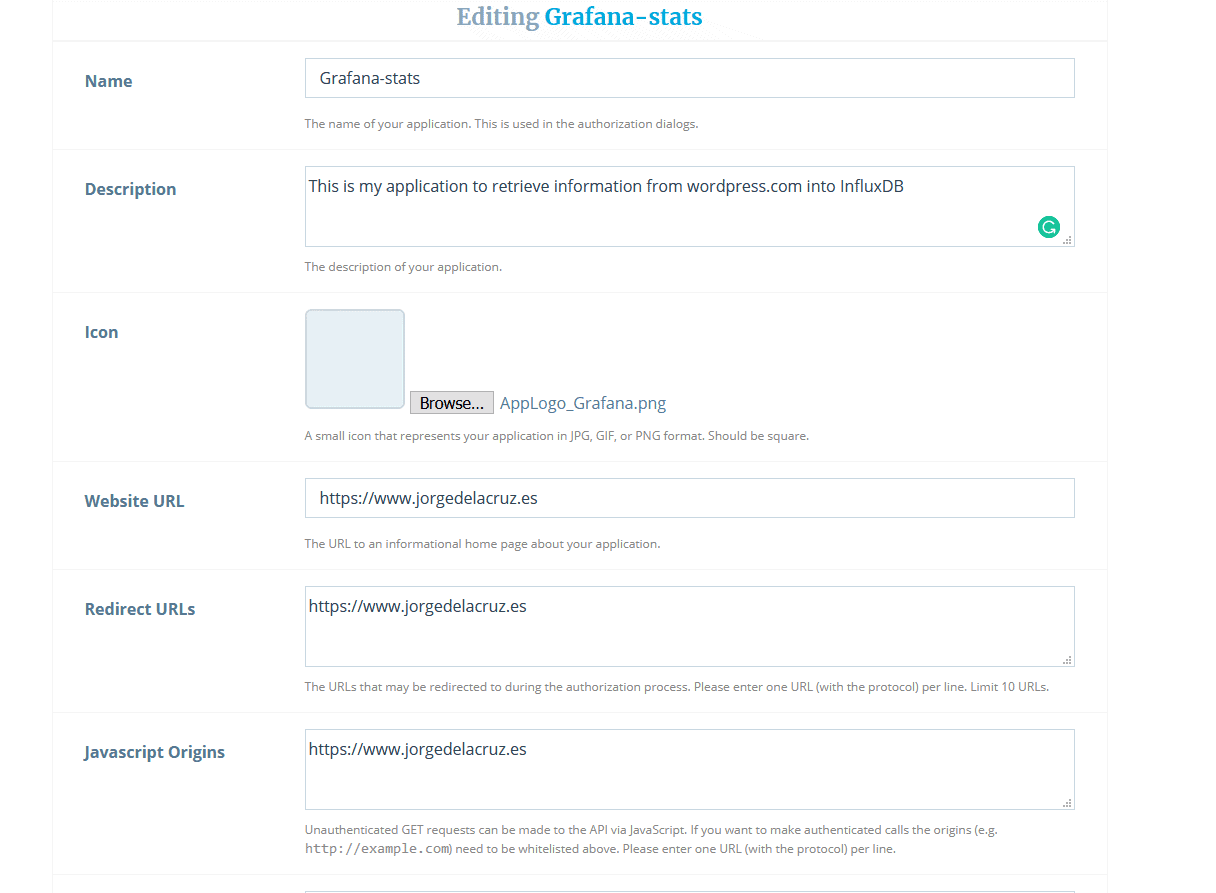 You will then see something similar to the next output, bear and pay attention to the Client ID and, to the Client Secret, save this somewhere safe, as we will need soon:
OAuth2 Server Code
To get the Server Code, which in our case we will use a permanent one, instead of using a token, which has a shorter life span, but I leave it to your liking, we will have to leave the following URL, please change the Client ID with yours from before, and the Blog URL with yours:
- https://public-api.wordpress.com/oauth2/authorize?client_id=YOURCLIENTID&redirect_uri=YOURBLOGURL&response_type=code
When we go to this site, we are asked to approve that this new wordpress.com application wants to access our site: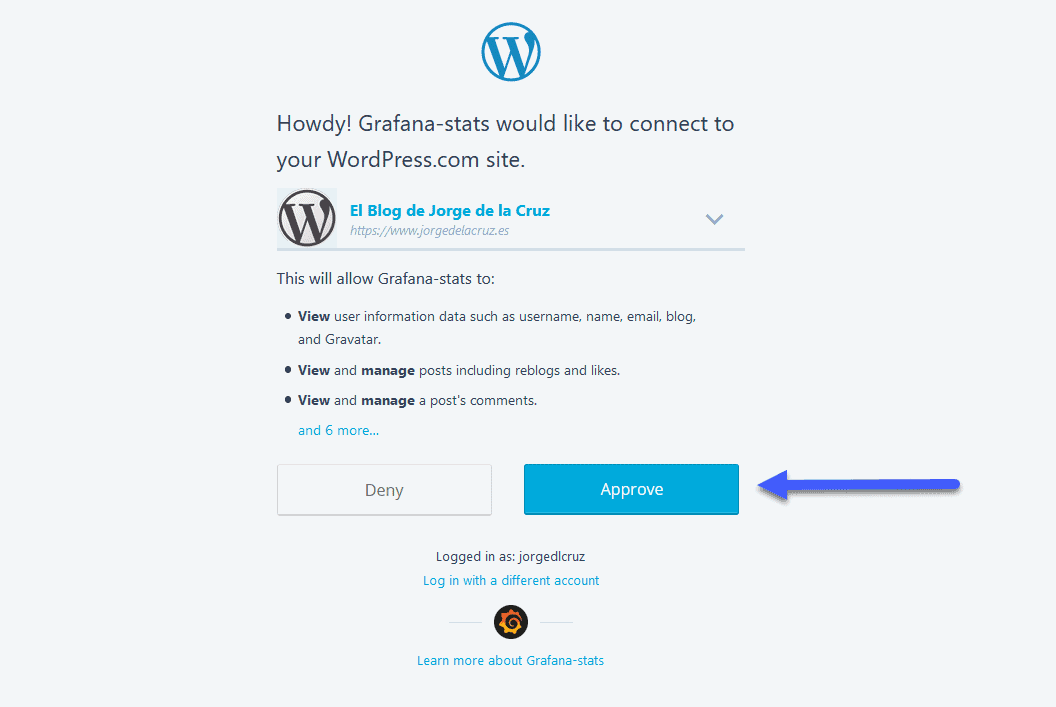 It will then ask us to log in with our admin credentials, or a user with admin privileges:
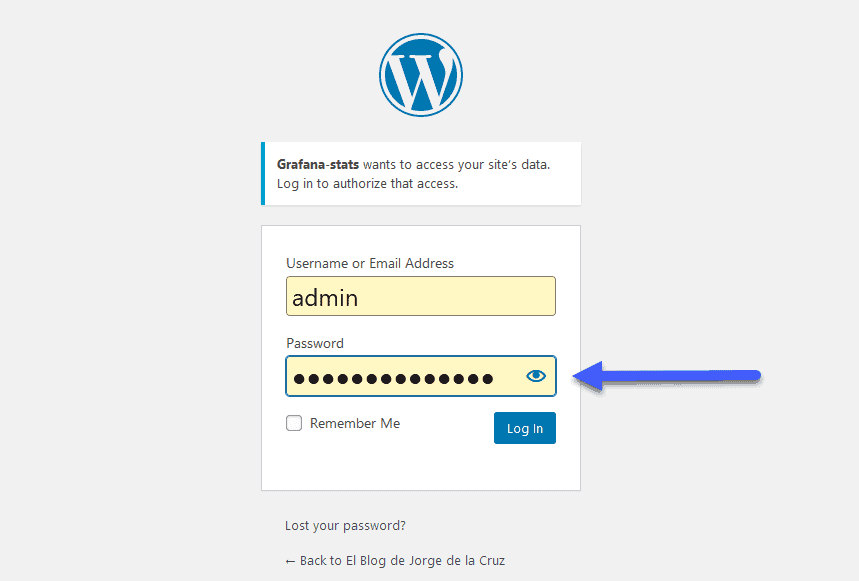
This action will take us to our Blog URL, BUT, this time you will see something on the URL Address bar, that code we will need on the next step:
- https://YOURBLOGURL/?code=YOURCODE&state
OAuth2 Access – Bearer
We already have everything necessary to launch the next command, which must be done from a Linux console, or a program that allows CURL, the call is as follows:
curl --request POST \
  --url 'https://public-api.wordpress.com/oauth2/token' \
  --header 'content-type: application/x-www-form-urlencoded' \
  --data 'grant_type=authorization_code' \
  --data 'client_id=TUCLIENTID' \
  --data 'client_secret=TUCLIENTSECRET' \
  --data 'code=TUCLIENTCODE' \
  --data 'redirect_uri=https://TUURLDETUBLOG'
This command will bring back the following:
{
  "access_token": "TUACCESSTOKENBEARER",
  "token_type": "bearer",
  "blog_id": "TUBLOGID",
  "blog_url": "https:\/\/TUURLDETUBLOGs",
  "scope": ""
}
Fantastic, to recap, with this we will have our Bearer, ready to be added in the next step.
Download, and configure the script wordpress_grafana.sh
Let’s download the script that will make all this work, we will download the latest version from the Github repository:
This shell script can be downloaded and run from the telegraf server, or influxDB, or any other Linux. We will have to edit the configuration parameters:
# Endpoint URL for InfluxDB
InfluxDBURL="YOURINFLUXSERVERIP" #Your InfluxDB Server, http://FQDN or https://FQDN if using SSL
InfluxDBPort="8086" #Default Port
InfluxDB="telegraf" #Default Database
InfluxDBUser="USER" #User for Database
InfluxDBPassword="PASSWORD" #Password for Database

# Endpoint URL for login action
WPSiteURL="YOURSITE"
WPAuthBearer="YOURBEARERCODE"
We need two pieces of information that we’ve created before.
We will make the script executable with this simple step:
chmod +x wordpress_grafana.sh
We will make sure we have jq installed, an apt-get install jq or yum install jq if we use CentOS:
sudo apt-get install jq
And when we launch it, if everything went well, we’ll see what happens next:
HTTP/1.1 204 No Content
Content-Type: application/json
Request-Id: 9ba3716e-8868-11ea-ad9d-0050569002da
X-Influxdb-Build: OSS
X-Influxdb-Version: 1.7.10
X-Request-Id: 9ba3716e-8868-11ea-ad9d-0050569002da
Date: Mon, 27 Apr 2020 09:22:25 GMT
Besides, it would be nice to put it in the cron to run every 30 minutes:
crontab -e
*/30 * * * * /home/oper/wordpress_grafana.sh >> /var/log/wordpress-stats.log 2>&1
That’s it for now, to the next step
Grafana Worldmap Panel
We will need to have installed the magnificent Worldmap Panel, as simple as from the Grafana server launch:
grafana-cli plugins install grafana-worldmap-panel
And restart Grafana’s service:
service grafana-server restart
So we have now everything ready.
Dashboards de Grafana
I created a Dashboard from scratch by selecting the best requests to the database, finishing off colors, thinking about graphics, and how to display them, and everything is automated so that it fits our environment without any problem and without having to edit anything manually. The Dashboard that you can find here, once deployed, you will be able to see everything:
Import Grafana Dashboards easily
So that you don’t have to waste hours configuring a new Dashboard, and ingesting and debugging you want, I have already created four wonderful Dashboards with everything you need to monitor our environment in a very simple way, you will be like the image I showed you above.
Select the name you want and enter the ID: 12193, which is the unique ID of the Dashboard, or the URL:
That’s all folks, if you want to follow the full Blog series about Grafana, InfluxDB, Telegraf, please click on the next links:- En busca del Dashboard perfecto: InfluxDB, Telegraf y Grafana – Parte I (Instalando InfluxDB, Telegraf y Grafana)
- En busca del Dashboard perfecto: InfluxDB, Telegraf y Grafana – Parte II (Instalar agente Telegraf en Nodos remotos Linux)
- En busca del Dashboard perfecto: InfluxDB, Telegraf y Grafana – Parte III Integración con PRTG
- En busca del Dashboard perfecto: InfluxDB, Telegraf y Grafana – Parte IV (Instalar agente Telegraf en Nodos remotos Windows)
- En busca del Dashboard perfecto: InfluxDB, Telegraf y Grafana – Parte V (Activar inputs específicos, Red, MySQL/MariaDB, Nginx)
- En busca del Dashboard perfecto: InfluxDB, Telegraf y Grafana – Parte VI (Monitorizando Veeam)
- En busca del Dashboard perfecto: InfluxDB, Telegraf y Grafana – Parte VII (Monitorizar vSphere)
- En busca del Dashboard perfecto: InfluxDB, Telegraf y Grafana – Parte VIII (Monitorizando Veeam con Enterprise Manager)
- En busca del Dashboard perfecto: InfluxDB, Telegraf y Grafana – Parte IX (Monitorizando Zimbra Collaboration)
- En busca del Dashboard perfecto: InfluxDB, Telegraf y Grafana – Parte X (Grafana Plugins)
- En busca del Dashboard perfecto: InfluxDB, Telegraf y Grafana – Parte XI
- Looking for the Perfect Dashboard: InfluxDB, Telegraf and Grafana – Part XII (Native Telegraf Plugin for vSphere)
- Looking for the Perfect Dashboard: InfluxDB, Telegraf and Grafana – Part XIII (Veeam Backup for Microsoft Office 365 v4)
- Looking for the Perfect Dashboard: InfluxDB, Telegraf and Grafana – Part XIV – Veeam Availability Console
- Looking for the Perfect Dashboard: InfluxDB, Telegraf and Grafana – Part XV (IPMI Monitoring of our ESXi Hosts)
- Looking for Perfect Dashboard: InfluxDB, Telegraf and Grafana – Part XVI (Performance and Advanced Security of Veeam Backup for Microsoft Office 365)
- Looking for the Perfect Dashboard: InfluxDB, Telegraf and Grafana – Part XVII (Showing Dashboards on Two Monitors Using Raspberry Pi 4)
- En busca del Dashboard perfecto: InfluxDB, Telegraf y Grafana – Parte XVIII – Monitorizar temperatura y estado de Raspberry Pi 4
- Looking for the Perfect Dashboard: InfluxDB, Telegraf and Grafana – Part XIX (Monitoring Veeam with Enterprise Manager) Shell Script
- Looking for the perfect Dashboard: InfluxDB, Telegraf, and Grafana – Part XX (Monitoring SSL Certificates x.509)
- En busca del Dashboard perfecto: InfluxDB, Telegraf y Grafana – Parte XXI (Monitorizando HTTP Responses)
- Looking for the Perfect Dashboard: InfluxDB, Telegraf, and Grafana – Part XXII (Monitoring Cloudflare, include beautiful Maps)
- Looking for the Perfect Dashboard: InfluxDB, Telegraf, and Grafana – Part XXIII (Monitoring WordPress with Jetpack RESTful API)
date: data inválida “nullT00:00:00Z”
HTTP/1.1 400 Bad Request
Content-Type: application/json
Request-Id: ebb70e58-f761-11ea-9cb7-00163e1d5e1a
X-Influxdb-Build: OSS
X-Influxdb-Error: unable to parse ‘wordpress_api_stats,site=https:\/\/pauloramos.tech totalvisitors=null,totalviews=null,bestday=null,totalcomments=null,totalposts=null,totalfollowers=null,totalfollowerscomments=null,totalcomments=null ‘: invalid number
X-Influxdb-Version: 1.8.2
X-Request-Id: ebb70e58-f761-11ea-9cb7-00163e1d5e1a
Date: Tue, 15 Sep 2020 14:44:12 GMT
Content-Length: 250
{“error”:”unable to parse ‘wordpress_api_stats,site=https:\\/\\/pauloramos.tech totalvisitors=null,totalviews=null,bestday=null,totalcomments=null,totalposts=null,totalfollowers=null,totalfollowerscomments=null,totalcomments=null ‘: invalid number”}
jq: error (at :1): Cannot iterate over null (null)
jq: error (at :1): Cannot iterate over null (null)
jq: error (at :1): Cannot iterate over null (null)
jq: error (at :1): Cannot iterate over null (null)
Hello,
Something is wrong, probably some of the steps have not done correctly. Give it another try step by step and let me know.
hello
Same Problem here..
an old Script for a already existing wordpress works.
but a new script for a new wordpress produce the same problem.
thanks
Hello Julien,
Which script are you using exactly? The last one from github?
What is the error?
hi Jorge
exactly the same than prhr666
Okay,
Which version of the script, latest one from the Github?
yes the last from github
Can you try on line 32, replace what you have for this WPAuthBearer=’YOURAUTHCODE’ so, just simple not double?
Trying to debug now, it seems that WordPress does not have anything else to do that give token with special characters such as ^#!)&^ that of course makes things difficult for variables.
Hello,
Please grab the latest version of the script, it should work flawlessly 🙂
thanks , i will try tomorow , i ll keep you update
Works ! thanks! great work (as usual) !
Glad to hear, enjoy it!
Hi,
Thanks for the detail explanation. From the image you have shown in this post – right-hand side map and the graphs are on the left. Is it possible to link them? I mean clicking on the points on the map will open up a graph of the corresponding point? Say if we are monitoring temp of a device then time-vs-temp graph etc.?
Thanks.
Hello Deba,
Yes, I think some of the queries, you can call another query, and it is all to do with variables, etc. But never done it, probably easier to make the Countries variables on the top, and from there everything changes, that will be easier.