
 Greetings friends, for years I have been talking about InfluxDB, Grafana, and how to combine all of this to monitor VMware. It has been quite a journey, started in 2016 with the first blog in Spanish, then in 2018 wrote the VMware steps in English to reach a bit more audience, which it did, as at the time of writing this, the Grafana Dashboard for VMware vSphere Overview has more than 12K downloads, I can only hope all of these are real VMware Environments on Datacenters, which if they are it is a lot of happy people out there.
Farewell InfluxDB v1.x, hello InfluxDB v2 + Flux
Where we’re going, we don’t need Roads! In November 2020, InfluxData announced the GA of InfluxDB 2.0, tons of improvements but the most important one was the introduction of Flux, a next-generation data processing language. I know, I know, I do as well like traditional skateboards, traditional SQL-like queries, etc., but you know what is better?
 I have been delaying myself for far too long before making the jump to Flux, of course, life get in the way, we all have jobs, families, holidays, and a Global situation were spending time at the lab, or having the minimum attention span has become a challenge.
But writing this in December 2021, what happened since March 2020 for real, where am I, what day it is? InfluxDB wrote a blog post in May 2021 sharing the news about Roadmap, and InfluxDB v1.8 is the latest release on the 1.x branch, and not just that, there will be no more patches after the end of 2021.
As the day was coming, I started having more and more comments on LinkedIn, Emails, Twitter, asking me when I was planning to upgrade all the Dashboards to InfluxDB v2.0, and Flux, so the future is now.
Introducing VMware vSphere Modern Monitoring for InfluxDB v2, with Flux, and Grafana 8.x
Before I type any further, let me thank Dennis Faucher, a dear friend who has been an excellent help testing and troubleshooting all of this process. Dennis has been always there, joining the Webinars about this topic, helping and contributing on GitHub, really active on the vExpert Slack about this, plus on his blog, he writes really nice pieces about all things VMware, Orchestration, Monitoring, Automation, etc.
Decided to upgrade my InfluxDB v1.8 to InfluxDB v2, it could not be simpler just follow the next steps. Once I had InfluxDB v2, and Flux as a default query language, it was time to upgrade the Grafana Datasource, or you can add a new one, and from there it was hard work to convert queries like this:
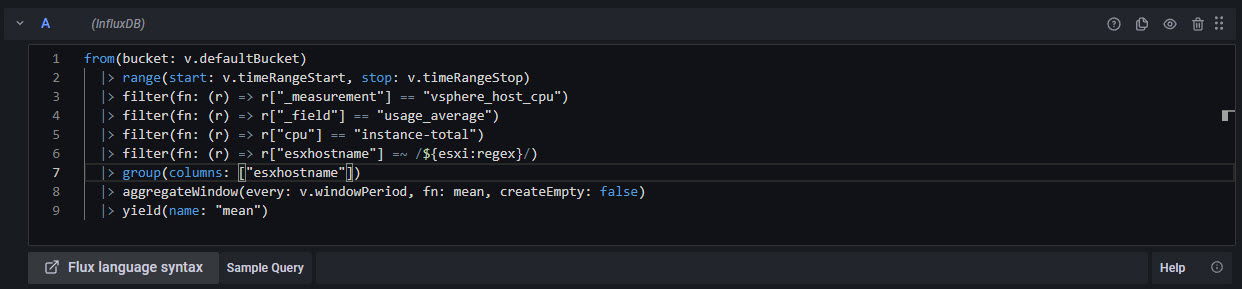
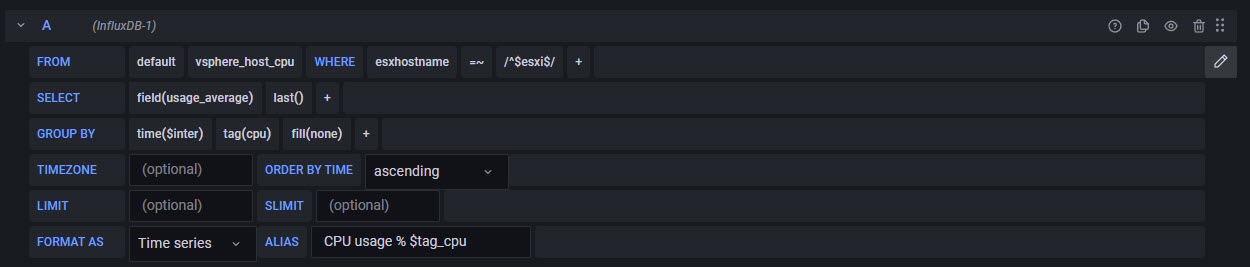 Into Flux queries like this:
 One by one, crafting them like a blacksmith forging a new utensil, needed to rethink everything, to learn how to do mathematical operations like this one for the Consumed Datastore:
from(bucket: v.defaultBucket)
  |> range(start: v.timeRangeStart, stop: v.timeRangeStop)
  |> filter(fn: (r) => r["_measurement"] == "vsphere_datastore_disk")
  |> filter(fn: (r) => r["_field"] == "capacity_latest" or r["_field"] == "used_latest")
  |> filter(fn: (r) => r["source"] =~ /${datastore:regex}/)
  |> pivot(rowKey:["_time"], columnKey: ["_field"], valueColumn: "_value")
  |> map(fn: (r) => ({ r with  _value: float(v: r.used_latest) / float(v: r.capacity_latest) * 100.0 }))
  |> group(columns: ["source","_field"])
  |> aggregateWindow(every: v.windowPeriod, fn: mean, createEmpty: false)
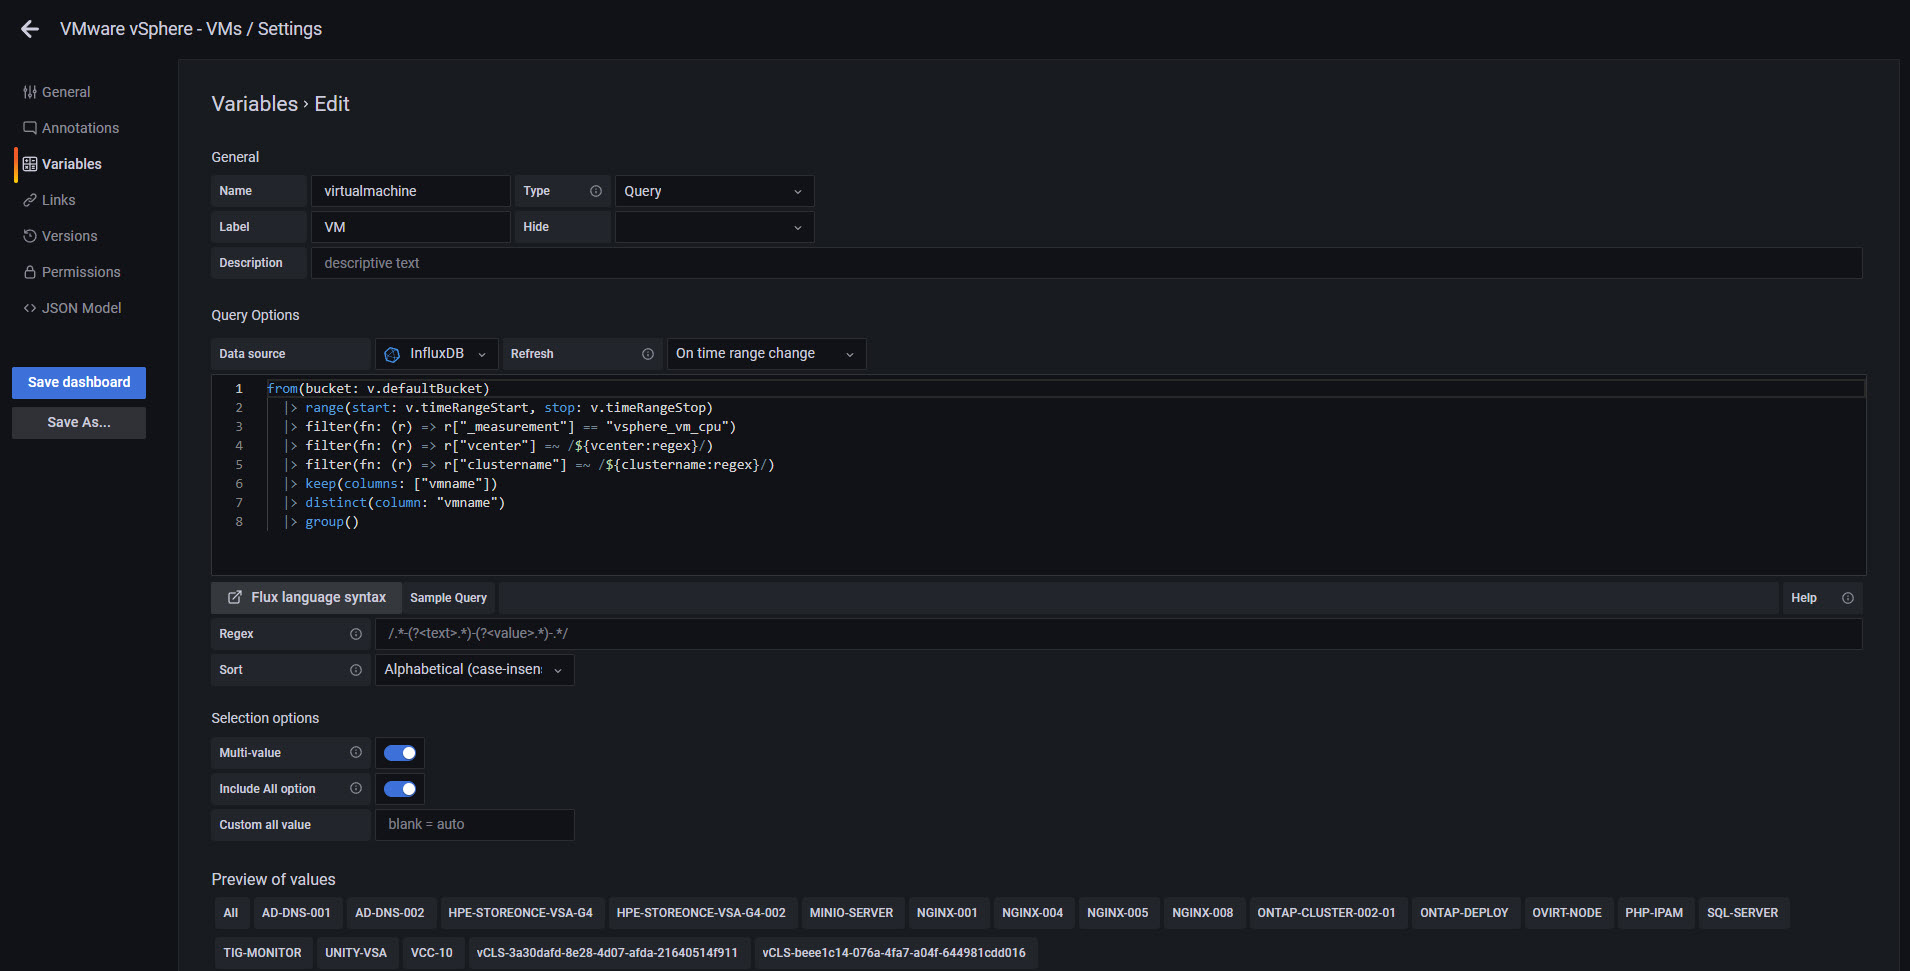
Or the variables, who now look much better:
 So far, I have finished editing all the main four Grafana Dashboards for VMware vSphere, you can find them here, just grab the latest version of them:
- Grafana vSphere Overview Dashboard
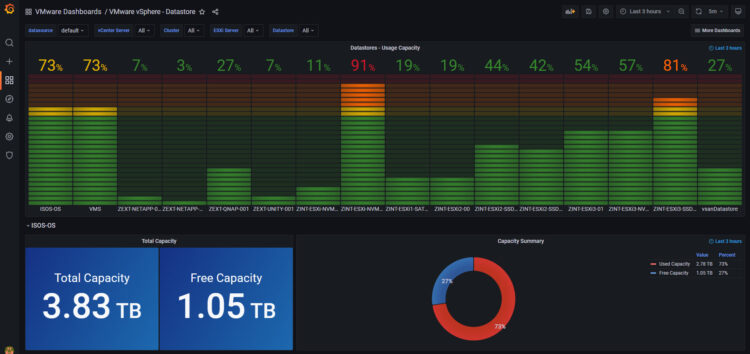
- Grafana vSphere Datastore Dashboard
- Grafana vSphere Hosts Dashboard
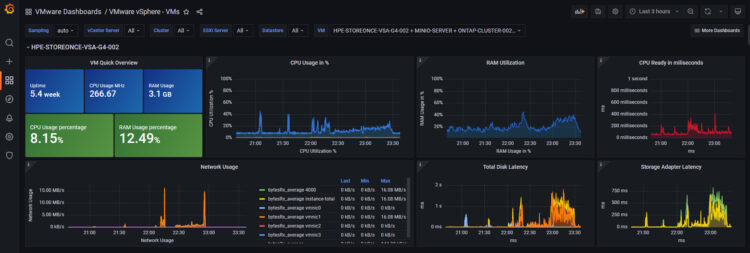
- Grafana vSphere VMs Dashboard
How do they look like in fresh 2021, with fresh and powerful InfluxDB v2, plus Grafana 8.x? Like this:
VMware vSphere Overview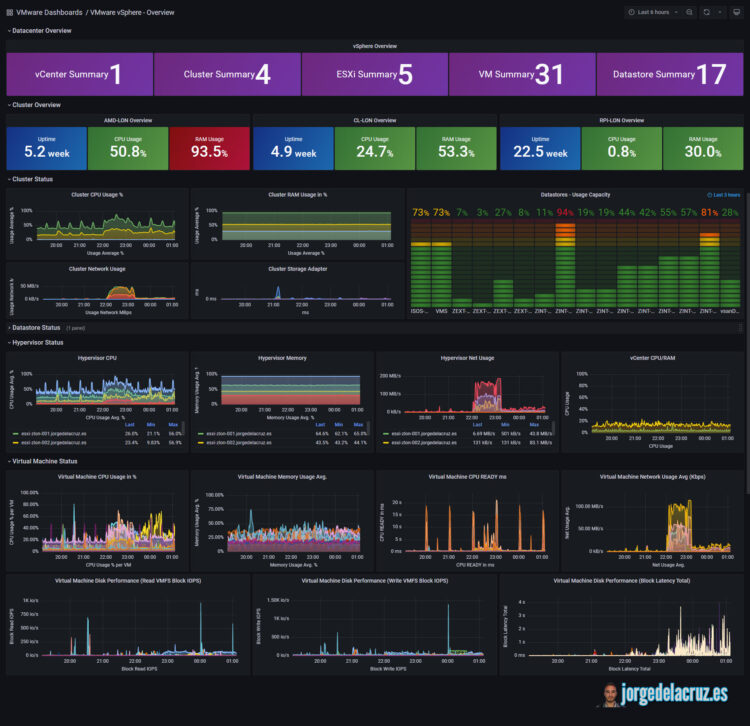 Grafana vSphere Datastore Dashboard
Grafana vSphere Hosts Dashboard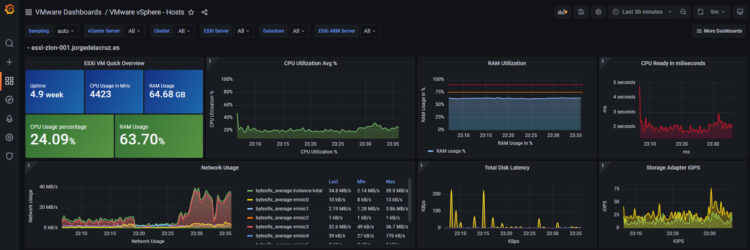
The best thing about them is that they will work out of the box, the only small thing you need to adjust on your telegraf is to make sure you send the data to a InfluxDB v2 format:
[outputs.influxdb_v2]
   urls = ["https://YOURINFLUXDBv2IPORFQDN:8086"]
   ## Token for authentication.
   token = "YOURTOKENTHATYOUCANCREATE"
   ## Organization is the name of the organization you wish to write to; must exist.
   organization = "YOURORG"
   ## Destination bucket to write into.
   bucket = "YOURBUCKET"
That’s all folks, if you want to follow the full Blog series about Grafana, InfluxDB, Telegraf, please click on the next links:
- Looking for the Perfect Dashboard: InfluxDB, Telegraf, and Grafana – Part I (Installing InfluxDB, Telegraf and Grafana on Ubuntu 20.04 LTS)
- En busca del Dashboard perfecto: InfluxDB, Telegraf y Grafana – Parte II (Instalar agente Telegraf en Nodos remotos Linux)
- En busca del Dashboard perfecto: InfluxDB, Telegraf y Grafana – Parte III Integración con PRTG
- En busca del Dashboard perfecto: InfluxDB, Telegraf y Grafana – Parte IV (Instalar agente Telegraf en Nodos remotos Windows)
- En busca del Dashboard perfecto: InfluxDB, Telegraf y Grafana – Parte V (Activar inputs específicos, Red, MySQL/MariaDB, Nginx)
- En busca del Dashboard perfecto: InfluxDB, Telegraf y Grafana – Parte VI (Monitorizando Veeam)
- En busca del Dashboard perfecto: InfluxDB, Telegraf y Grafana – Parte VII (Monitorizar vSphere)
- En busca del Dashboard perfecto: InfluxDB, Telegraf y Grafana – Parte VIII (Monitorizando Veeam con Enterprise Manager)
- En busca del Dashboard perfecto: InfluxDB, Telegraf y Grafana – Parte IX (Monitorizando Zimbra Collaboration)
- En busca del Dashboard perfecto: InfluxDB, Telegraf y Grafana – Parte X (Grafana Plugins)
- En busca del Dashboard perfecto: InfluxDB, Telegraf y Grafana – Parte XI – (Monitorizando URL e IPS con Telegraf y Ping)
- Looking for the Perfect Dashboard: InfluxDB, Telegraf, and Grafana – Part XII (Native Telegraf Plugin for vSphere)
- Looking for the Perfect Dashboard: InfluxDB, Telegraf, and Grafana – Part XIII (Veeam Backup for Microsoft Office 365 v4)
- Looking for the Perfect Dashboard: InfluxDB, Telegraf, and Grafana – Part XIV – Veeam Availability Console
- Looking for the Perfect Dashboard: InfluxDB, Telegraf, and Grafana – Part XV (IPMI Monitoring of our ESXi Hosts)
- Looking for Perfect Dashboard: InfluxDB, Telegraf, and Grafana – Part XVI (Performance and Advanced Security of Veeam Backup for Microsoft Office 365)
- Looking for the Perfect Dashboard: InfluxDB, Telegraf, and Grafana – Part XVII (Showing Dashboards on Two Monitors Using Raspberry Pi 4)
- En busca del Dashboard perfecto: InfluxDB, Telegraf y Grafana – Parte XVIII – Monitorizar temperatura y estado de Raspberry Pi 4
- Looking for the Perfect Dashboard: InfluxDB, Telegraf, and Grafana – Part XIX (Monitoring Veeam with Enterprise Manager) Shell Script
- Looking for the Perfect Dashboard: InfluxDB, Telegraf, and Grafana – Part XXIV (Monitoring Veeam Backup for Microsoft Azure)
- Looking for the Perfect Dashboard: InfluxDB, Telegraf, and Grafana – Part XXV (Monitoring Power Consumption)
- Looking for the Perfect Dashboard: InfluxDB, Telegraf, and Grafana – Part XXVI (Monitoring Veeam Backup for Nutanix)
- Looking for the Perfect Dashboard: InfluxDB, Telegraf, and Grafana – Part XXVII (Monitoring ReFS and XFS (block-cloning and reflink)
- Looking for the Perfect Dashboard: InfluxDB, Telegraf, and Grafana – Part XXVIII (Monitoring HPE StoreOnce)
- Looking for the Perfect Dashboard: InfluxDB, Telegraf, and Grafana – Part XXIX (Monitoring Pi-hole)
- Looking for the Perfect Dashboard: InfluxDB, Telegraf, and Grafana – Part XXIX (Monitoring Veeam Backup for AWS)
- Looking for the Perfect Dashboard: InfluxDB, Telegraf, and Grafana – Part XXXI (Monitoring Unifi Protect)
- Looking for the Perfect Dashboard: InfluxDB, Telegraf, and Grafana – Part XXXII (Monitoring Veeam ONE – experimental)
- Looking for the Perfect Dashboard: InfluxDB, Telegraf, and Grafana – Part XXXIII (Monitoring NetApp ONTAP)
- Looking for the Perfect Dashboard: InfluxDB, Telegraf, and Grafana – Part XXXIV (Monitoring Runecast)
- Looking for the Perfect Dashboard: InfluxDB, Telegraf, and Grafana – Part XXXV (GPU Monitoring)
Beautifully done. I love the Flux Capacitor reference. Looks like it’s time we all spent some time learning the Flux language. Also, thank you for the kind words. You have been very helpful to me in my journey.
Hello, great job! My understanding is that, as it was in the past, Telegraf still needs vCenter to retrieve the information, and having a single instance of vSphere ESXi is not supported. Correct?
Hello Marco,
Telegraf uses the SDK, it is my understanding that you can still point to a single ESXi, and it will give you some data, not sure how much compared to a full Center, will try and let you know.
Best regards