
 Greetings friends, for years you know I have been a big advocate of REST API, that is the way to go always, it is modern, it is secure, and it is supported on most cases.
Accessing the data through REST API (SUPPORTED & RECOMMENDED)
Veeam ONE has a very particular feature-rich API available, that can offer tons of information regarding Data Protection at scale, here is the Helpcenter where you can navigate it all:
If you think this is too dense, and difficult to start with, why don’t you look at the Veeam ONE REST API Reference Map instead?
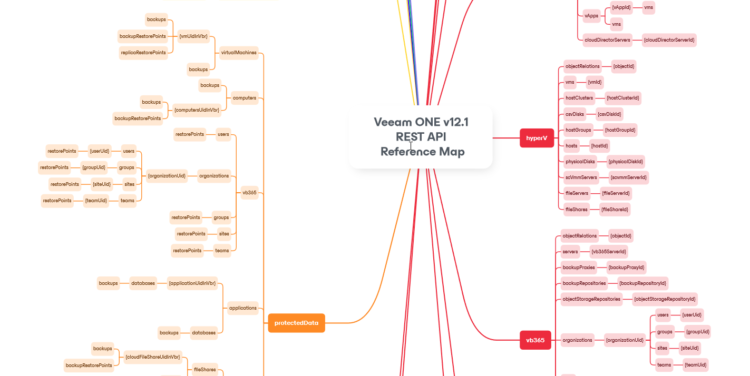 I was mentioning at scale, because it is not the same to query one Veeam Backup & Replication Server, or one Veeam Backup for Microsoft 365, or Veeam for Cloud, that when you have a few dozen of systems, or even hundreds like many Customers have. All around the Globe, in different locations, etc. It becomes difficult to get the data on REST API this way, but not with Veeam ONE, which has all of this for you at one click away.
Right, let’s keep moving. One thing Veeam ONE REST API doesn’t have, yet, is the ability to get the data from Reports, exposed as endpoints. Pick one of your favourite reports among all Veeam has, you filter scope, you apply some filters, you are so happy with the output, but you want more, you also need this data somewhere else, in modern format (JSON, PowerShell, etc.) I got you.
Accessing the data through SQL Stored Procedures (UNSUPPORTED)
Did I said this is unsupported? Well, yes it is. I mean, this method is not like you are running SQL SELECT or anything dangerous to be honest, it is just EXEC some stored procedures that Veeam has, but of course, Support will not be able to help you with any of this, but if it works for you and can help with getting the data you need, then all good.
Wait, what are these Stored Procedures, where can I find them?
SQL Stored Procedures are some sort of combination of complex queries to different tables, and operations, like a big recipe. The advantage of these stored procedures is that you only need to apply a few predefined parameters to make it run, and the output is always consistent and in clear text. You can find them under your SQL instance Programmability > Stored Procedures > they start with reporter.rsrp_XXXXX, you can filter the view with contains rsrp_:
 You can go ahead and run some of them if you want, the only downside is that some require data to the settings, like dates, or some more advanced filtering like VBR ID, etc. So, it is true that some are easier to run than others.
SQL Server Profiler, the red X in the treasure map
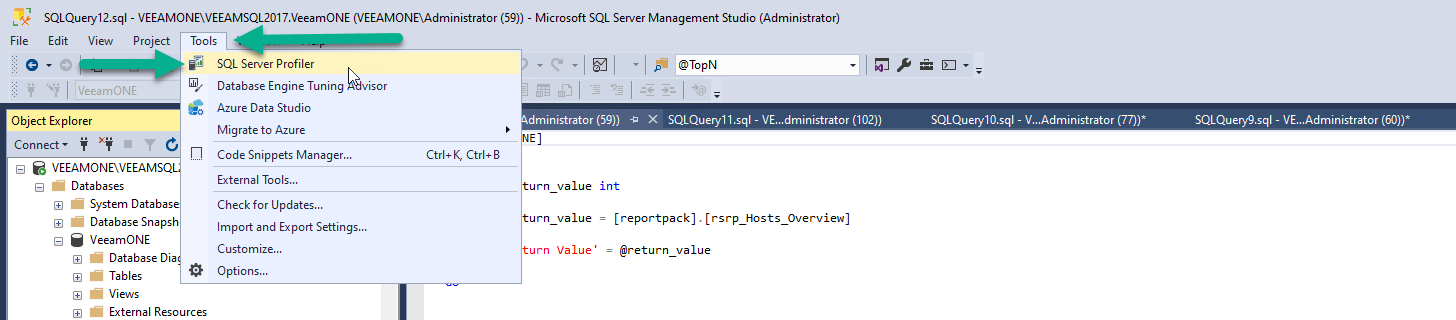
Now, of course I will not show you the map to the treasure without giving you the final clue. In order to comprehend these stored procedures, plus also making your life easier, we will use SQL Server Profiler. The idea is that we run our normal report, from the web interface, and we obtain a trace and what happened in SQL. Let’s open SQL Server Profiler now:
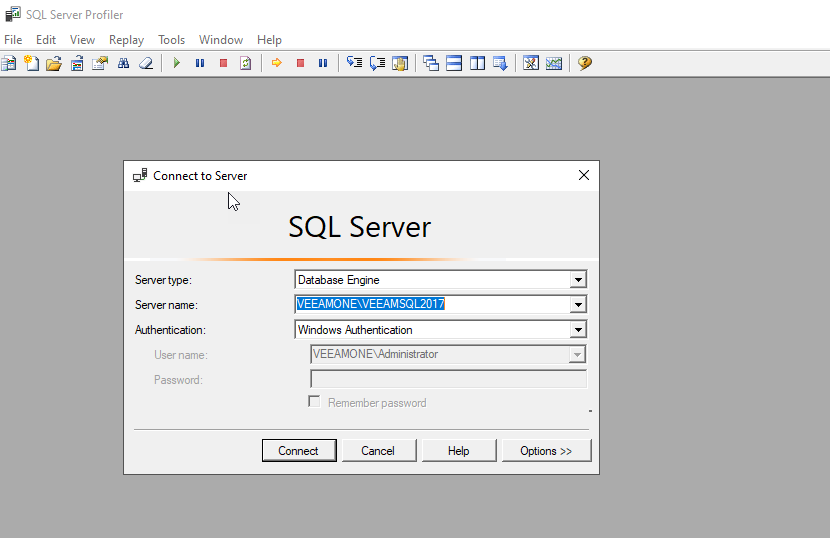
 Great, now we need to configure it quite a bit, nothing major do not worry we will do it together. First step is to authenticate to the SQL Server:
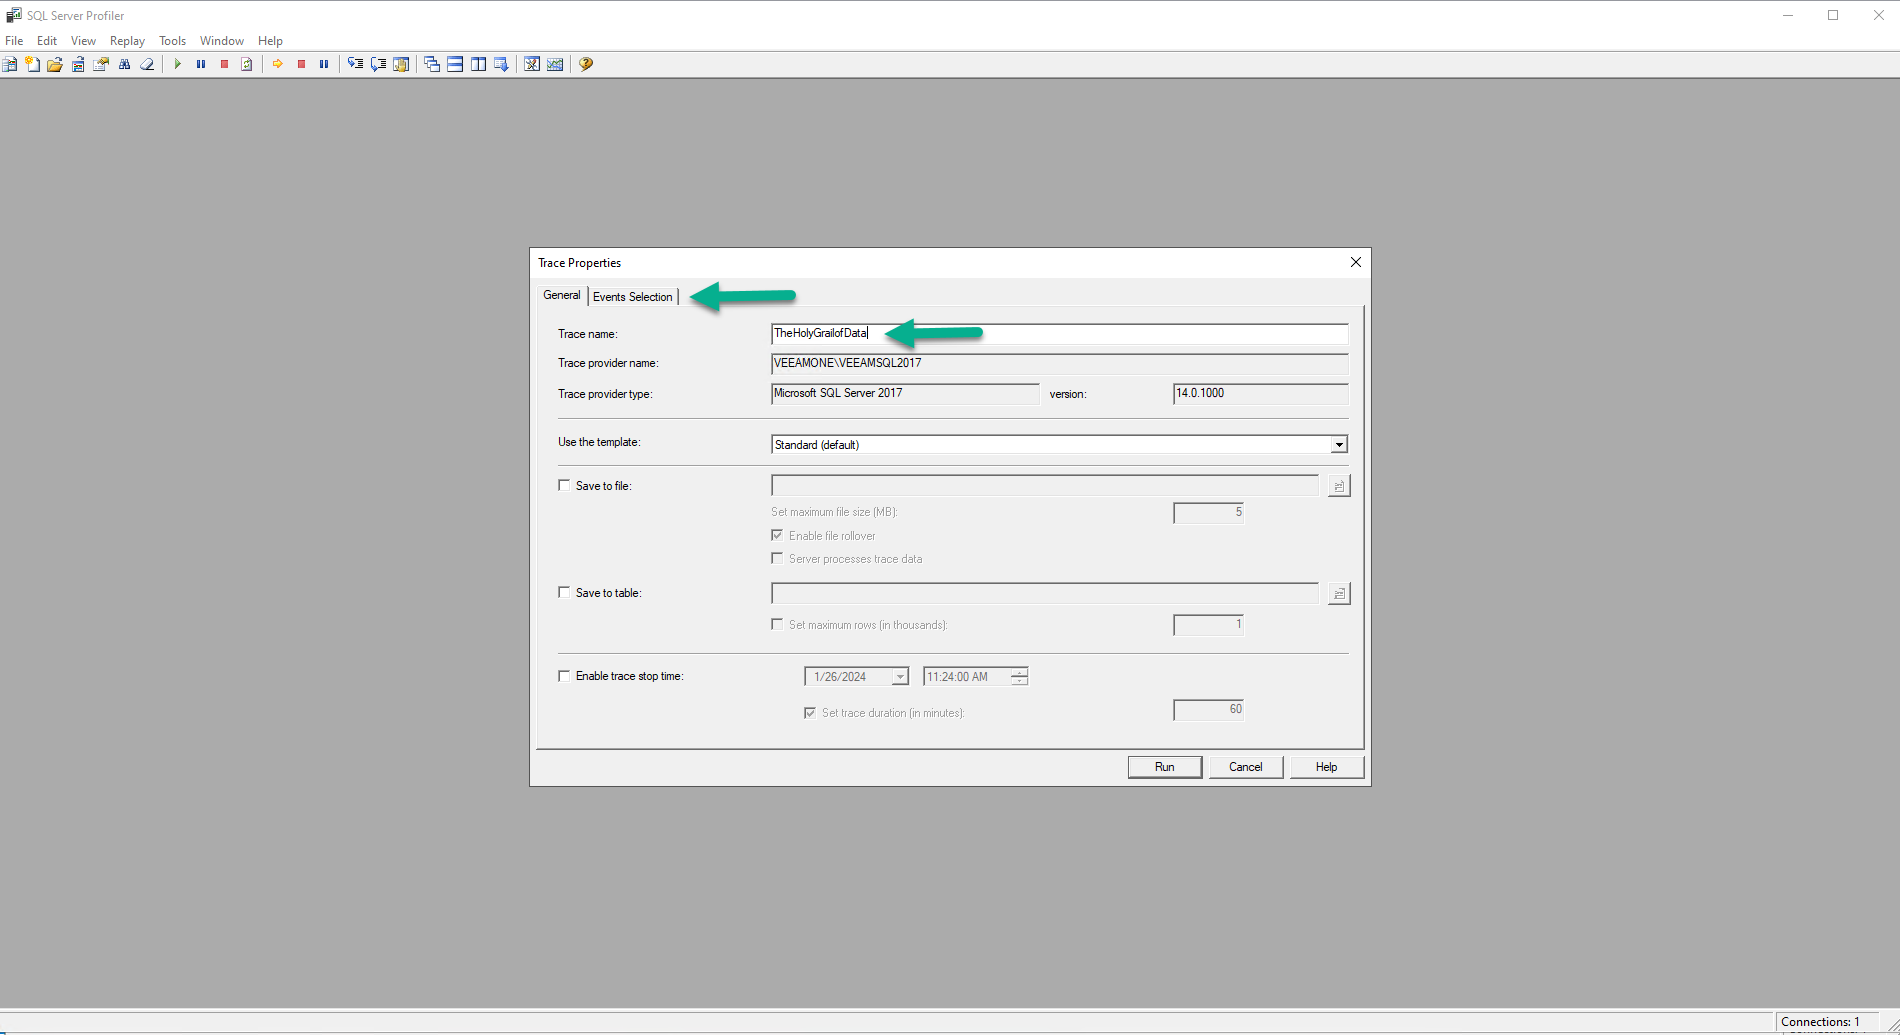
 The wizard will appear, introduce a name for your profiler, I called TheHollyGrailofData, but you can select your own. Once ready, please click on the tab called Events Selection:
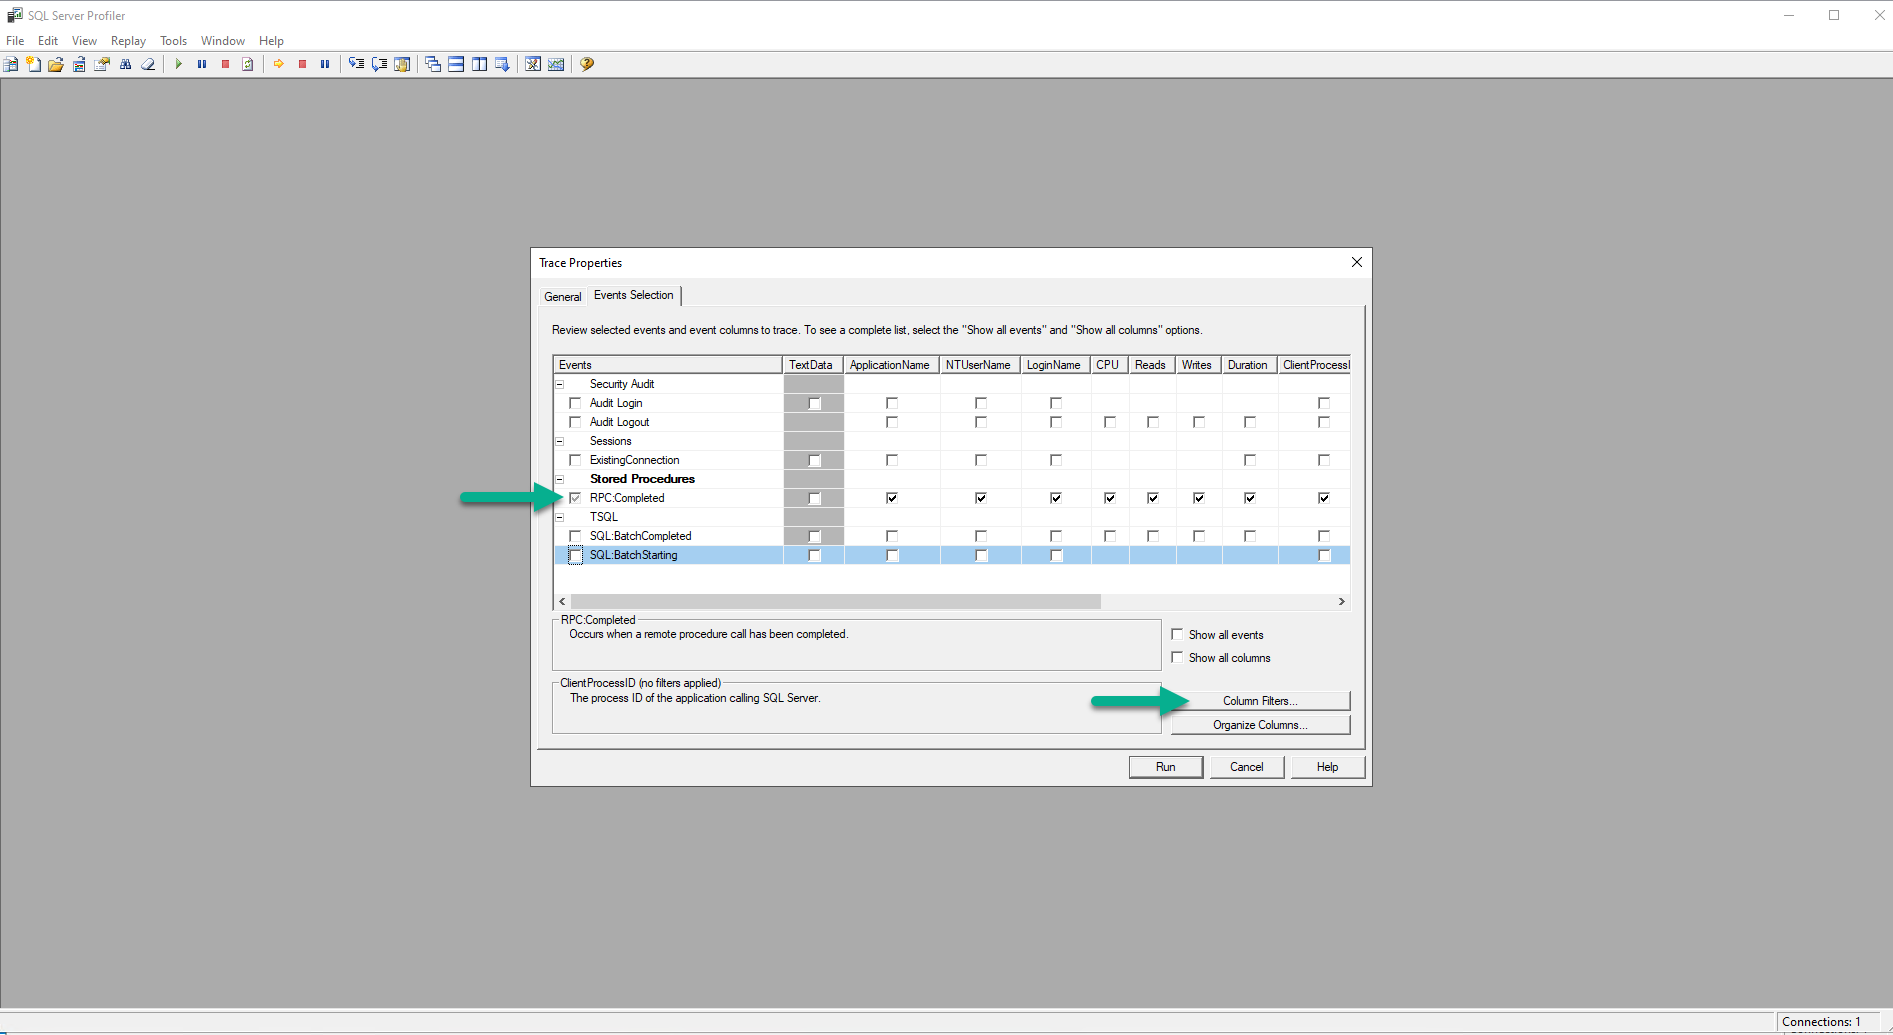
 Please do remove absolutely everything despite Stored Procedures RPC: Completed, from the columns: up to you if you want to remove some of that, I’ve decided to keep it. Please click now on Column filters:
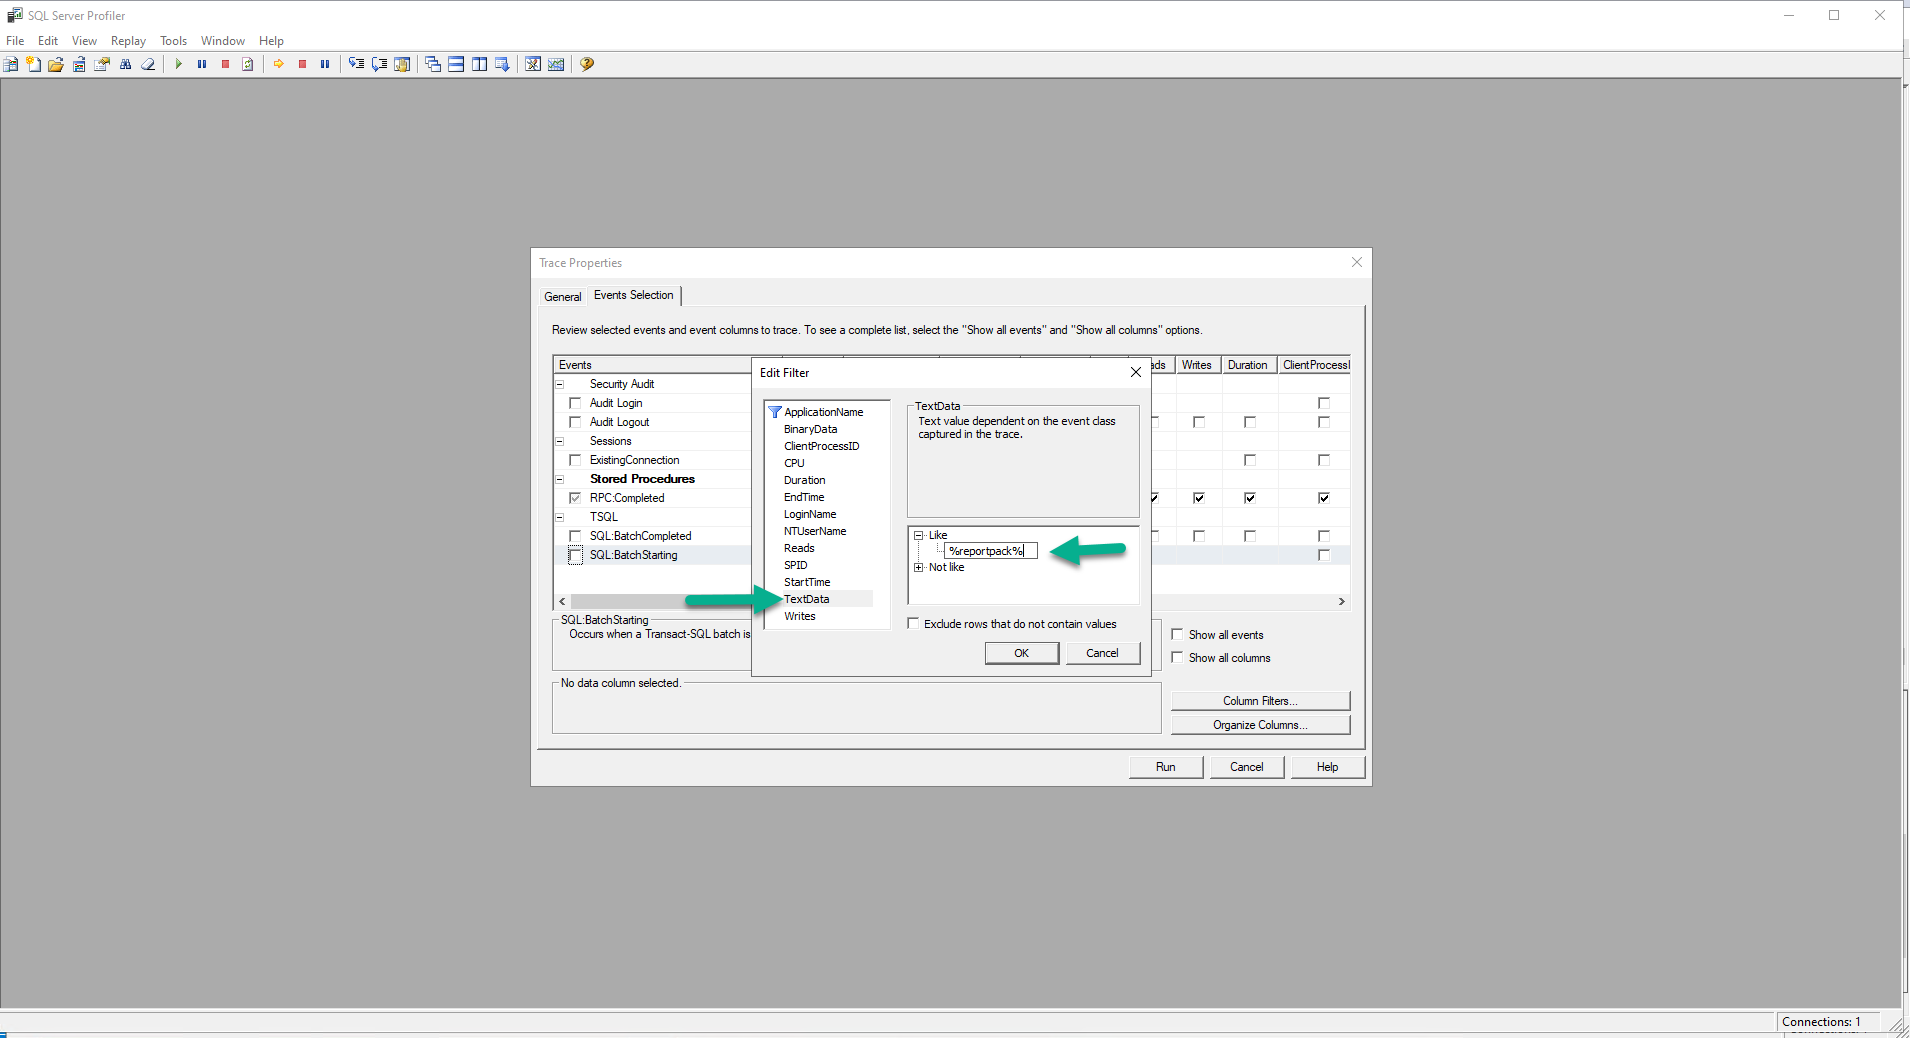
 Introduce a new filter under the TextData Filter, Like %reportpack% click OK, and finally Run:
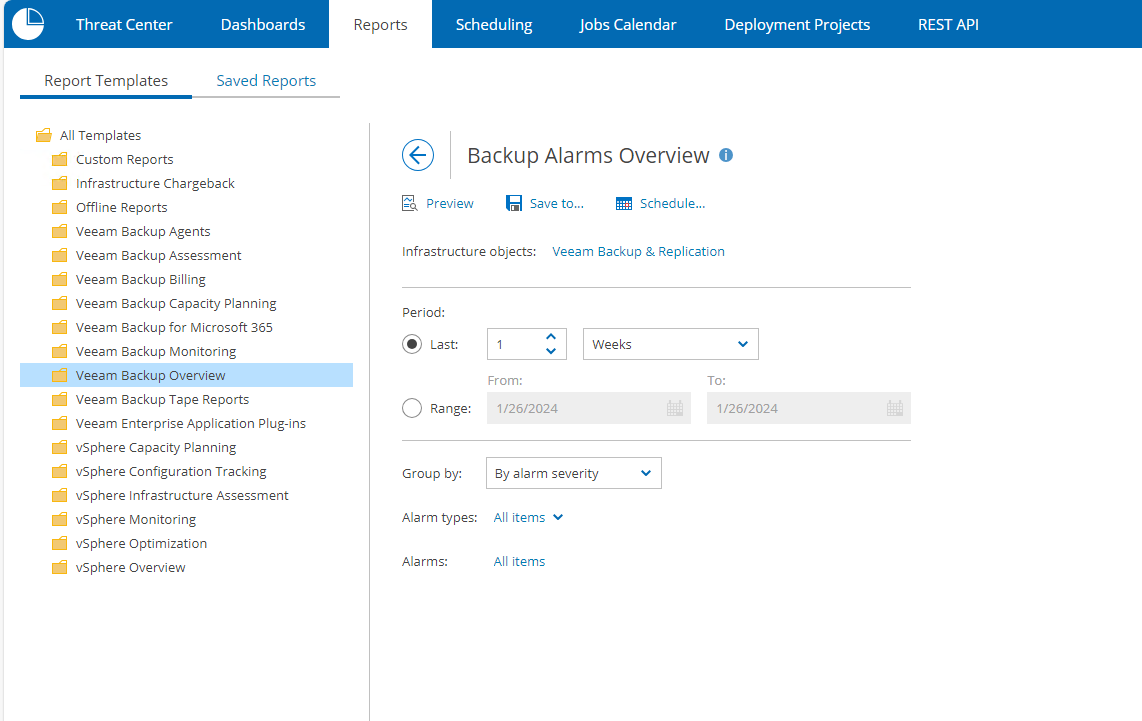
 The trace pager will open, and it will wait until we run some reports. Let’s do it. Now from regular Veeam ONE Web Client, select your favourite report, in my case Backup Alarms Overview, and run it:
 Great, that’s all. Now let’s go back to the SQL Server Profiler we have open and identify the query, or queries this has run. You will see a few ones, because sometimes some queries are for parameters, and some others are for the child reports. You will get used to, but when you find the row that is important for you, you can reuse it moving forward:
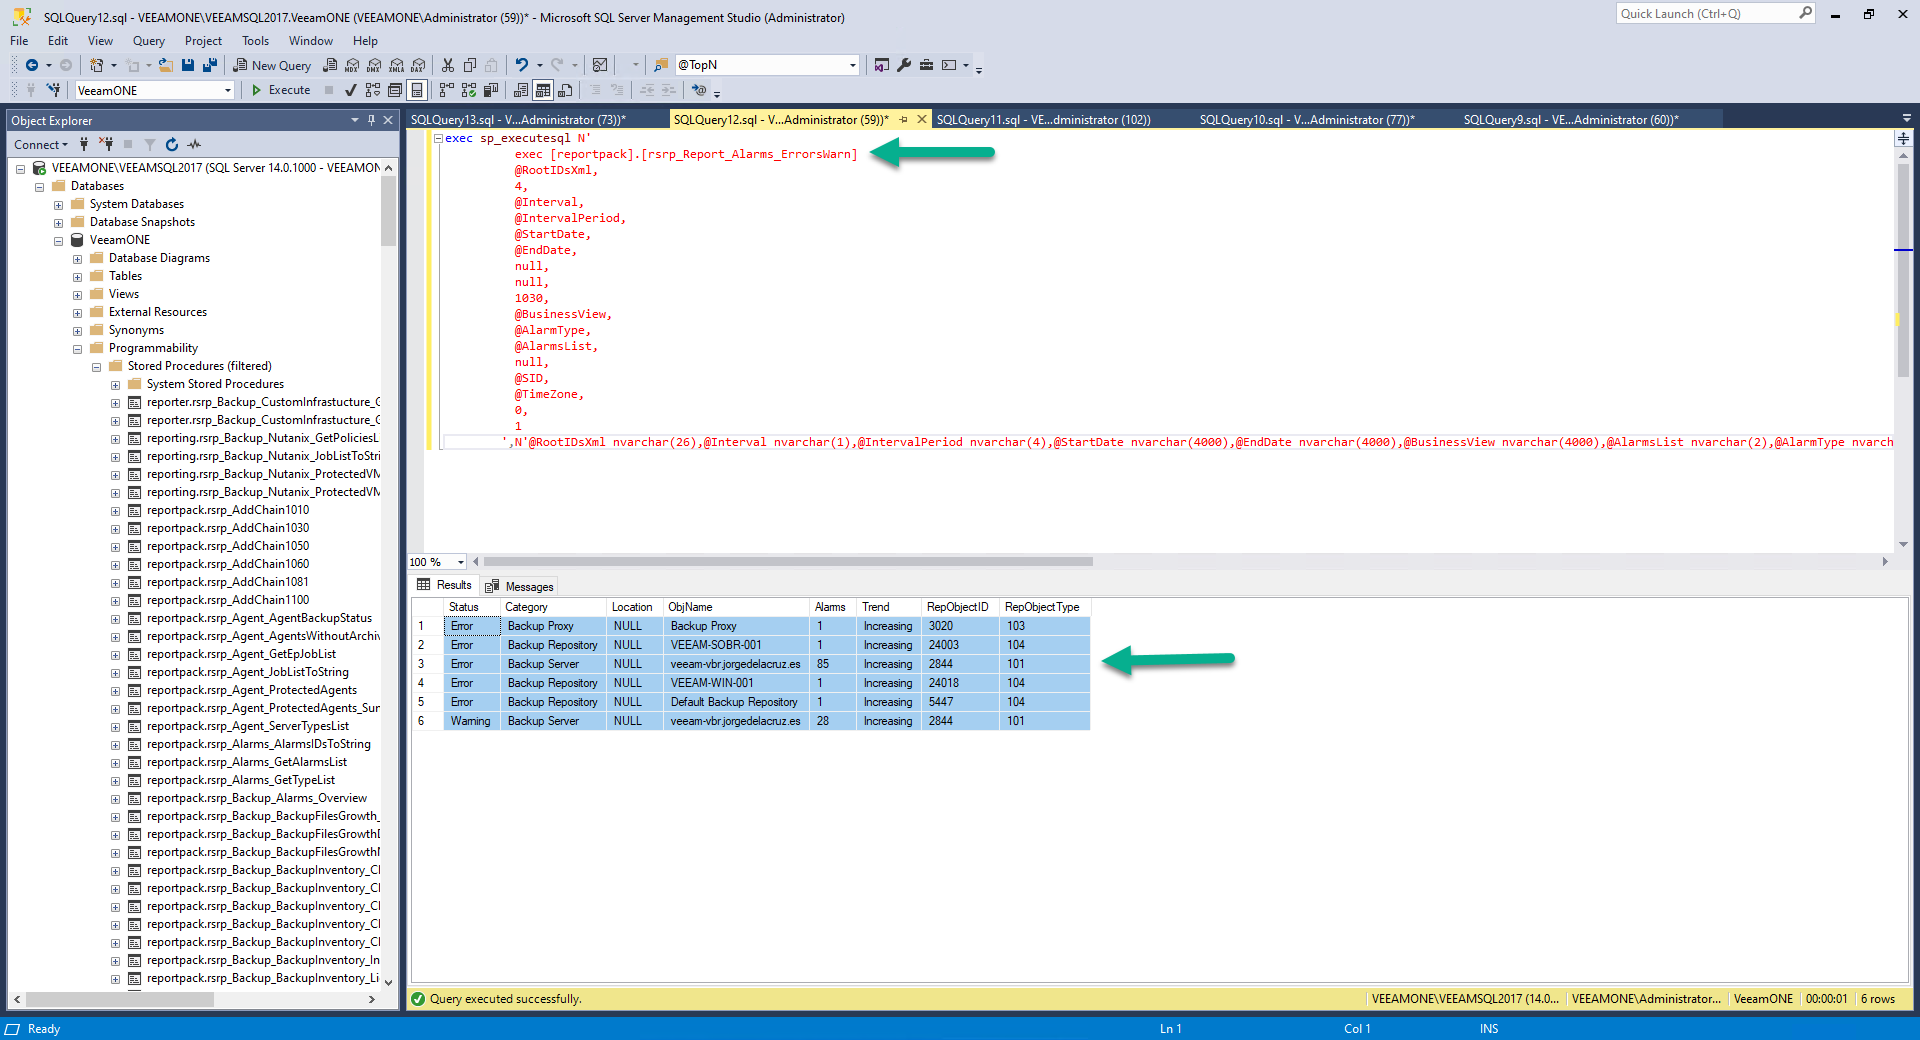
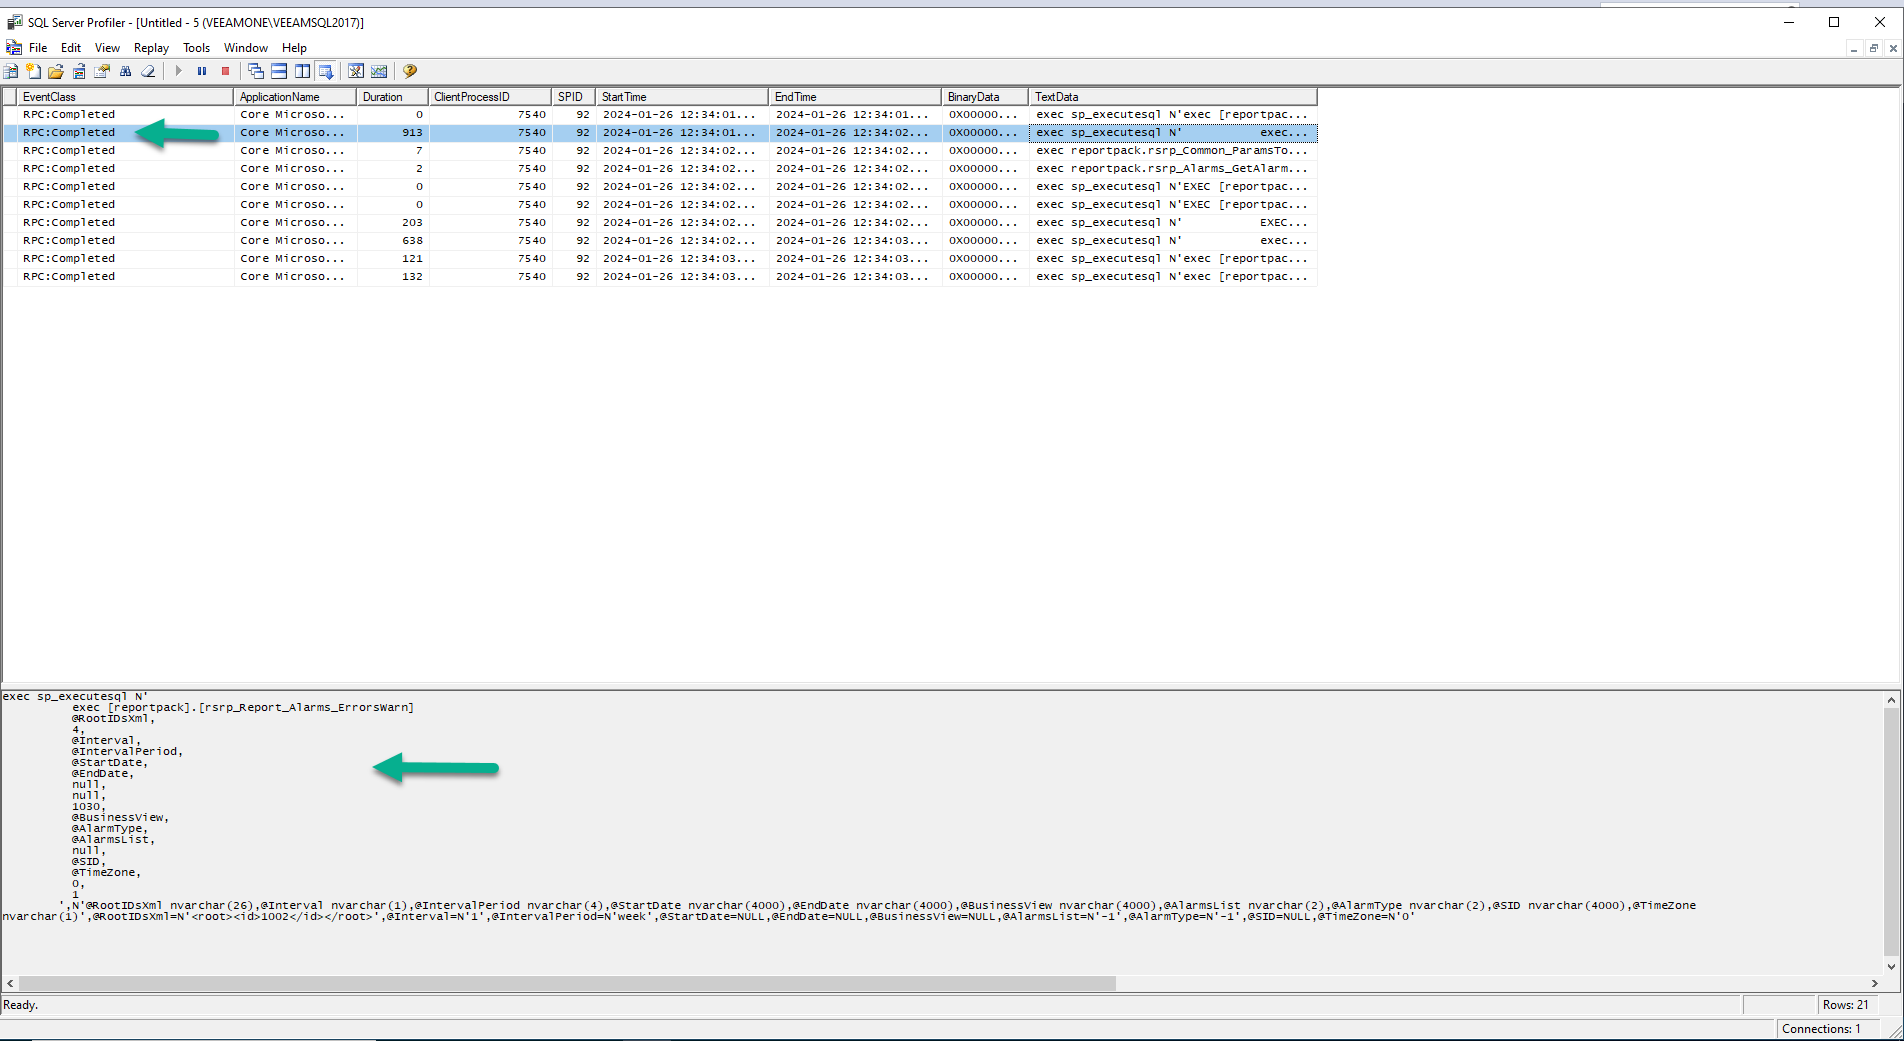 Let’s take that magic recipe we can see in plain text, and run it as SQL Query, and bingo! Please enjoy now your Gold and jewellery:
One-Eyed Willy final free the ship trick
Of course, this treasure can not stay just in SQL Stored Procedures and queries. It should be freed, take this data somewhere else: JSON, CSV, PowerShell, Web, you name it.
I know, I know, I said I got you. Here is a very simple PowerShell script that:
- Connects to your SQL Server using Microsoft current authentication from the user running the script
- Adds all your Stored Procedure stuff you got from the SQL Server Profiler
- Prints the output in the PowerShell console
- Exports the output as an HTML table
Use it at your own discretion, not supported:
# Specify the SQL Server and database
$SQLServer = "VEEAMONE\VEEAMSQL2017"
$SQLDBName = "VEEAMONE"
# Build the connection string
$ConnectionString = "Server = $SQLServer; Database = $SQLDBName; Integrated Security = True;"
# Instantiate a new SQL Connection
$SqlConnection = New-Object System.Data.SqlClient.SqlConnection
$SqlConnection.ConnectionString = $ConnectionString
# Instantiate a new SQL Command for the new stored procedure
$SqlCmd = New-Object System.Data.SqlClient.SqlCommand
$SqlCmd.Connection = $SqlConnection
$SqlCmd.CommandTimeout = 86400
$SqlCmd.CommandType = [System.Data.CommandType]::Text
$SqlCmd.CommandText = "exec [reportpack].[rsrp_Report_Alarms_ErrorsWarn] @RootIDsXml, 4, @Interval, @IntervalPeriod, @StartDate, @EndDate, null, null, 1030, @BusinessView, @AlarmType, @AlarmsList, null, @SID, @TimeZone, 0, 1"
# Add the parameters
$SqlCmd.Parameters.AddWithValue("@RootIDsXml", "<root><id>1002</id></root>") | Out-Null
$SqlCmd.Parameters.AddWithValue("@Interval", "1") | Out-Null
$SqlCmd.Parameters.AddWithValue("@IntervalPeriod", "week") | Out-Null
$SqlCmd.Parameters.AddWithValue("@StartDate", [DBNull]::Value) | Out-Null
$SqlCmd.Parameters.AddWithValue("@EndDate", [DBNull]::Value) | Out-Null
$SqlCmd.Parameters.AddWithValue("@BusinessView", [DBNull]::Value) | Out-Null
$SqlCmd.Parameters.AddWithValue("@AlarmsList", "-1") | Out-Null
$SqlCmd.Parameters.AddWithValue("@AlarmType", "-1") | Out-Null
$SqlCmd.Parameters.AddWithValue("@SID", [DBNull]::Value) | Out-Null
$SqlCmd.Parameters.AddWithValue("@TimeZone", "0") | Out-Null
# Open SQL Connection and execute the command
Write-Host "Opening SQL Connection and fetching data..."
$SqlConnection.Open()
$SqlAdapter = New-Object System.Data.SqlClient.SqlDataAdapter $SqlCmd
$DataSet = New-Object System.Data.DataSet
$SqlAdapter.Fill($DataSet) > $null
$SqlConnection.Close()
Write-Host "SQL Data fetched successfully."
# Display the results in the console
Write-Host "Displaying data..."
$DataSet.Tables[0] | Format-Table -AutoSize
# Define the path for the HTML file
$htmlFilePath = "$PSScriptRoot\AlarmsErrorsWarnOverview.html"
# Convert the data to an HTML table and save it
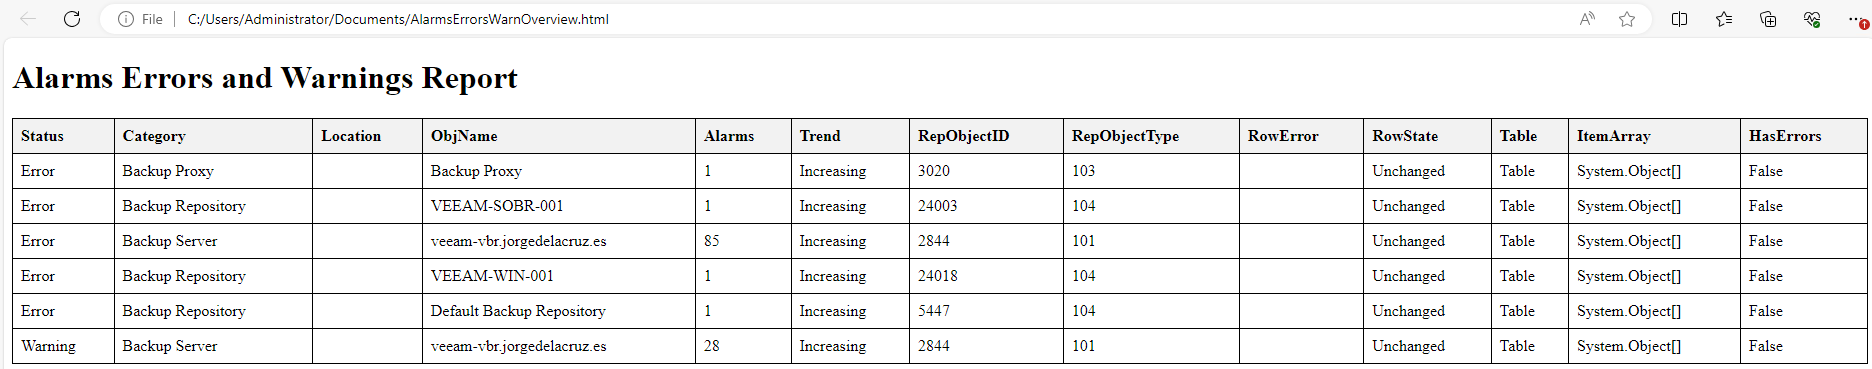
$DataSet.Tables[0] | ConvertTo-Html -Title "Alarms Errors and Warnings Overview" -PreContent "<h1>Alarms Errors and Warnings Report</h1>" -Body "<style>table {border-collapse: collapse; width: 100%;} th, td {border: 1px solid black; padding: 8px; text-align: left;} th {background-color: #f2f2f2;}</style>" | Out-File -FilePath $htmlFilePath
Write-Host "HTML report saved to $htmlFilePath"
If we run this script, you will see an output like this:
Opening SQL Connection and fetching data...
SQL Data fetched successfully.
Displaying data...

Status  Category          Location ObjName                    Alarms Trend      RepObjectID RepObjectType
------  --------          -------- -------                    ------ -----      ----------- -------------
Error   Backup Proxy               Backup Proxy                    1 Increasing        3020           103
Error   Backup Repository          VEEAM-SOBR-001                  1 Increasing       24003           104
Error   Backup Server              veeam-vbr.jorgedelacruz.es     86 Increasing        2844           101
Error   Backup Repository          VEEAM-WIN-001                   1 Increasing       24018           104
Error   Backup Repository          Default Backup Repository       1 Increasing        5447           104
Warning Backup Server              veeam-vbr.jorgedelacruz.es     28 Increasing        2844           101


HTML report saved to C:\Users\Administrator\Documents\AlarmsErrorsWarnOverview.html
And the HTML it generates, nothing fancy, will look like this:
 So, there you go. The map to find the treasure, how to open the chest, and how to take the ship and the treasure somewhere else:
 Bye Willy.
Leave a Reply