
 Greetings friends, over there in October 2020 I officially reported on the Influxdata Github, the bug that we all seemed to have from telegraf 1.15 onwards, and that is that the VMware plugin does not collect well the cluster metrics, such as CPU and RAM consumption, among others.
These metrics are key, as they are what we see when we are looking at the Web Client Overview, like this: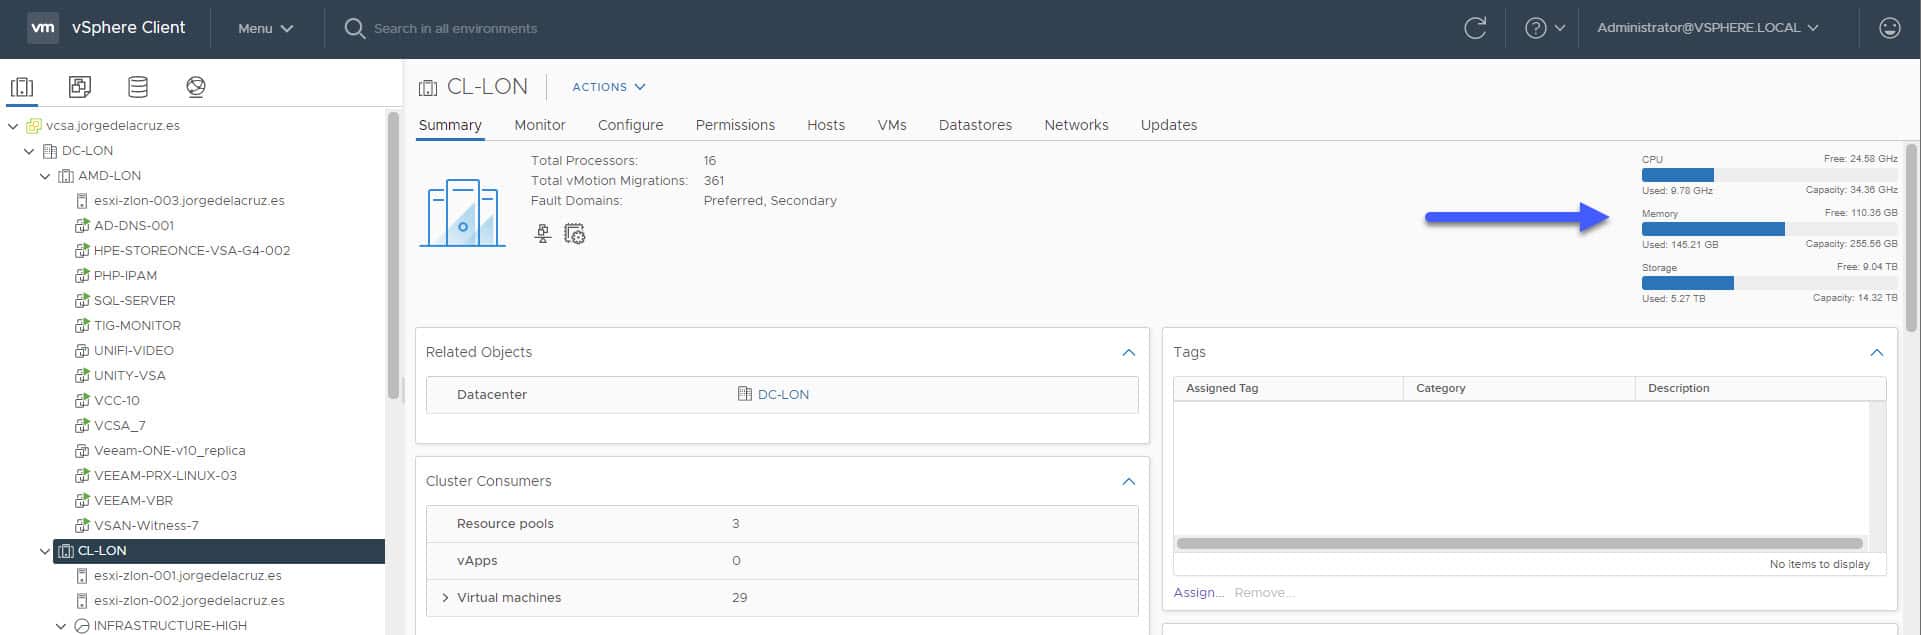 This situation has led many of you to comment on the blog in Spanish, in English, by mail, and in the Grafana Dashboard comments about the incident.
Well, I have good news, since Influxdata has released telegraf v.1.18.2, which includes among other improvements a workaround for the incident, let’s see how to activate it.
Telegraf v1.18.2 – Many improvements, but the most important for us is the one for VMware vSphere
As I was telling you, there are a lot of enhancements, I’ll break them all down for you together right here:
- Agent
- The JSON format is now compatible with nulls to ensure Telegraf successfully detects null values and returns an empty metric without error.
- The
common.shimhas been updated to accept larger inputs from the scanner.
- APCUPSD Input (
apcupsd)- Resolved an
ALARMDELbug in a forked repository. This fix ensures the plugin works whenno alarmdelay duration is set.
- Resolved an
- Converter Processor (
converter)- Added support for
float64to support converting longer hexadecimal string values into a numeric type without losing in precision. Note: if a string number exceeds the size limit forfloat64, precision may still be lost.
- Added support for
- NFS Client Input (
nfsclient)- Updated to successfully collect metrics other than read and write.
- SNMP Input (
snmp)- Updated to log snmpv3 auth failures.
- Sumo Logic Output (
sumologic)- Added support to sanitize the metric name in Carbon2 serializer.
- VMware vSphere Input (
vsphere)- Added the
MetricLookbacksetting to handle reporting delays in vCenter 6.7 and later.
- Added the
- OPC UA Client Input (
opcua)- Fixed the error handling.
How to upgrade to the latest version of Telegraf
I have told you how to install telegraf in several posts, if we have followed the steps and used Influxdata repositories it will be very simple, first check the version we have:
telegraf --version
Telegraf 1.18.1 (git: HEAD d3ac9a3f)
We can also update our InfluxDB, which has a recent update:
influx --version
InfluxDB shell version: 1.8.4
Let’s launch the typical command to update our packages, in my case it’s Ubuntu, so it would look like this:
apt-get update && apt-get upgrade
During the upgrade, it will ask us if we want to update the packages, among all the ones I don’t have updated we can see telegraf and influxdb, we will say Y:
The following packages have been kept back:
  base-files sosreport ubuntu-server
The following packages will be upgraded:
  cloud-init grafana grub-common grub-common grub-pc grub-pc-bin grub2-common influxdb libldap-2.4-2 libldap-common libpci3 libprocps8 linux-firmware pciutils procps
  python3-distupgrade telegraf ubuntu-release-upgrader-core update-notifier-common
18 upgraded, 0 newly installed, 0 to remove and 3 not upgraded.
Need to get 250 MB of files.
After this operation, 723 kB of additional disk space will be used.
Do you want to continue? Y/n]
That’s it, if we run the command again to see the version we have, we can see that we have updated without any problem.
In-depth knowledge of the new MetricLookback of the telegraf plugin for vSphere
What the guys from Influxdata have done has been to try to collect our cluster metrics using larger intervals than the 15 minutes previously used, to control this we have the new metric_lookback which is based on 5-minute chunks and how far we want to go.
From Influxdata they recommend us to use at most 8, which multiplied by 5, we have 40 minutes. So if the CPU consumption metric of the cluster is in that range it will take it and save it in InfluxDB as expected, I leave you the example of the config:
[[inputs.vsphere]]
## List of vCenter URLs to be monitored. These three lines must be uncommented
## and edited for the plugin to work.
interval = "20s"
vcenters = [ "https://vcsa.jorgedelacruz.es/sdk" ]
username = "[email protected]"
password = "TUPASS"

vm_metric_include = []
host_metric_include = []
datastore_metric_exclude = [ "*"]

max_query_metrics = 256
timeout = "60s"
insecure_skip_verify = true

[[inputs.vsphere]]
interval = "300s"
vcenters = [ "https://vcsa.jorgedelacruz.es/sdk" ]
username = "[email protected]"
password = "TUPASS"

  datastore_metric_include = [ "disk.capacity.latest", "disk.used.latest", "disk.provisioned.latest" ]
  cluster_metric_include = []
  datacenter_metric_include = []
  insecure_skip_verify = true
  force_discover_on_init = true
  host_metric_exclude = ["*"] # Exclude realtime metrics
  vm_metric_exclude = ["*"] # Exclude realtime metrics

  max_query_metrics = 256
  collect_concurrency = 3
  metric_lookback = 8
As a result, once I have enabled it and restarted the telegraf service, we have the following, we see that I had nothing before, and suddenly Surprise!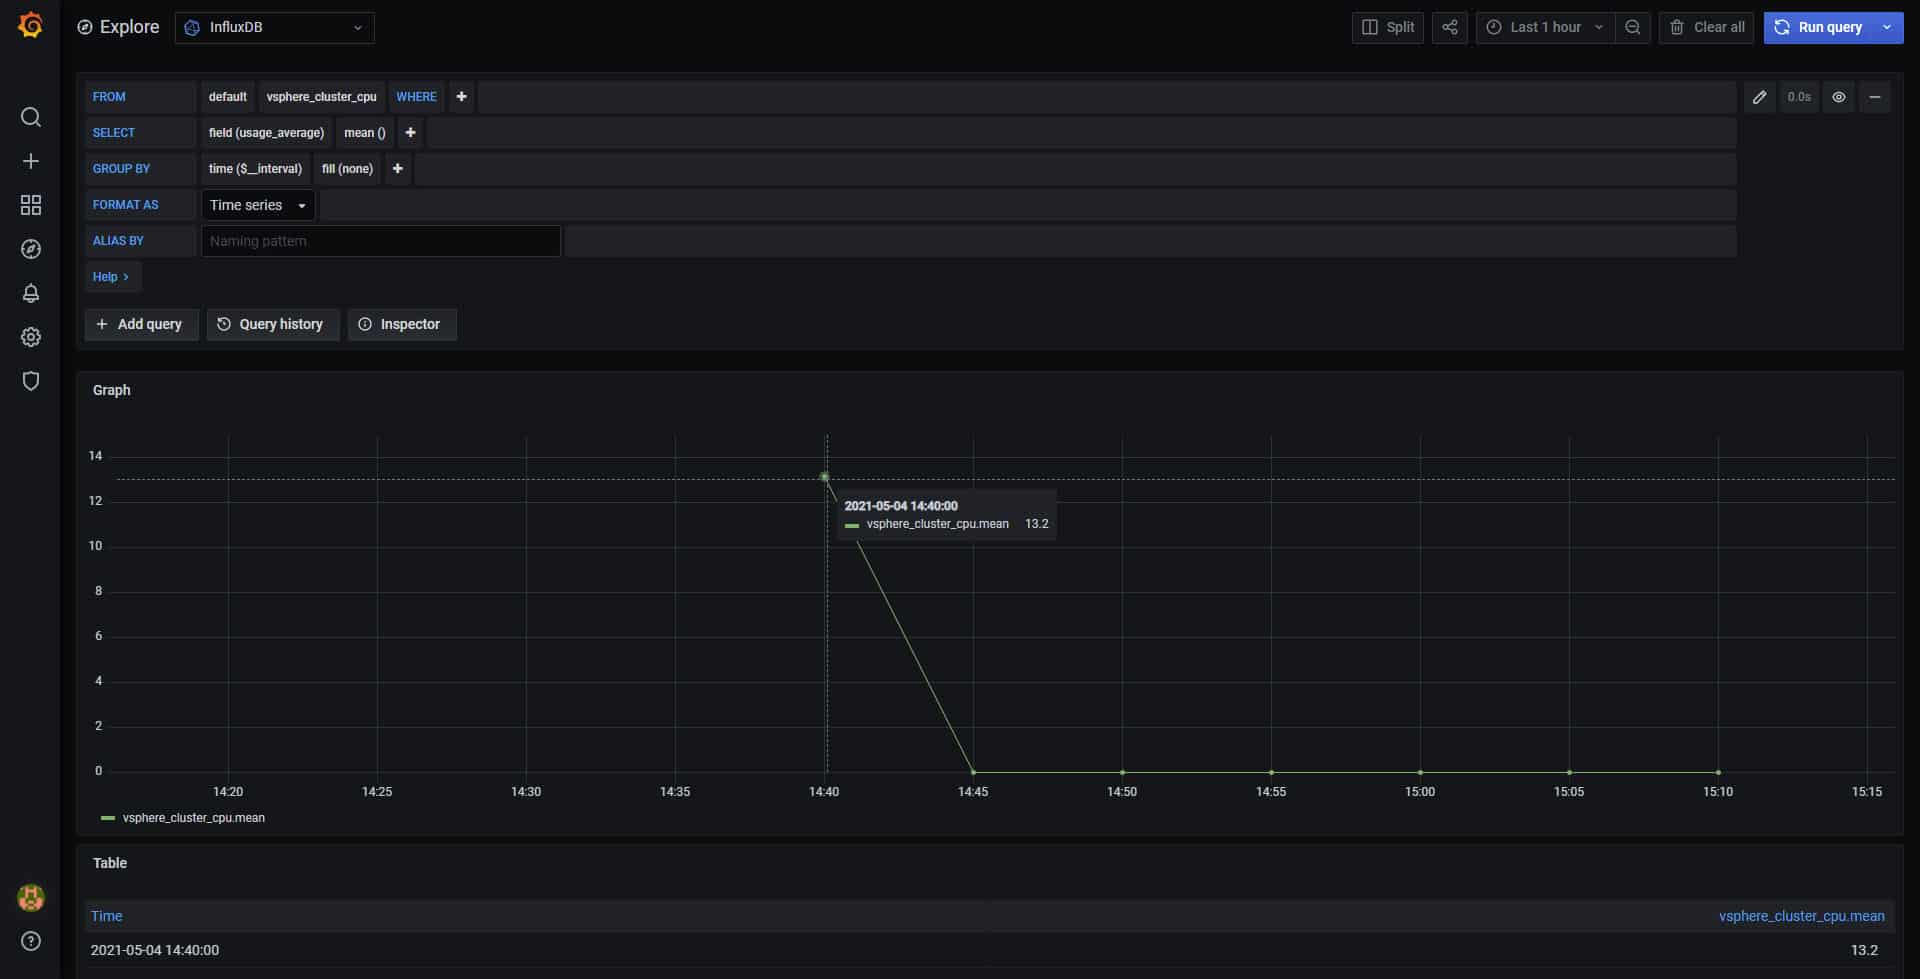
It works for cluster RAM metrics as well: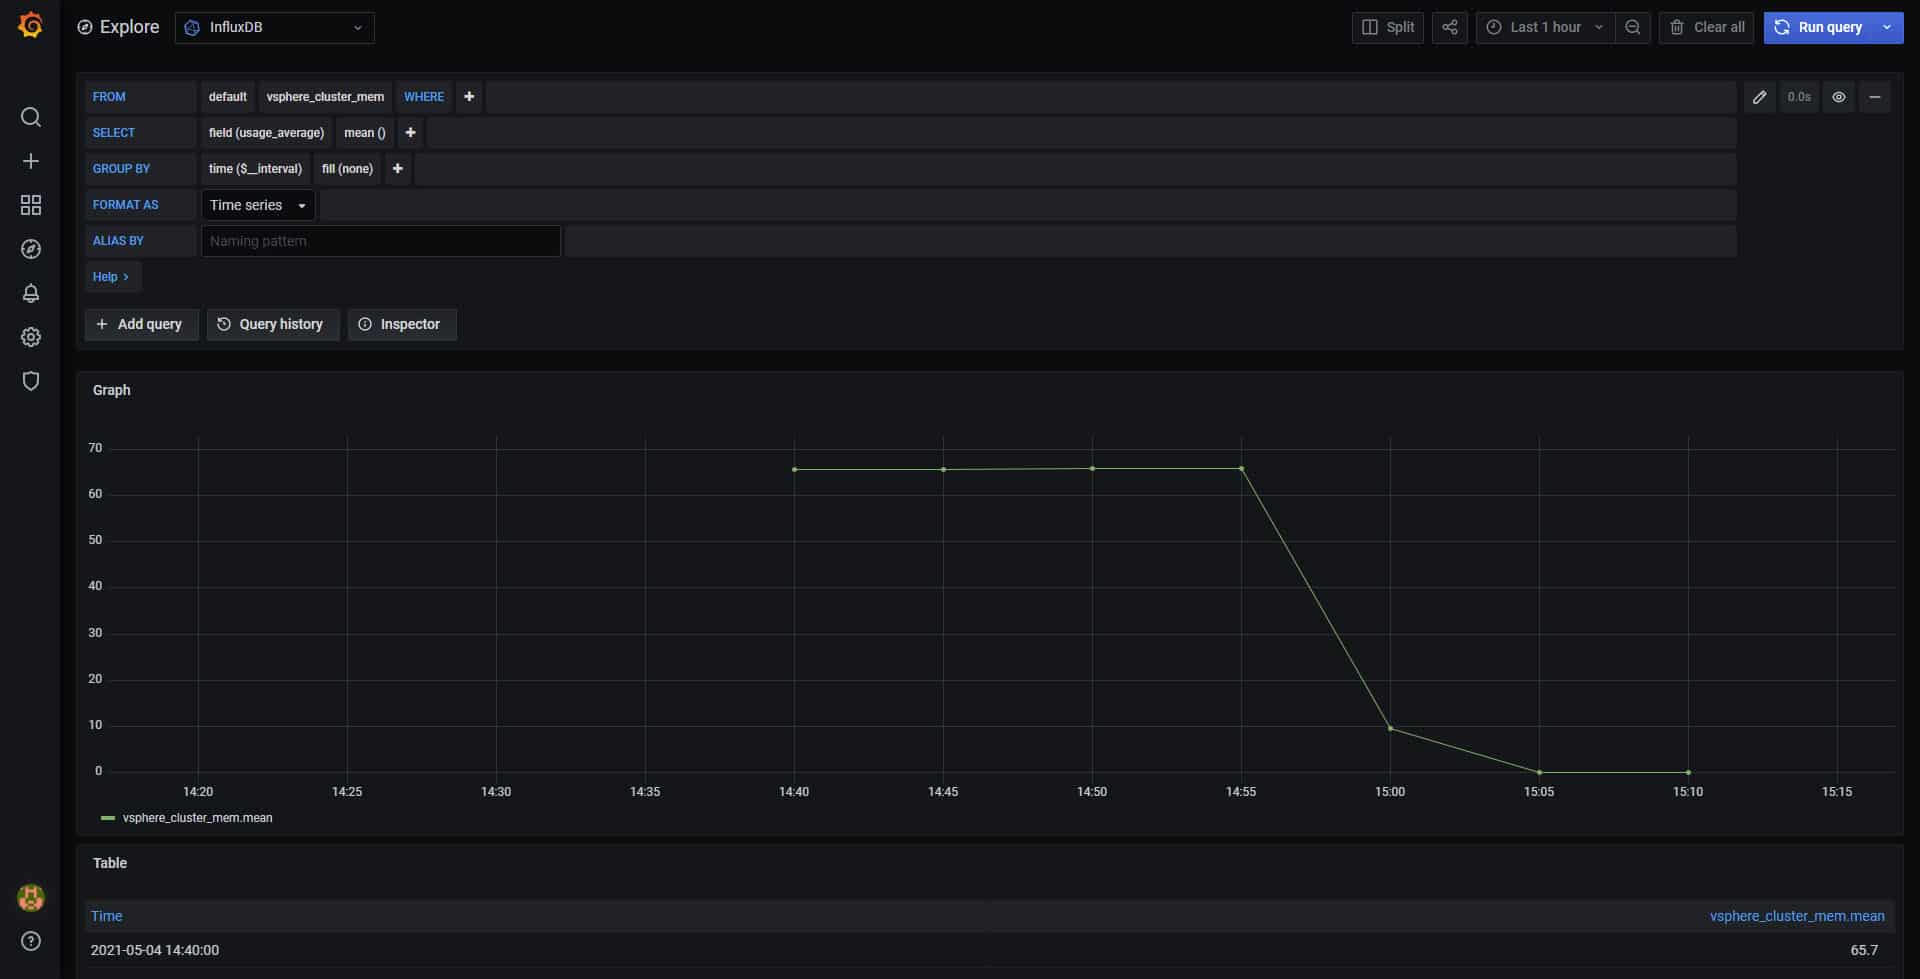
Nothing else folks, for now, I have not touched the official Dashboard, as I am observing how these metrics behave, plus I think using the average of the hosts, etc. We get more accurate details, and with better intervals than every 5 minutes (or 40) that this workaround offers, but it’s good to have it. I’ll keep you posted.
Leave a Reply