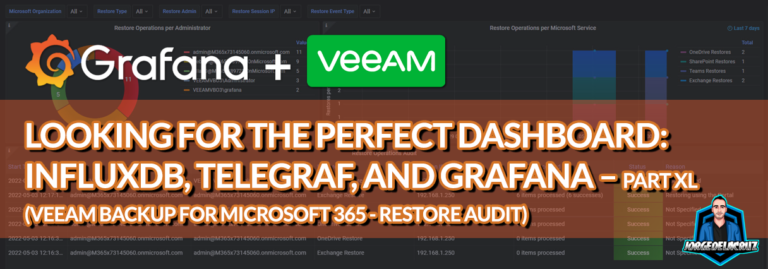
Greetings friends, before we jump into the blog post, I want to personally thank you for being here with me along with these 40 Blog Post series! Absolutely insane number of blogs regarding one topic, Observability, so the only thing I hope is that you have been enjoying them as much as I enjoyed writing them. In the previous blog post, I wrote
grafana veeam
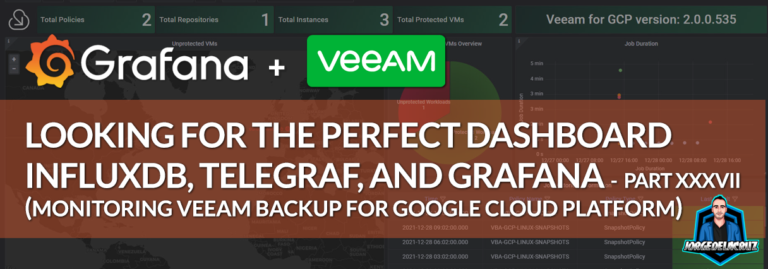
Looking for the Perfect Dashboard: InfluxDB, Telegraf, and Grafana – Part XXXVII (Monitoring Veeam Backup for Google Cloud Platform)
Greetings friends, before 2021 ended, I spent a few hours digging on Veeam Backup for Google Cloud Platform API. After a few hours, I was able to finally build the last Veeam Dashboard to complete the gauntlet: Every single Veeam product that has reached GA, and included an API, have now a dedicated Grafana Dashboard. But, why all of this hard
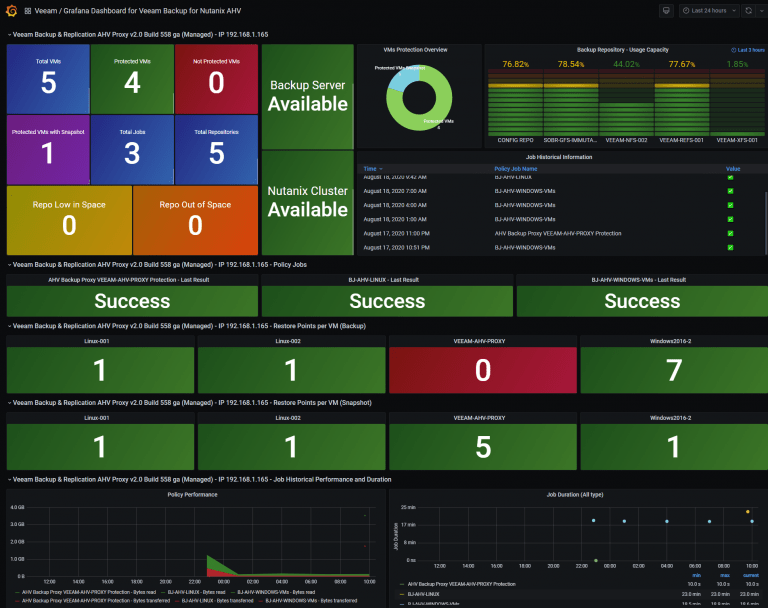
Looking for the Perfect Dashboard: InfluxDB, Telegraf and Grafana – Part XXVI (Monitoring Veeam Backup for Nutanix)
Greetings friends, since a few years ago, Veeam has native protection for workloads in Nutanix Acropolis, I told you how to deploy the Proxy and configure jobs, also the article contained the new report of Veeam ONE. But it is true that the monitoring of jobs, restore points, etc. in Veeam ONE can not include as much information as we need, so I


