
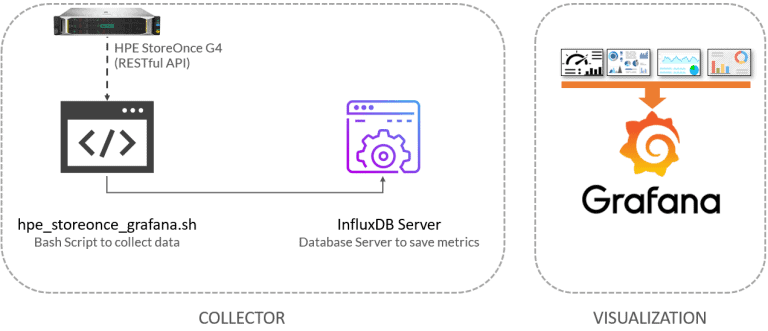
Greetings friends, a new week is a week with a new dashboard, this is so, I would like to be able to offer you many more use cases, with many other technologies, but time is very limited and I only have some nights to prepare this. Today we are going to see a very interesting topic, I was talking about HPE StoreOnce in previous posts, so as you
grafana
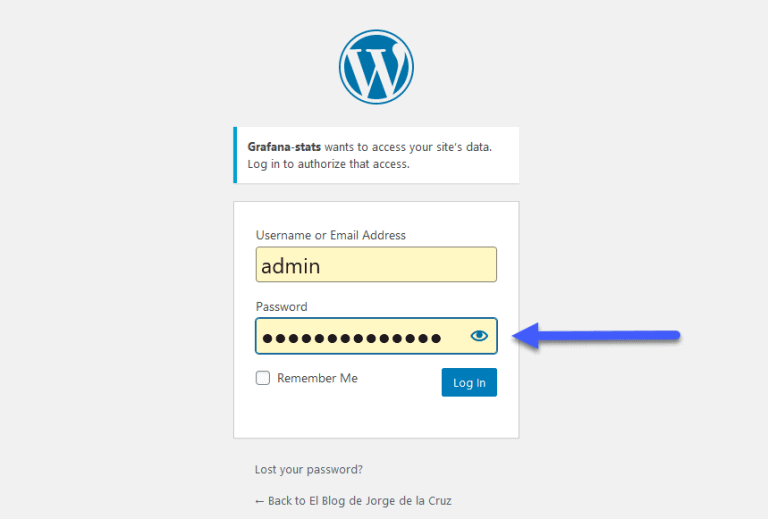
Looking for the Perfect Dashboard: InfluxDB, Telegraf, and Grafana – Part XXIII (Monitoring WordPress with Jetpack RESTful API)
Greetings friends, since 2016 I have been showing you how to get the Perfect Dashboard using Grafana, InfluxDB, and Telegraf, we have come a long way together, and we have seen how to monitor a myriad of critical components, such as SSL, web page responses, VMware vSphere, Veeam, and much more. The other day I was telling you how to extract the
Looking for the Perfect Dashboard: InfluxDB, Telegraf, and Grafana – Part XXII (Monitoring Cloudflare, include beautiful Maps)
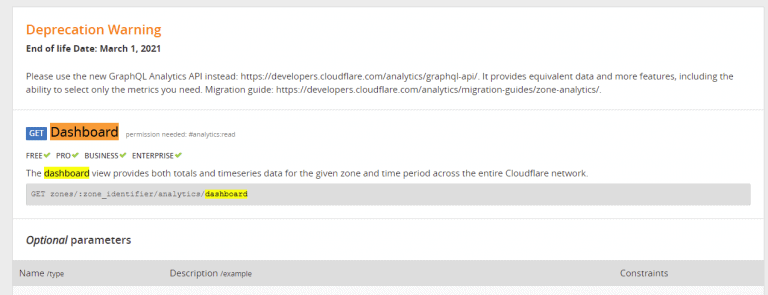
Greetings friends, since 2016 I have been showing you how to get the Perfect Dashboard using Grafana, InfluxDB, and Telegraf, we have come a long way together, and we have seen how to monitor a myriad of critical components, such as SSL, web page responses, VMware vSphere, Veeam, and much, much more. Today we return to the basics, exploring some
Looking for the perfect Dashboard: InfluxDB, Telegraf, and Grafana – Part XX (Monitoring SSL Certificates x.509)
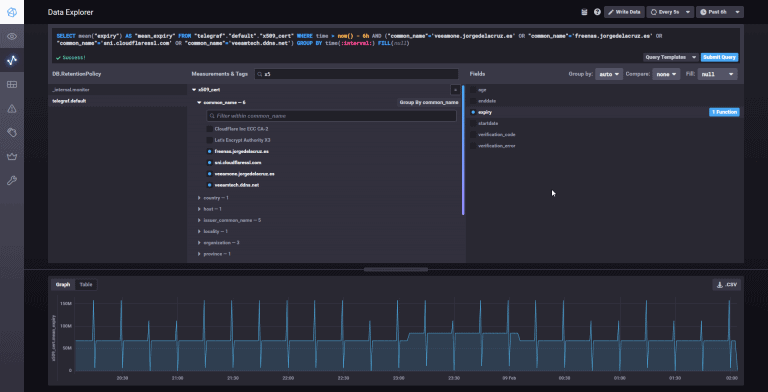
Greetings friends, during these last years we have seen how to monitor all kinds of services with Grafana, InfluxDB, and Telegraf, such as VMware vSphere, Linux, Windows, Veeam and more. Today I bring you one of these entries that are extremely useful and simple at the same time. I'm talking about how to monitor your SSL certificates, yours or
VMware: How to achieve a perfect metric collection interval with Telegraf, InfluxDB and Grafana
Greetings friends, I have told you in the past how to monitor your VMware environment using InfluxDB, Telegraf, and Grafana, and according to Grafana's dashboard, you are using it with about 4300 people in your Datacenters. All this is great, and I thank you very much for all the support and that so many people have the solution deployed. Now, I