
Greetings friends, I bring you a new entry about Grafana and Veeam, which I'm sure you'll like and put in your labs. Back in 2017 I told you how they monitor Veeam using the PowerShell CMDlets and also how to do it using PowerShell and Enterprise Manager RESTful API. These entries have had tens of thousands of hits, but they were more of a proof of
grafana
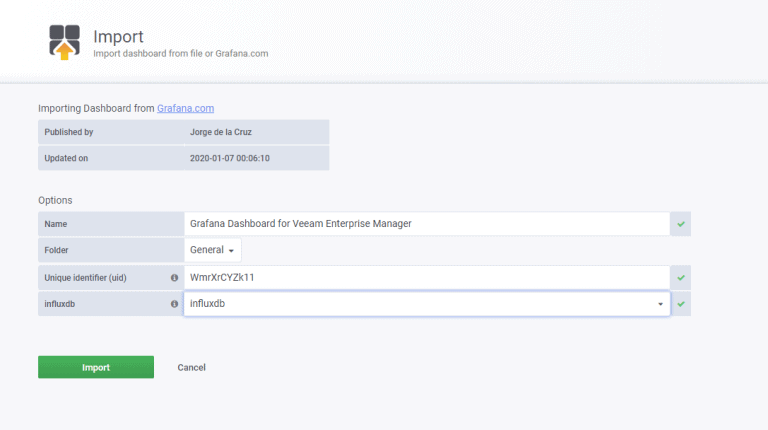
Looking for the Perfect Dashboard: InfluxDB, Telegraf and Grafana – Part XIII – Veeam Backup for Microsoft Office 365
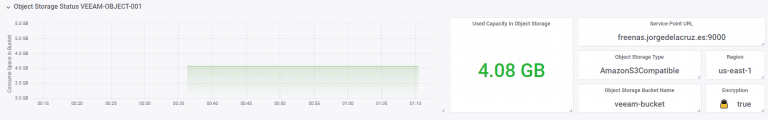
Greetings friends, almost a year ago I launched the Dashboard for Veeam Backup for Microsoft Office 365, in that case, it was the Dashboard for the product v3. With the arrival of the new version of Veeam Backup for Microsoft Office 365 v4, the time has come to update the Dashboard too. I have told you on numerous occasions all the advantages that
Grafana: Using Microsoft Teams for our notifications when established thresholds are exceeded
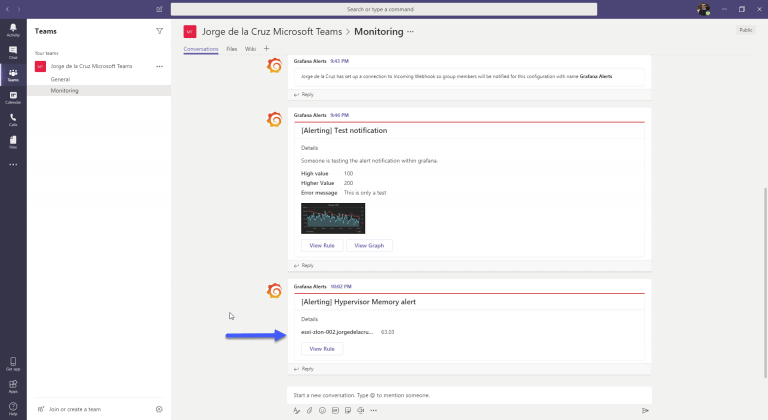
Greetings friends, after so many years counting all the possibilities Grafana, InfluxDB and Telegraf, I have come to realize that we have never dealt with the subject of notifications, so that Grafana alerts us when a value exceeds a certain threshold. Grafana has several methods of sending notifications, Email, Slack and many others that you
Grafana: Using Microsoft Office 365 for our email notifications
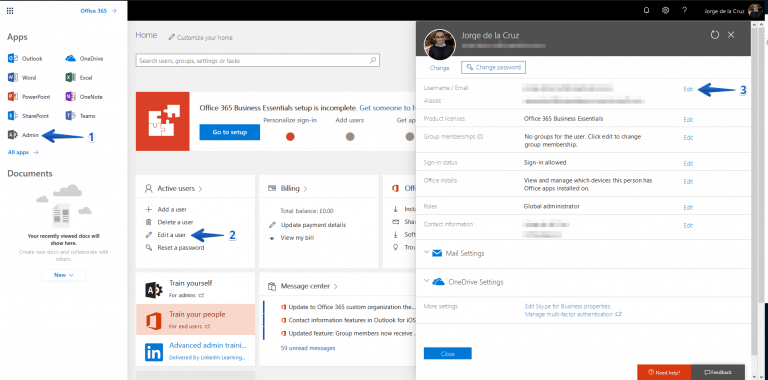
Greetings friends, after so many years counting all the possibilities Grafana, InfluxDB and Telegraf, I have come to realize that we have never dealt with the subject of notifications, so that Grafana alerts us when a value exceeds a certain threshold. Grafana has several methods of sending notifications, Email, Slack and many others that you
Looking for the Perfect Dashboard: InfluxDB, Telegraf and Grafana – Part XVII – Showing Dashboards on Two Monitors Using Raspberry Pi 4
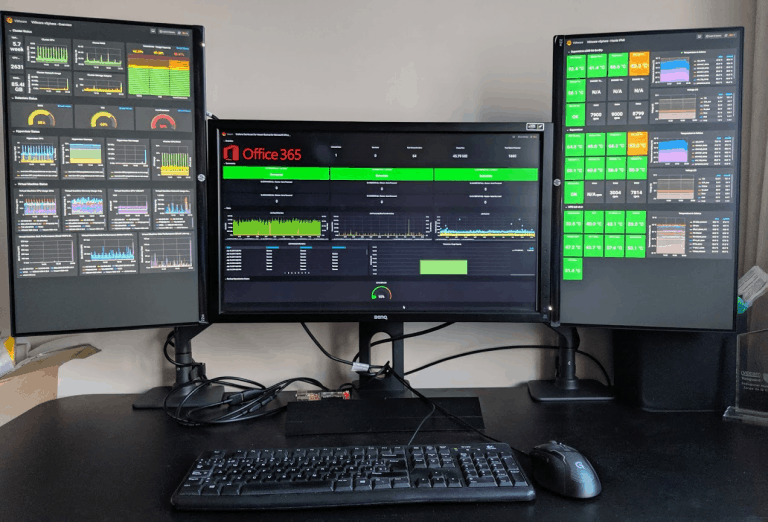
Greetings friends, I have been telling you throughout the series on Grafana many things, from how to monitor Linux, Windows, Veeam, VMware, and also the Server temperature using IPMI. Today I thought it convenient to show you the step by step to be able to visualize our Dashboards, if we have followed all the series will be already about 16