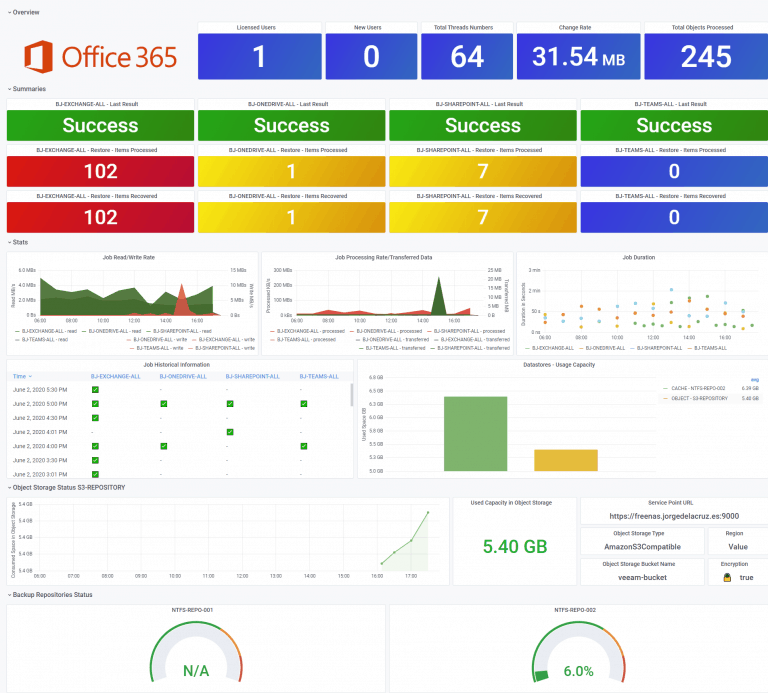
Greetings friends, almost a year ago I launched the Dashboard for Veeam Backup for Microsoft Office 365, in that case, it was the Dashboard for the product v3. With the arrival of the new version of Veeam Backup for Microsoft Office 365 v4, the time has come to update the Dashboard too. I have told you on numerous occasions all the advantages that
influxdb grafana
Looking for the Perfect Dashboard: InfluxDB, Telegraf and Grafana – Part XVII – Showing Dashboards on Two Monitors Using Raspberry Pi 4
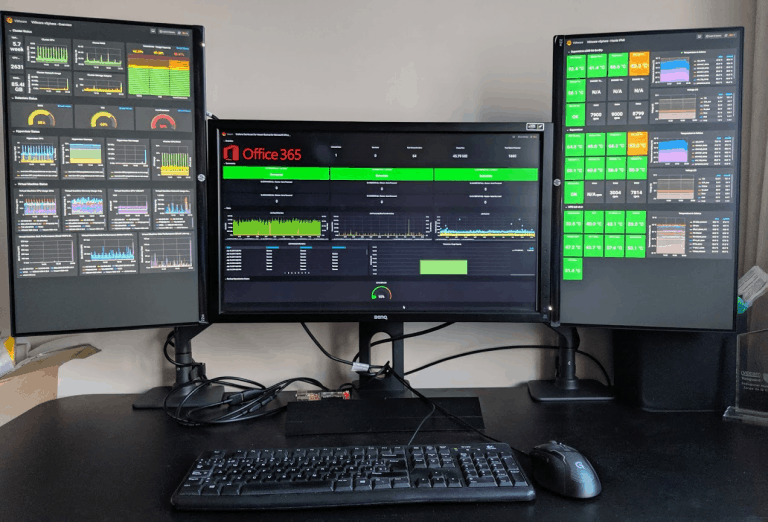
Greetings friends, I have been telling you throughout the series on Grafana many things, from how to monitor Linux, Windows, Veeam, VMware, and also the Server temperature using IPMI. Today I thought it convenient to show you the step by step to be able to visualize our Dashboards, if we have followed all the series will be already about 16
Looking for Perfect Dashboard: InfluxDB, Telegraf and Grafana – Part XVI – Performance and Advanced Security of Veeam Backup for Microsoft Office 365
Greetings friends, I come to the sixteenth post on InfluxDB, Telegraf and Grafana, you can find all the posts on InfluxDB, Telegraf and Grafana here. Today I bring you a new entry, in this case it is a Dashboard focused on advanced security when we use Veeam Backup for Microsoft Office 365. Veeam Backup for Microsoft Office 365 is in charge of
Looking for the Perfect Dashboard: InfluxDB, Telegraf and Grafana – Part XV – IPMI Monitoring of our ESXi Hosts
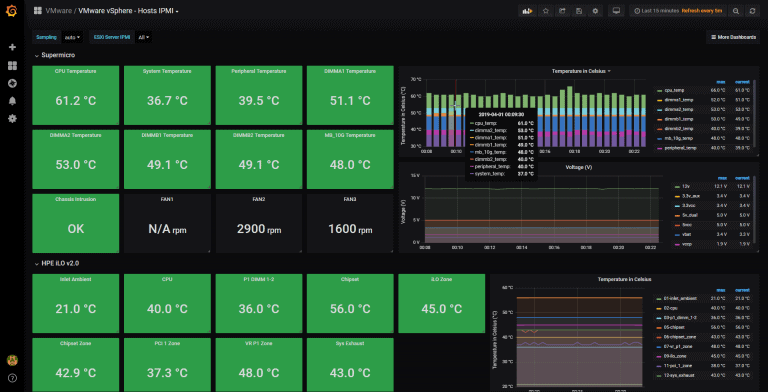
Greetings friends, we have spoken on numerous occasions about the power of InfluxDB, Telegraf and Grafana, if you remember not long ago I left you this fantastic post on how to monitor your vSphere for free and in less than 5 minutes: Looking for the Perfect Dashboard: InfluxDB, Telegraf and Grafana – Part XII (Native Telegraf Plugin for
Looking for the Perfect Dashboard: InfluxDB, Telegraf and Grafana – Part XIV – Veeam Availability Console
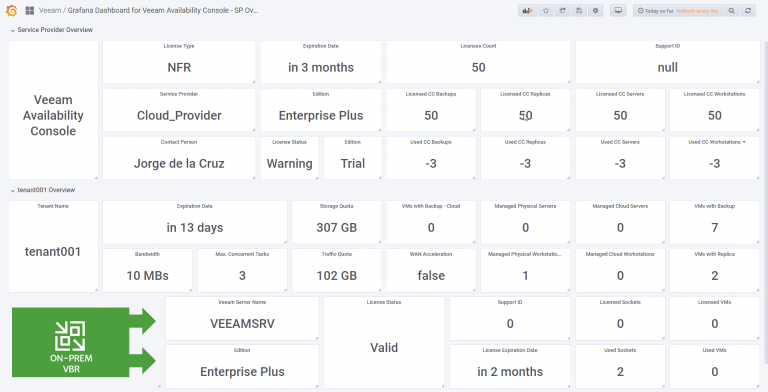
Greetings friends, I have already mentioned all the advantages that a monitoring and dashboarding system has. In fact, you can find all the entries about InfluxDB, Telegraf and Grafana here. Today I bring you a new entry focused on Service Providers of Veeam using Veeam Cloud Connect, in this case it’s a Dashboard that will increase the visibility


