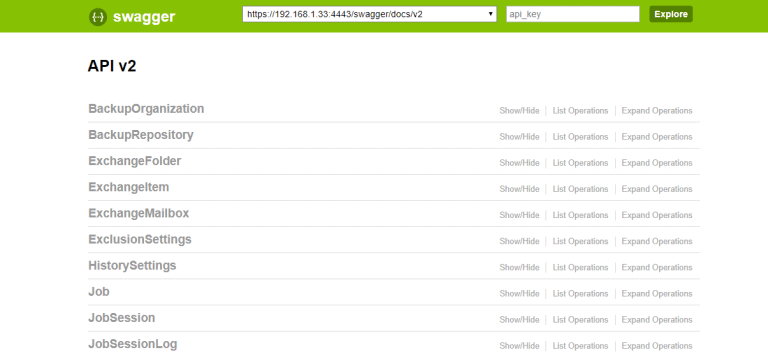
Greetings friends, I have told you on numerous occasions all the advantages that a monitoring and dashboarding system has. In fact, you can find all the entries about InfluxDB, Telegraf and Grafana here. Today I bring you a new entry, in this case it's a Dashboard that will come to you in luxury for your Veeam Backup for Microsoft Office 365 v2.0.
influxdb grafana
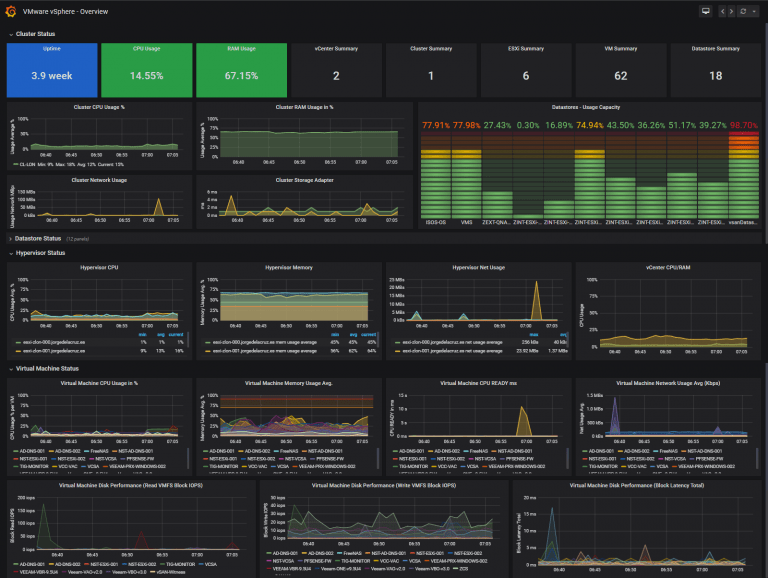
Looking for the Perfect Dashboard: InfluxDB, Telegraf and Grafana – Part XII (Native Telegraf Plugin for vSphere)
Greetings friends, today I bring you another one of those hidden gems that you like so much. In addition to being free and being able to display it in a few minutes, it has a potential that many commercial tools would like. Today we are about to create four fresh Grafana Dashboards within minutes, at the end of the blog, we can have some
Looking for the Perfect Dashboard: InfluxDB, Telegraf and Grafana – Part VIII (Monitoring Veeam using Veeam Enterprise Manager)
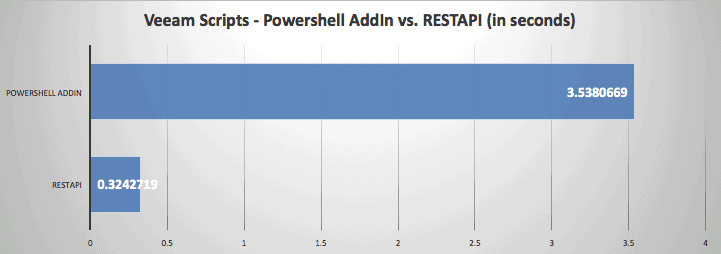
Hello everyone, in February of this year I wrote a script to monitor a Veeam Environment using the VeeamPSSnapIn, you can check it out on the Github page here. This post was a tremendous success, at even I had the chance to explain a bit more to the VeeamON participants, celebrated in New Orleans. But it has a minor shortcoming, it might run


