
 Greetings friends, I have told you on numerous occasions all the advantages that a monitoring and dashboarding system has. In fact, you can find all the entries about InfluxDB, Telegraf and Grafana here. Today I bring you a new entry, in this case it’s a Dashboard that will come to you in luxury for your Veeam Backup for Microsoft Office 365 v2.0. Veeam Backup for Microsoft Office 365 is in charge of protecting our elements in Office 365, be it all the mailboxes we have in Exchange Online, or SharePoint Online and even OneDrive for Business, I also leave you the entire category about this product (remember that there is a Community Edition with up to 10 free users, without paying anything).
Grafana Dashboard for Veeam Backup for Microsoft Office 365
How to Enable the RestAPI in Veeam Backup for Microsoft Office 365
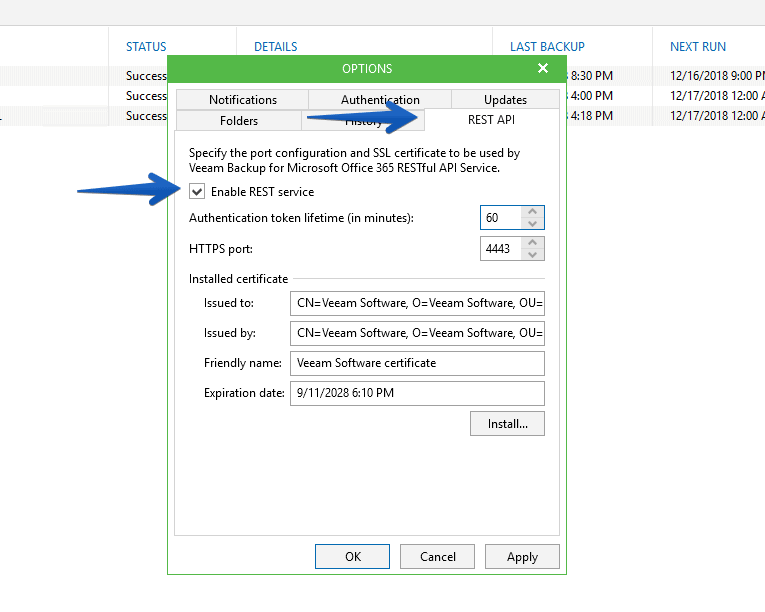
We’ll have to run several steps before we start downloading anything, or even touching Grafana, from our Veeam Backup for Microsoft Office 365, we’ll go in the Console to the menu icon, and then General Settings: 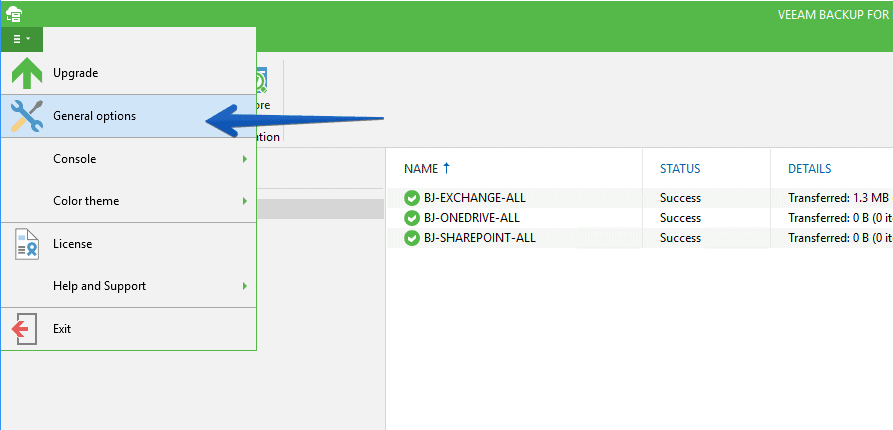 We will go to the sub-menu called REST API and enable the REST service, also here we could install our own SSL, and change the timeout of the tokens and the port of SSL, in my case I have not changed anything:
  With this we can go to our browser and explore the SWAGGER that Veeam Backup for Microsoft Office 365 brings as standard, we will find it at https://VBOURL:4443/swagger and must look like this:
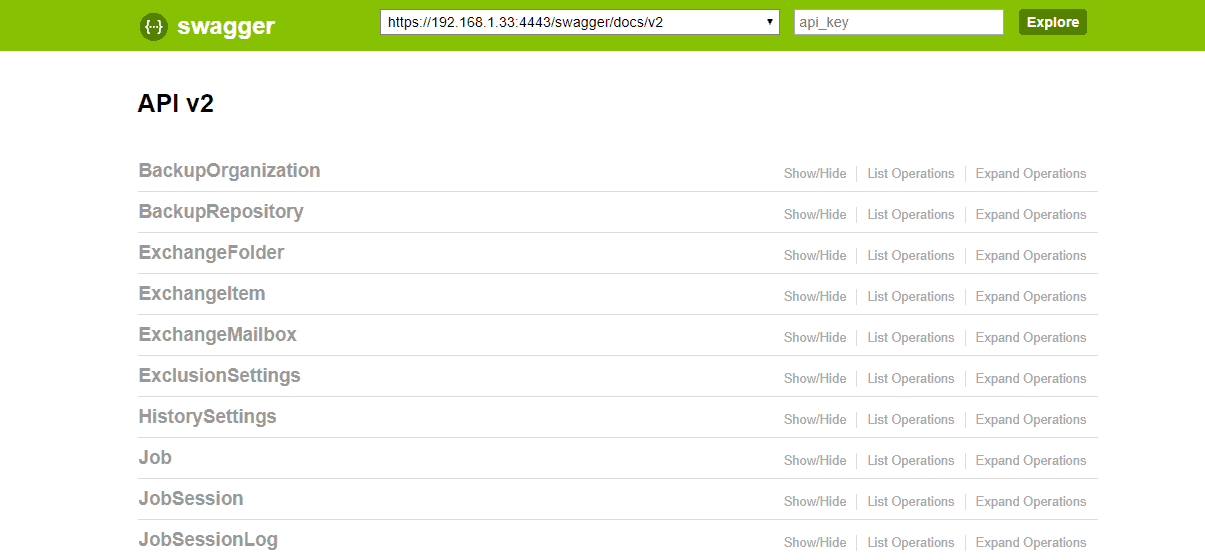 Now with this we are ready to continue towards the Perfect Dashboard for Veeam Backup for Microsoft Office 365.
Veeam Backup for Microsoft Office 365 RestAPI Script
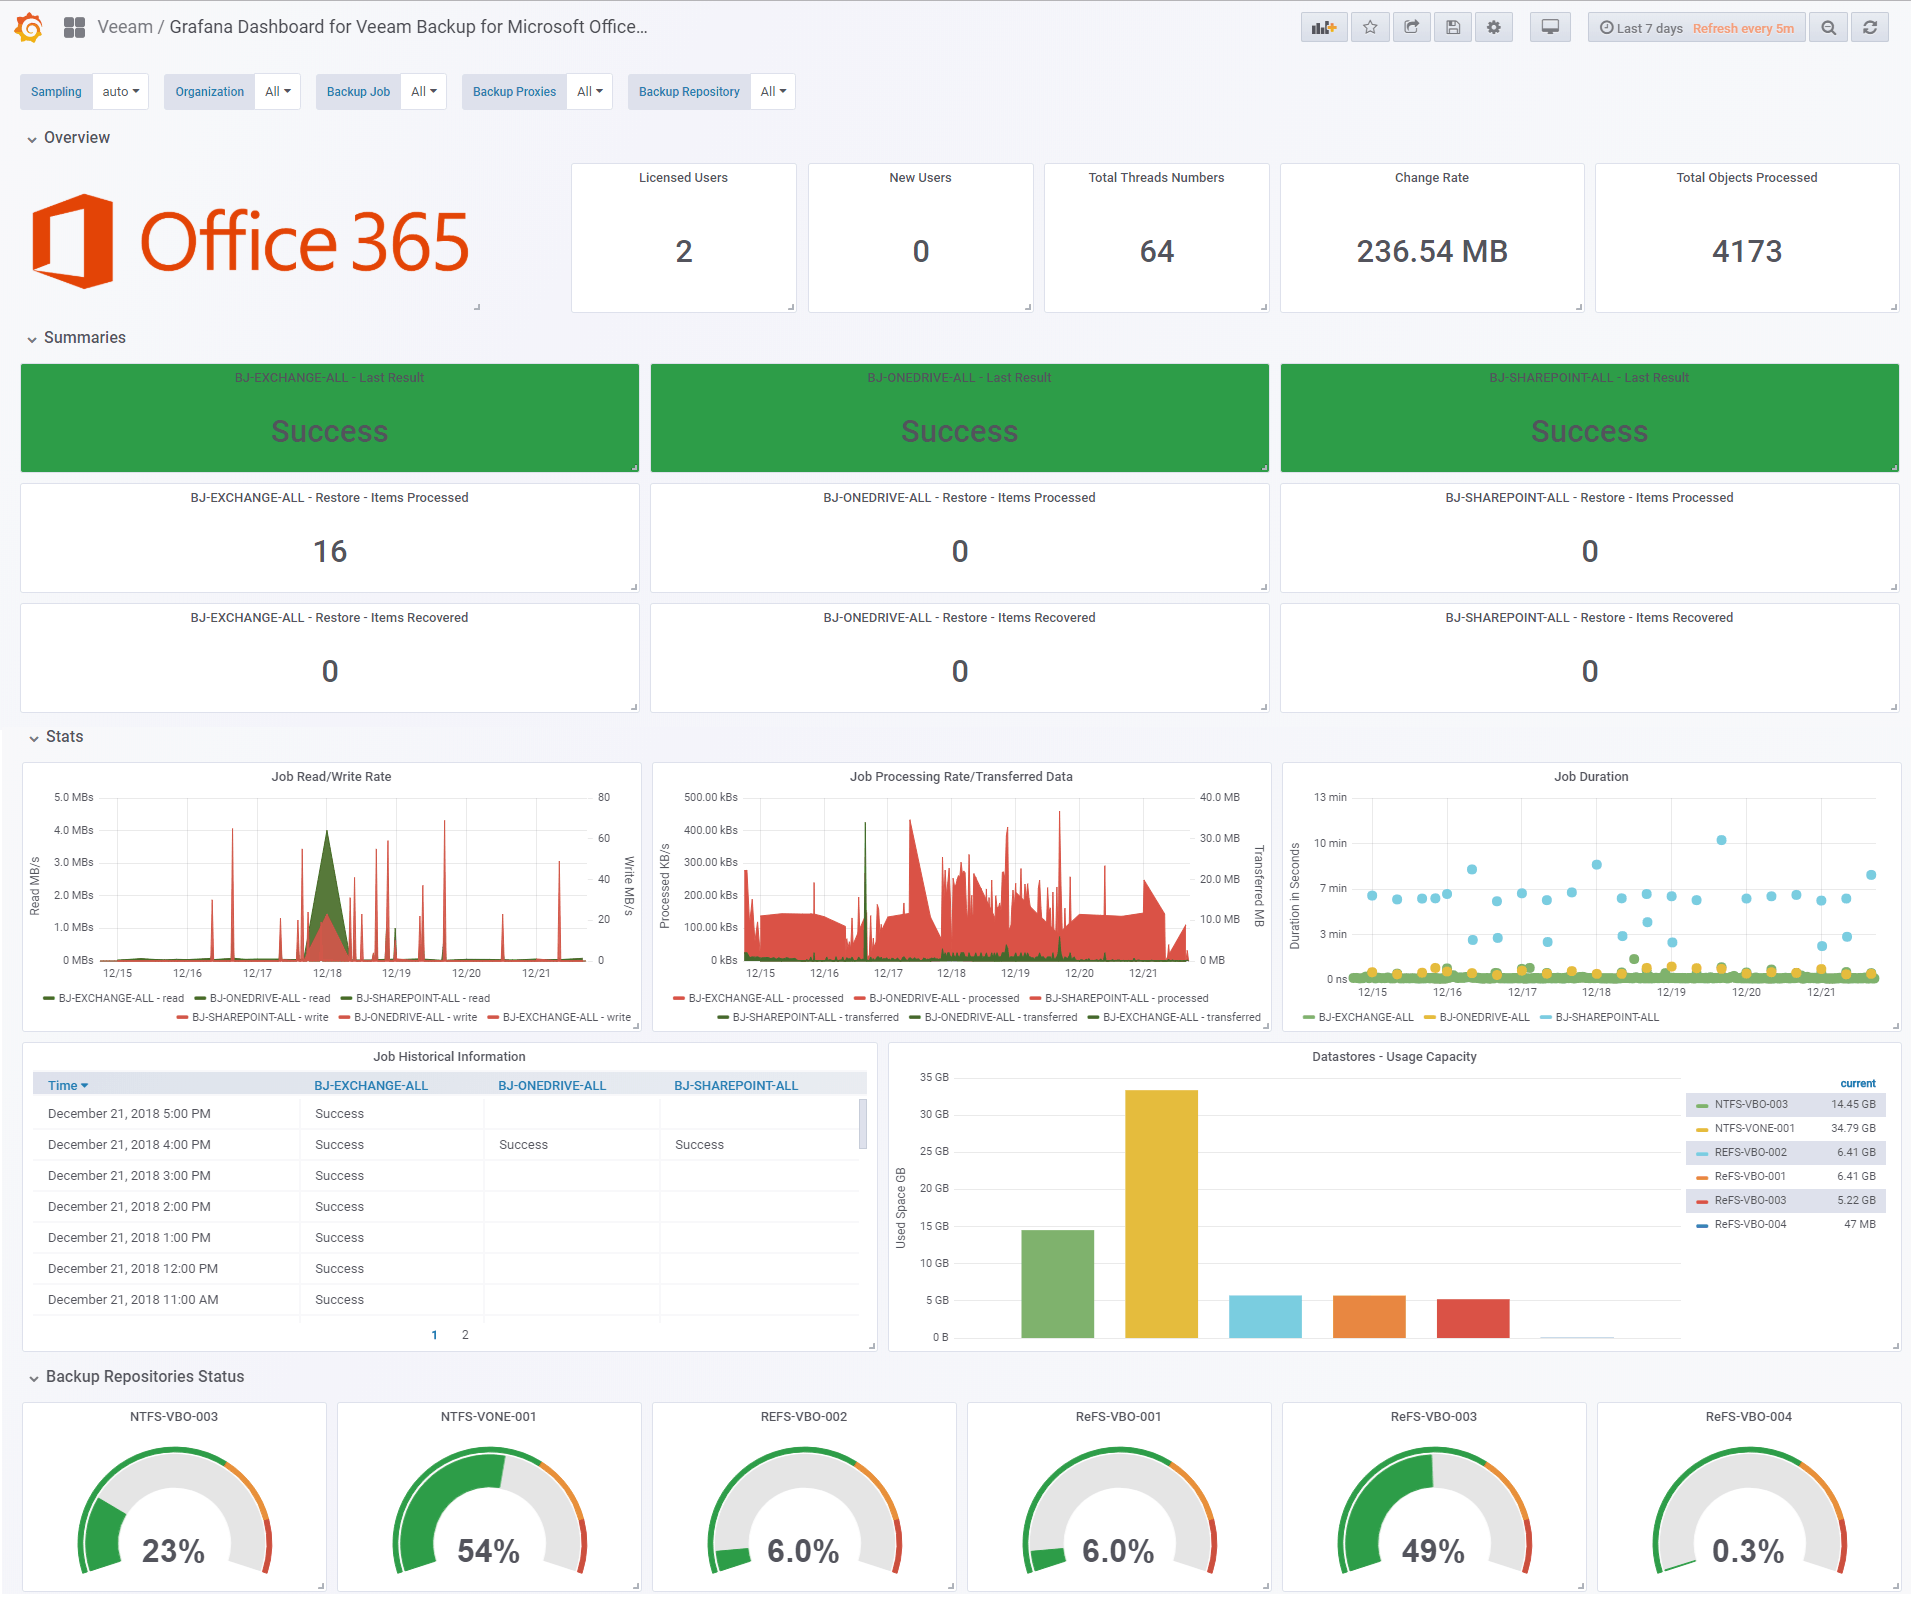
The script that can be downloaded directly from GitHub requires a brief configuration with certain parameters of our environments, but before we see this configuration, let’s see what this script gathers from RestAPI:
- Number of Licensed Users
- Number of new Users recently added to VBO
- Total number of threads of the Proxies
- Total number of objects processed in the backups
- Summary of the latest Backup status – by job
- Summary of the latest restoration – by job and by component
- Statistics on reading and writing in MB/s – per job
- Statistics on information processed in MB/s and data written in MB – per job
- Statistics on the time it has taken each Backup – per job
- Summary table with the status of each Backup – by job
- Summary table with the consumption of each Backup Repository
- Disk Capacity Meter for each Backup Repository
Once we download the script to our InfluxDB server, we’ll edit it and change the following:
##
# Configurations
##
# Endpoint URL for InfluxDB
veeamInfluxDBURL="TUIPDEINFLUXSERVER"
veeamInfluxDBPort="8086" #Default Port
veeamInfluxDB="telegraf" #Default Database

# Endpoint URL for login action
veeamUsername="TUUSERDEVBO"
veeamPassword="TUPASSDEVBO"
veeamRestServer="https://TUIPDEVBOSERVER"
veeamRestPort="4443" #Default Port
Once we edit these parameters, make the script executable:
chmod +x veeam_office365.sh
We will be able to execute it manually if we want to see what it does, we would have to observe an output like the next one repeated many times:
HTTP/1.1 204 No Content
Content-Type: application/json
Request-Id: 3565d5b6-011d-11e9-81c7-000000000000
X-Influxdb-Build: OSS
X-Influxdb-Version: 1.6.3
X-Request-Id: 3565d5b6-011d-11e9-81c7-000000000000
Date: Sun, 16 Dec 2018 10:27:37 GM
This is fine, and that’s what has to come out, now we have to program our script to launch automatically as often as we want, in my case every 30 minutes, we will use crontab -e to add it to cron, use your own path:
*/30 * * * * * /home/oper/veeam_office365.sh >> /var/log/veeamvbo.log 2>&1
Verifying that we are ingesting information with Chronograf
The normal thing at this point, if we have done all the steps well, is that we are already sending information compiled by the script to InfluxDB, if we do a search using the wonderful Chronograf, we can see that we have information: 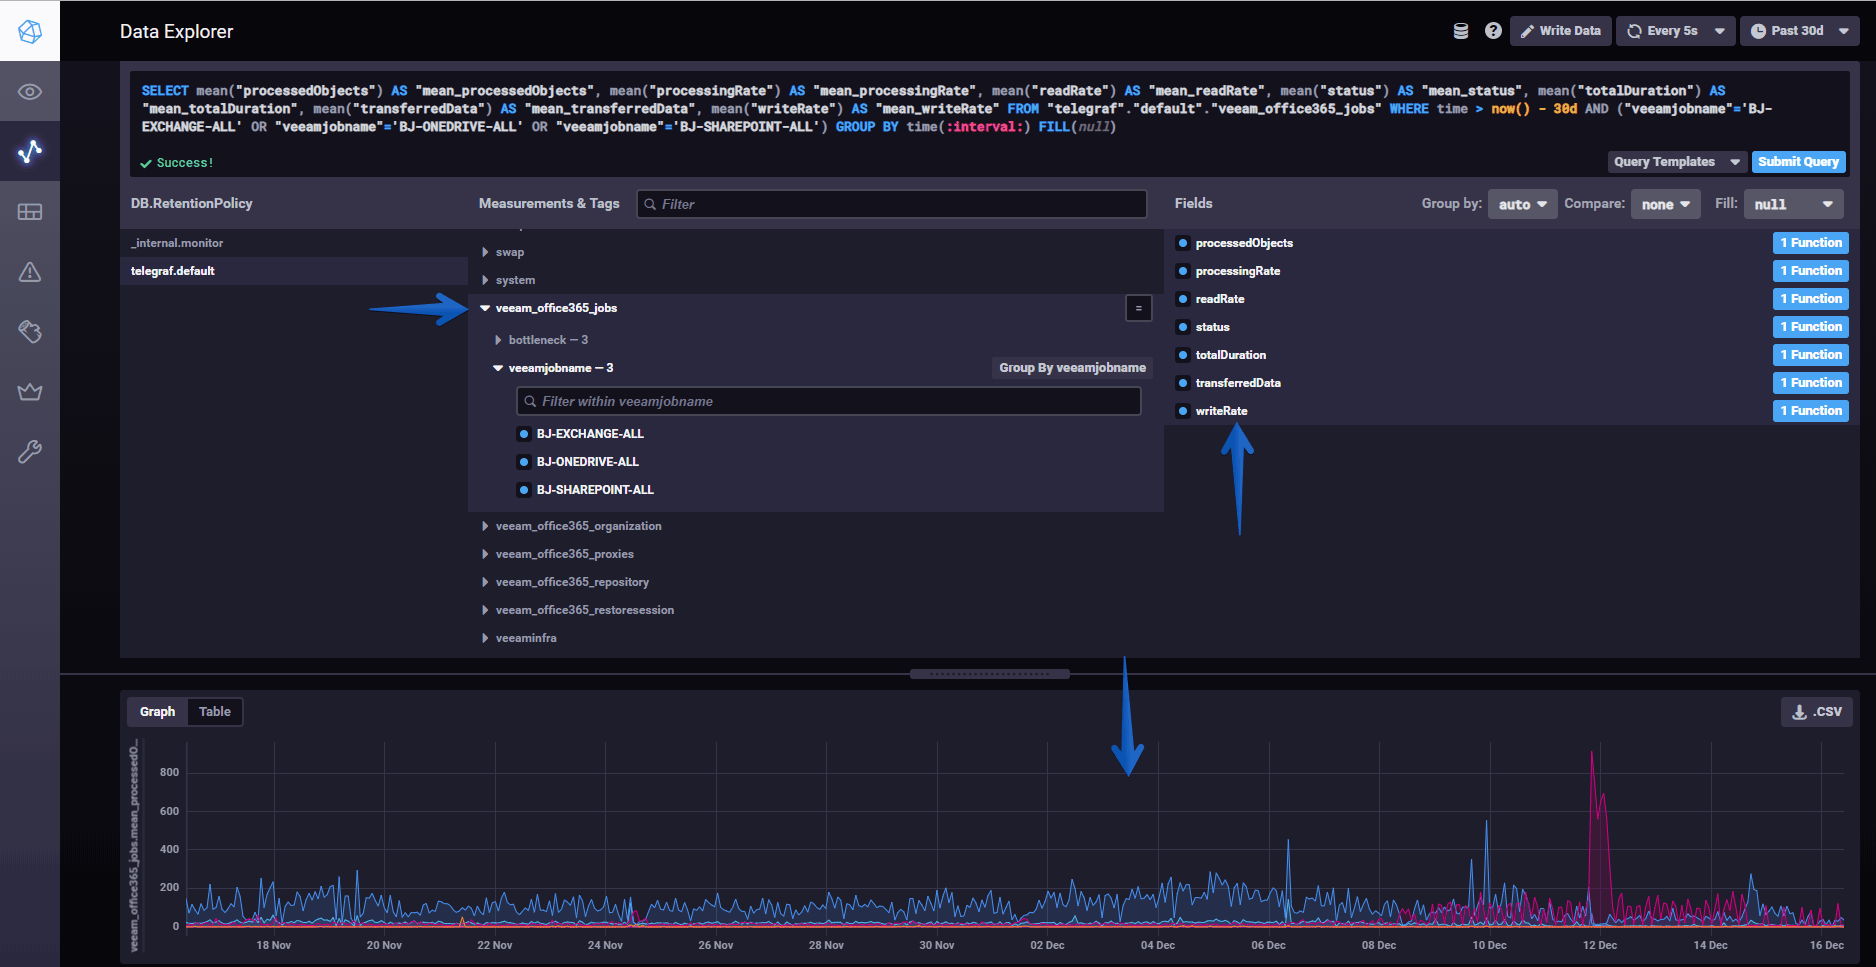 All the variables of this new Veeam script for VBO are stored in veeam_office365_* so it is really easy to find them.
Grafana Dashboards
I have created a Dashboard from scratch selecting the best requests to the database, finishing off colors, thinking what graphic and how to show it, and everything is automated so that it fits our environment without any problem and without having to edit anything manually. You can find the Dashboard here, once imported, you can use the top dropdown menus to select between organizations, backups, repositories and proxies:
How to Import easily the Grafana Dashboard
So that you don’t have to waste hours configuring a new Dashboard, and ingesting and debugging queries, I’ve already created four wonderful Dashboard with everything you need to monitor our environment in a very simple way, it will look like the image I showed you above.
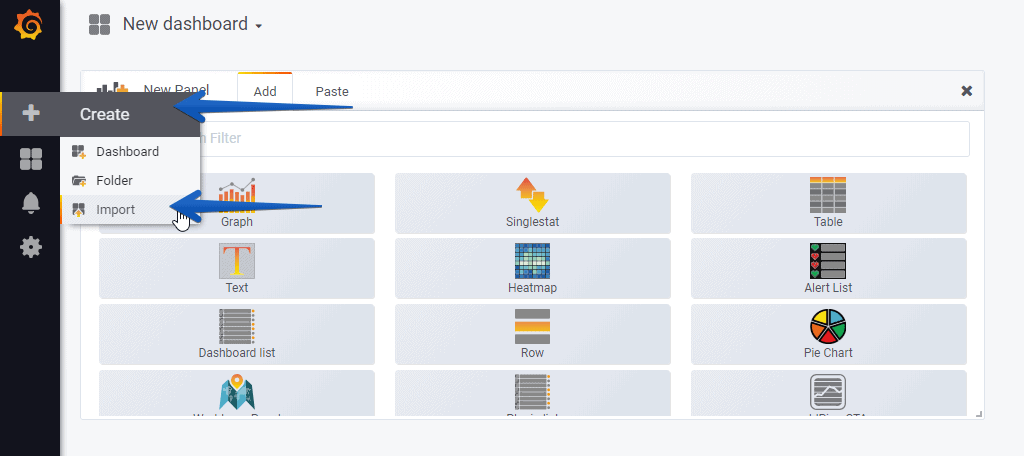
Select Create Dashboard – Import
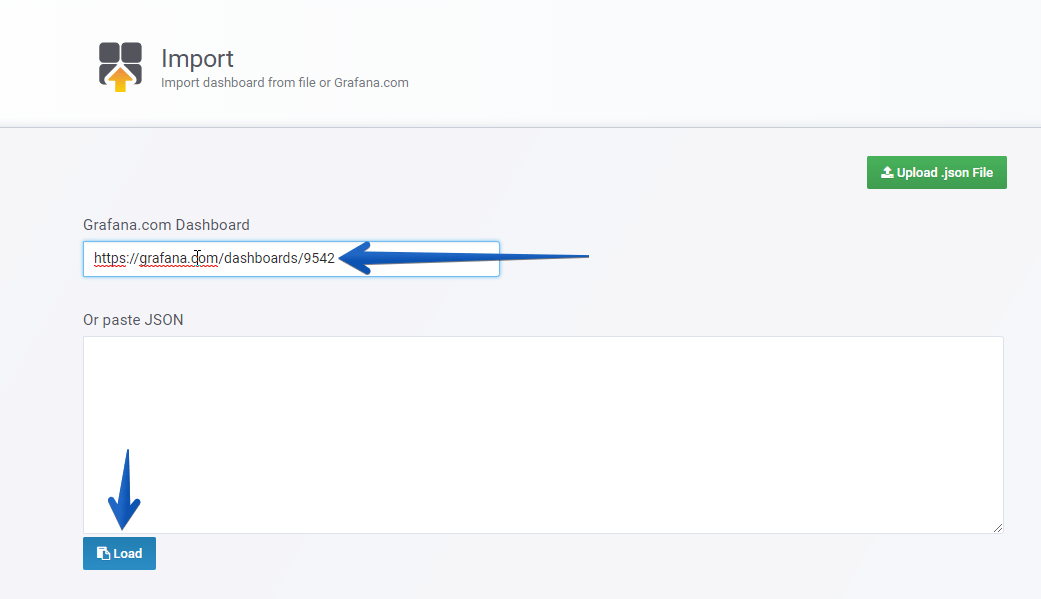
 Select the name you want and enter the ID: 9542, which is the unique ID of the Dashboard, or the URL:
 With the menus above you can deploy and adjust the Dashboard to your organization, backup jobs, and so on:
 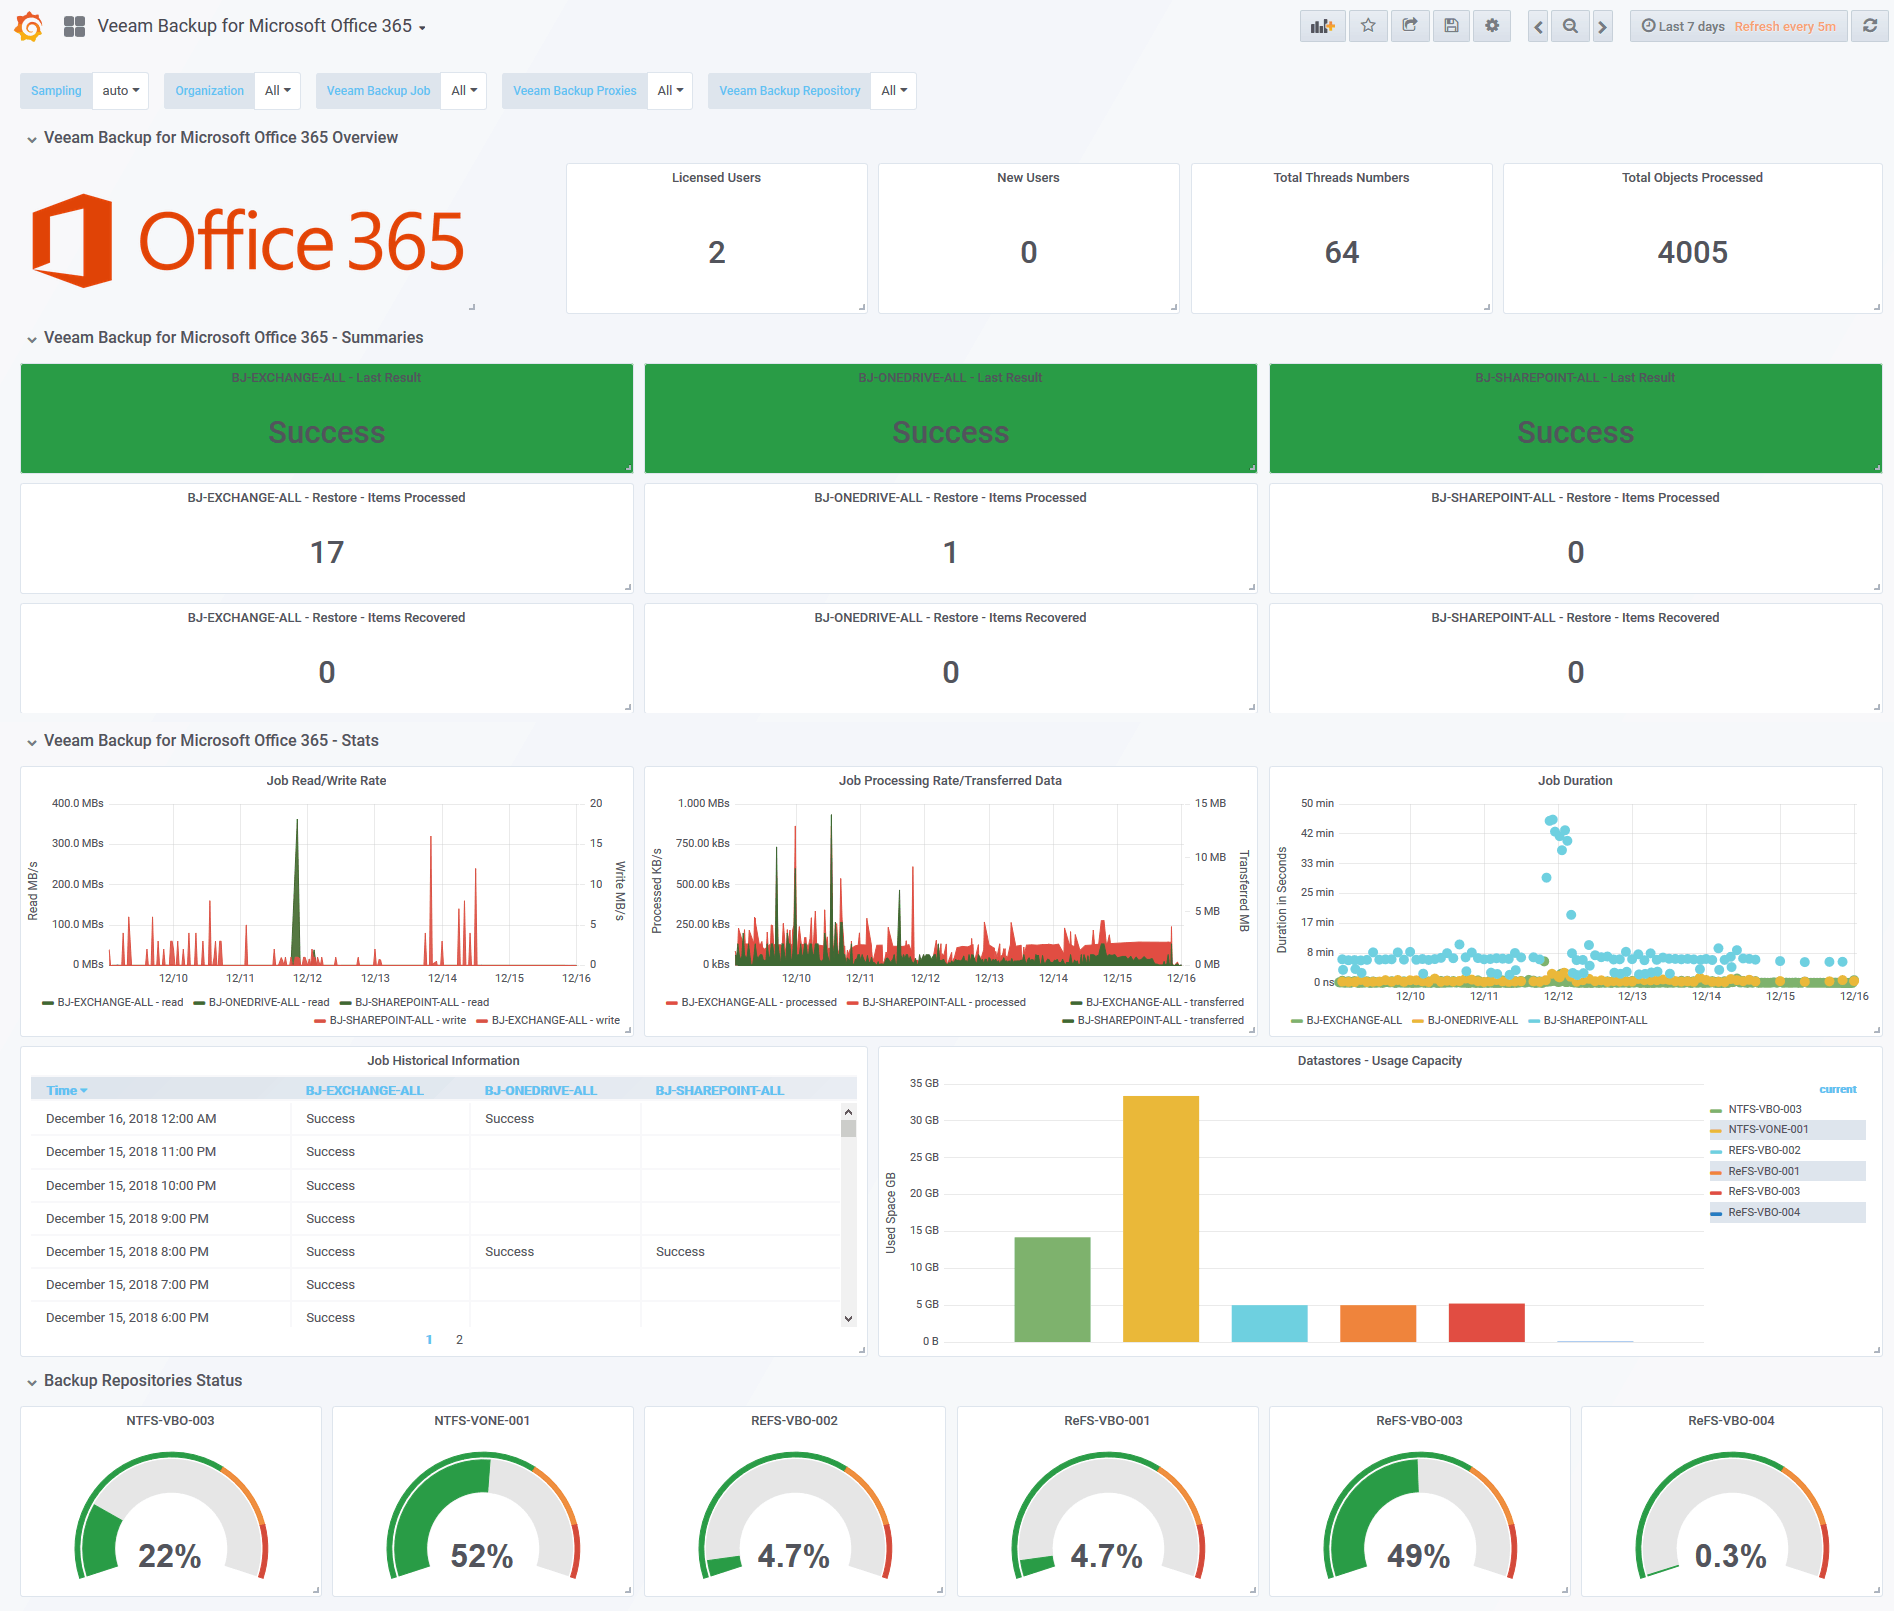 Please leave your feedback in the comments, or in GitHub. If you want to see them working without installing anything, here is the link to my environment:
That’s all folks, if you want to follow the full Blog series about Grafana, InfluxDB, Telegraf, please click on the next links:
- En busca del Dashboard perfecto: InfluxDB, Telegraf y Grafana – Parte I (Instalando InfluxDB, Telegraf y Grafana)
- En busca del Dashboard perfecto: InfluxDB, Telegraf y Grafana – Parte II (Instalar agente Telegraf en Nodos remotos Linux)
- En busca del Dashboard perfecto: InfluxDB, Telegraf y Grafana – Parte III Integración con PRTG
- En busca del Dashboard perfecto: InfluxDB, Telegraf y Grafana – Parte IV (Instalar agente Telegraf en Nodos remotos Windows)
- En busca del Dashboard perfecto: InfluxDB, Telegraf y Grafana – Parte V (Activar inputs específicos, Red, MySQL/MariaDB, Nginx)
- En busca del Dashboard perfecto: InfluxDB, Telegraf y Grafana – Parte VI (Monitorizando Veeam)
- En busca del Dashboard perfecto: InfluxDB, Telegraf y Grafana – Parte VII (Monitorizar vSphere)
- En busca del Dashboard perfecto: InfluxDB, Telegraf y Grafana – Parte VIII (Monitorizando Veeam con Enterprise Manager)
- En busca del Dashboard perfecto: InfluxDB, Telegraf y Grafana – Parte IX (Monitorizando Zimbra Collaboration)
- En busca del Dashboard perfecto: InfluxDB, Telegraf y Grafana – Parte X (Grafana Plugins)
- En busca del Dashboard perfecto: InfluxDB, Telegraf y Grafana – Parte XI
- Looking for the Perfect Dashboard: InfluxDB, Telegraf and Grafana – Part XII (Native Telegraf Plugin for vSphere)
./veeam_office365.sh: line 44: jq : command not found
Is someone facing the same issue?
Hello,
Please try to install it with yum install jq or apt-get install jq depending of your OS.
Thank you!
Hello,
What does “Change Rate” mean?
Thanks
Hello,
The Change rate it is built from the transferred data, meaning that is at the end the real data which you have transferred from O365 to your Veeam Backup on the specified time you select on the top right corner