• Skip to main content
  • Skip to secondary menu
  • Skip to primary sidebar
The Blog of Jorge de la Cruz

The Blog of Jorge de la Cruz

Everything about VMware, Veeam, InfluxData, Grafana, Zimbra, etc.

  • Home
  • VMWARE
  • VEEAM
    • Veeam Content Recap 2021
    • Veeam v11a
      • Veeam Backup and Replication v11a
    • Veeam Backup for AWS
      • Veeam Backup for AWS v4
    • Veeam Backup for Azure
      • Veeam Backup for Azure v3
    • VeeamON 2021
      • Veeam Announces Support for Red Hat Enterprise Virtualization (RHEV/KVM)
      • Veeam announces enhancements for new versions of Veeam Backup for AWS v4/Azure v3/GVP v2
      • VBO v6 – Self-Service Portal and Native Integration with Azure Archive and AWS S3 Glacier
  • Grafana
    • Part I (Installing InfluxDB, Telegraf and Grafana on Ubuntu 20.04 LTS)
    • Part VIII (Monitoring Veeam using Veeam Enterprise Manager)
    • Part XII (Native Telegraf Plugin for vSphere)
    • Part XIII – Veeam Backup for Microsoft Office 365 v4
    • Part XIV – Veeam Availability Console
    • Part XV – IPMI Monitoring of our ESXi Hosts
    • Part XVI – Performance and Advanced Security of Veeam Backup for Microsoft Office 365
    • Part XVII – Showing Dashboards on Two Monitors Using Raspberry Pi 4
    • Part XIX (Monitoring Veeam with Enterprise Manager) Shell Script
    • Part XXII (Monitoring Cloudflare, include beautiful Maps)
    • Part XXIII (Monitoring WordPress with Jetpack RESTful API)
    • Part XXIV (Monitoring Veeam Backup for Microsoft Azure)
    • Part XXV (Monitoring Power Consumption)
    • Part XXVI (Monitoring Veeam Backup for Nutanix)
    • Part XXVII (Monitoring ReFS and XFS (block-cloning and reflink)
    • Part XXVIII (Monitoring HPE StoreOnce)
    • Part XXIX (Monitoring Pi-hole)
    • Part XXXI (Monitoring Unifi Protect)
    • Part XXXII (Monitoring Veeam ONE – experimental)
    • Part XXXIII (Monitoring NetApp ONTAP)
    • Part XXXIV (Monitoring Runecast)
  • Nutanix
  • ZIMBRA
  • PRTG
  • LINUX
  • MICROSOFT

telegraf

Looking for the Perfect Dashboard: InfluxDB, Telegraf, and Grafana – Part XLVI (Monitoring NVIDIA Jetson Nano)

8th January 2025 - Written in: linux, opensource

Greetings friends, a few years ago I showed you how to monitor the CPU temperature using telegraf for a Raspberry Pi. I have recently purchased an exciting NVIDIA Jetson Nano and I wanted to monitor it as well, this device is a bit unique. I have used the RPi dashboard as inspiration, but this is an arm board with some unique GPU capabilities,

Continue Reading

Looking for the Perfect Dashboard: InfluxDB, Telegraf, and Grafana – Part XLV (Monitoring Synology using SNMP v3)

2nd January 2024 - Written in: opensource

Greetings friends, what an exciting blog I have the honour to start 2024 with. After the very successful dashboard for QNAP, using SNMP v3, I got tons of emails and feedback asking for the same but for Synology. Unfortunately I do not have any Synology Hardware, so I have user Virtual DSM to achieve this dashboard. We are going to use our

Continue Reading

Looking for the Perfect Dashboard: InfluxDB, Telegraf and Grafana – Part I (Installing InfluxDB, Telegraf and Grafana on Ubuntu 20.04 LTS)

14th April 2021 - Written in: opensource

Greetings friends, this post is special, as it is the updated article as of today with the necessary steps on how to install InfluxDB, Telegraf, and Grafana, on Ubuntu 20.04LTS, which we can find for x86 or ARM. You already know that with these steps, you can then jump to any of the other entries in the series, to monitor your VMware, Veeam,

Continue Reading

Looking for the Perfect Dashboard: InfluxDB, Telegraf, and Grafana – Part XXIX (Monitoring Pi-hole)

6th January 2021 - Written in: opensource

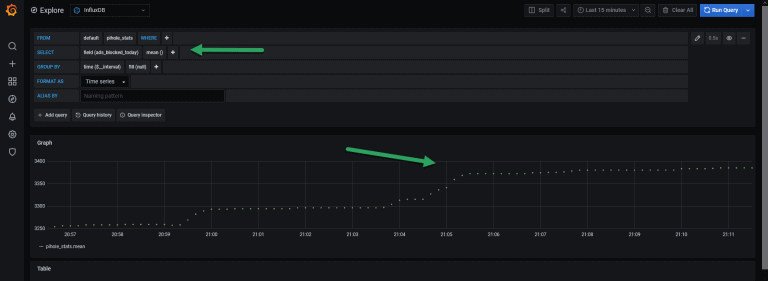
Greetings friends, it has been a while since I expanded the series of In Search of the Perfect Dashboard, but it has taken time to continue. Today I bring you a very interesting entry, which I really wanted to add to the series, it's about how to collect Pi-hole statistics. Once we finish all the steps, you should have a result similar to the

Continue Reading

VMware: How to solve the error with Telegraf and vSphere “Task Name: Remote View Manager, Status: The request refers to an unexpected or unknown type”

28th March 2019 - Written in: vmware

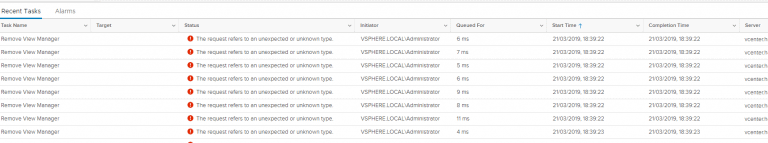
Greetings everyone, if you have followed this blog for quite some time, I am sure you have stopped by the blog entry about How to Monitor a vSphere Environment using Grafana, InfluxDB and telegraf. That blog post has tons of comments, and feedback from all of you around the Globe, which is great. Lately I've started receiving some comments about a

Continue Reading

Primary Sidebar

  • E-mail
  • GitHub
  • LinkedIn
  • RSS
  • Twitter
  • YouTube

Posts Calendar

May 2025
M T W T F S S
 1234
567891011
12131415161718
19202122232425
262728293031  
« Mar    

Disclaimer

All opinions expressed on this site are my own and do not represent the opinions of any company I have worked with, am working with, or will be working with.

Copyright © 2025 · The Blog of Jorge de la Cruz