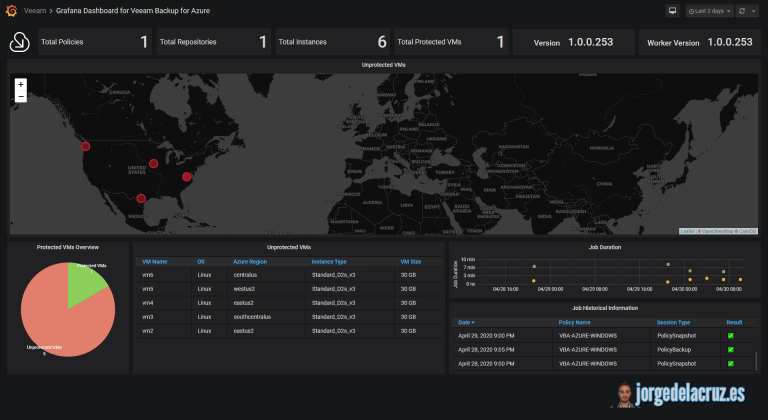
Greetings friends, I bring you a new entry about Grafana and Veeam, which I'm sure you'll like and put in your labs. Veeam has recently announced Veeam Backup for Microsoft Azure. Along the ton of functionalities that the product includes, one is a public RESTFul API, and I thought it could be a good idea to create a Dashboard for this
veeam monitor
Looking for the Perfect Dashboard: InfluxDB, Telegraf and Grafana – Part XIX (Monitoring Veeam with Enterprise Manager) Shell Script
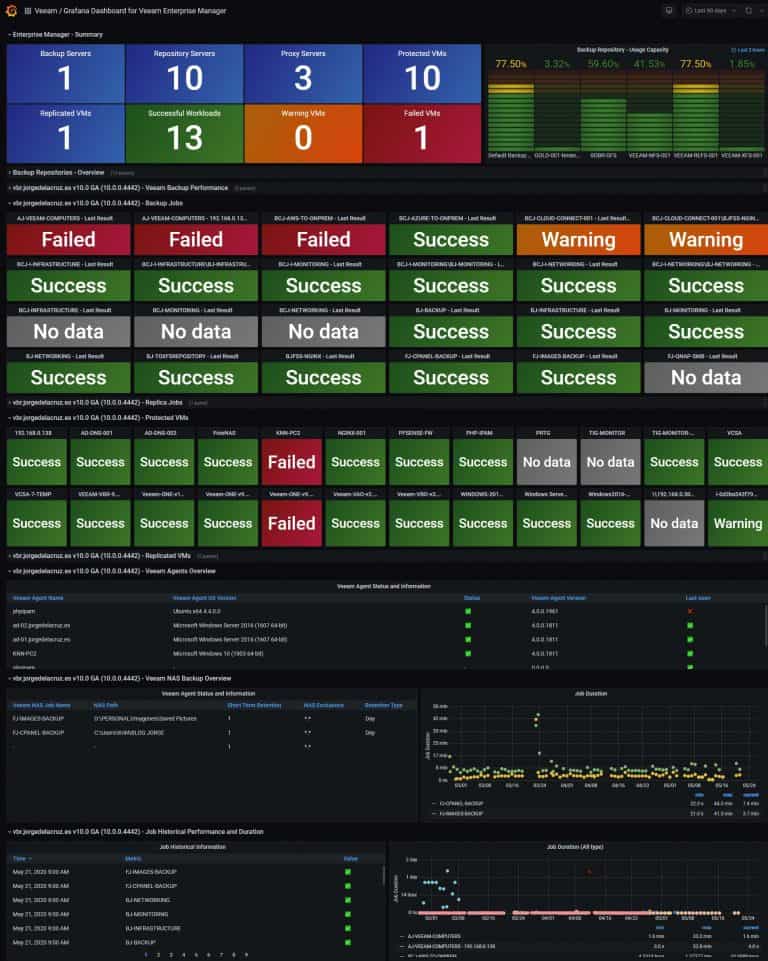
Greetings friends, I bring you a new entry about Grafana and Veeam, which I'm sure you'll like and put in your labs. Back in 2017 I told you how they monitor Veeam using the PowerShell CMDlets and also how to do it using PowerShell and Enterprise Manager RESTful API. These entries have had tens of thousands of hits, but they were more of a proof of
Veeam: How can Service Providers Monitor Veeam Cloud Connect services using Veeam ONE
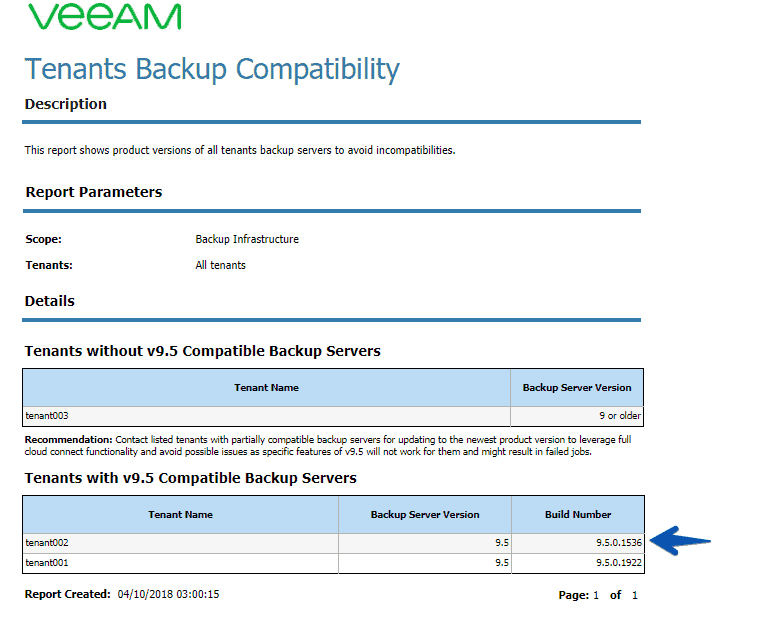
Greetings friends, long ago I told you about the benefits of Veeam Cloud Connect, and since then I know that there are many of you who have become one of them. At the same time I know the problems when monitoring the components, and the tenants in a precise way, that's why today I bring you this post to see how to monitor Veeam Cloud Connect with
Looking for the Perfect Dashboard: InfluxDB, Telegraf and Grafana – Part VIII (Monitoring Veeam using Veeam Enterprise Manager)
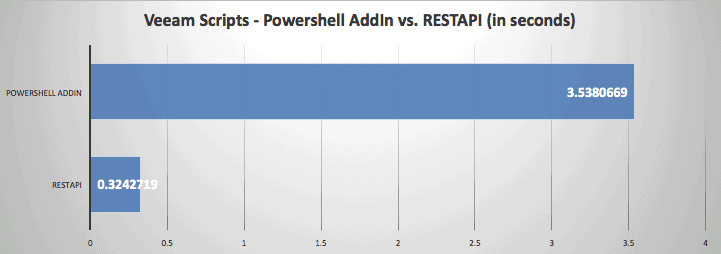
Hello everyone, in February of this year I wrote a script to monitor a Veeam Environment using the VeeamPSSnapIn, you can check it out on the Github page here. This post was a tremendous success, at even I had the chance to explain a bit more to the VeeamON participants, celebrated in New Orleans. But it has a minor shortcoming, it might run


