
Greetings friends, for many years, changing or adding an SSL certificate to our VMware vCenter has been a real pain, there are tens of KB, and hundreds of posts in the Community with errors of all kinds once you flirt with the steps. But from 6.7 onwards it seems that the process has been simplified a lot, so today I come to show you the steps to
vmware
VMware: How to achieve a perfect metric collection interval with Telegraf, InfluxDB and Grafana
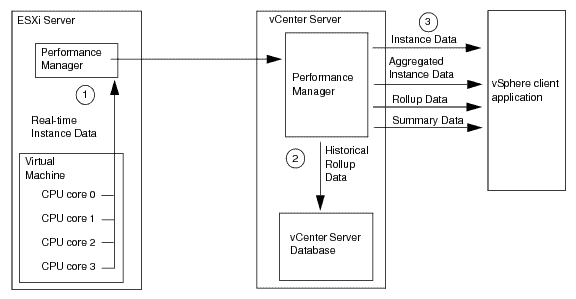
Greetings friends, I have told you in the past how to monitor your VMware environment using InfluxDB, Telegraf, and Grafana, and according to Grafana's dashboard, you are using it with about 4300 people in your Datacenters. All this is great, and I thank you very much for all the support and that so many people have the solution deployed. Now, I
Looking for the Perfect Dashboard: InfluxDB, Telegraf and Grafana – Part XV – IPMI Monitoring of our ESXi Hosts
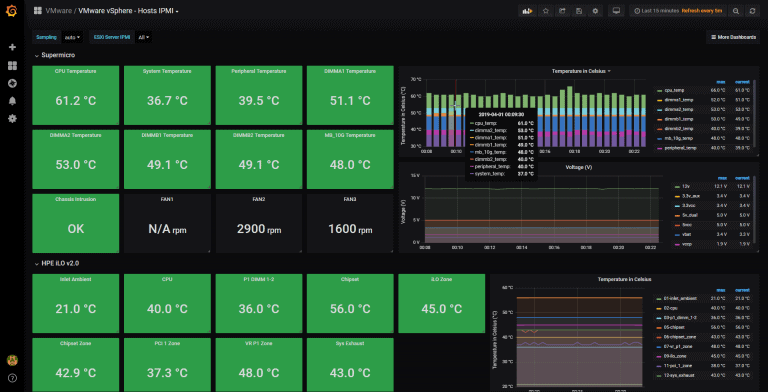
Greetings friends, we have spoken on numerous occasions about the power of InfluxDB, Telegraf and Grafana, if you remember not long ago I left you this fantastic post on how to monitor your vSphere for free and in less than 5 minutes: Looking for the Perfect Dashboard: InfluxDB, Telegraf and Grafana – Part XII (Native Telegraf Plugin for
Looking for the Perfect Dashboard: InfluxDB, Telegraf and Grafana – Part XII (Native Telegraf Plugin for vSphere)
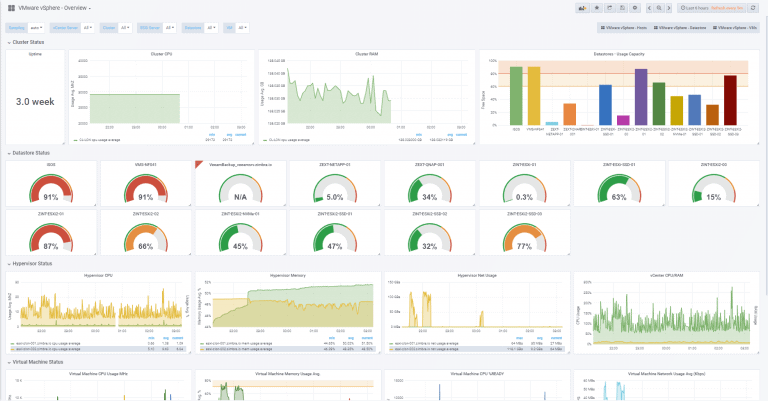
Greetings friends, today I bring you another one of those hidden gems that you like so much. In addition to being free and being able to display it in a few minutes, it has a potential that many commercial tools would like. Today we are about to create four fresh Grafana Dashboards within minutes, at the end of the blog, we can have some