
 Greetings friends, I have already mentioned all the advantages that a monitoring and dashboarding system has. In fact, you can find all the entries about InfluxDB, Telegraf and Grafana here. Today I bring you a new entry focused on Service Providers of Veeam using Veeam Cloud Connect, in this case it’s a Dashboard that will increase the visibility that Veeam Service Providers has thanks to the Veeam Availability Console. Veeam Availability Console it is free for any Veeam Service Provider, and among the tons of features that it has, it does include as well a RESTfulAPI which we will leverage for this Grafana Dashboard
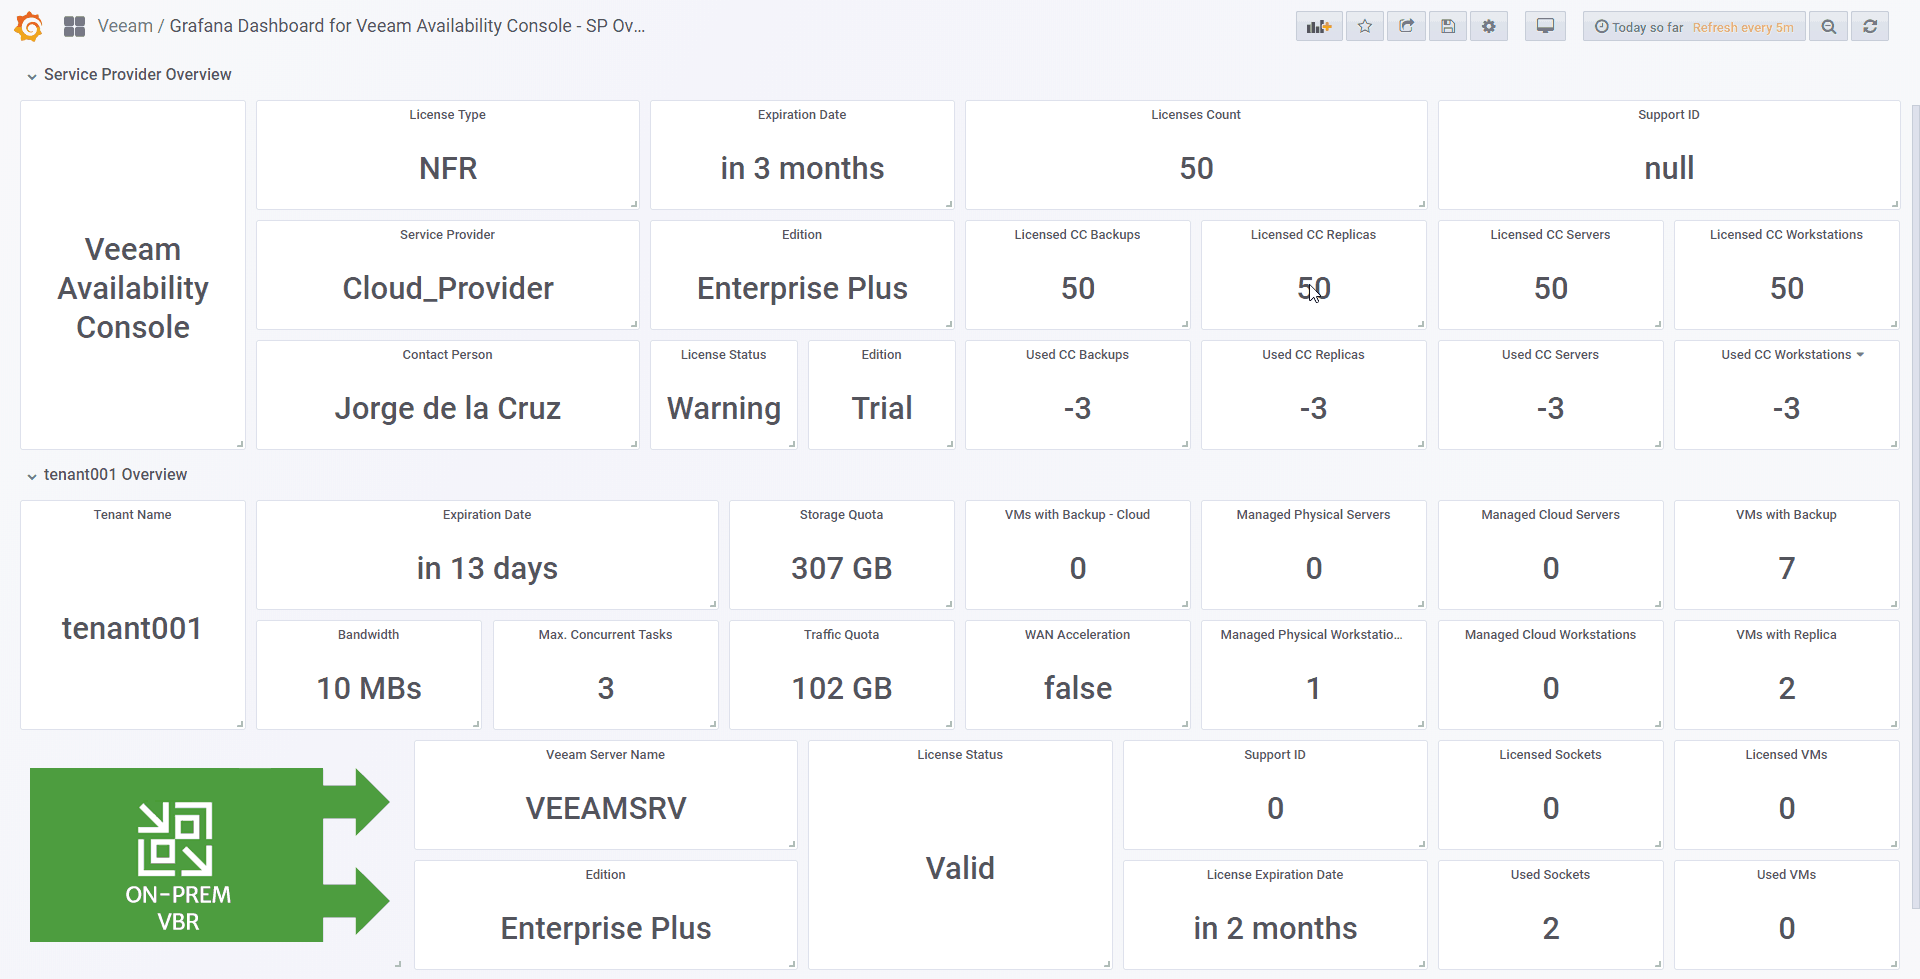
Grafana Dashboard for Veeam Availability Suite – SP Overview
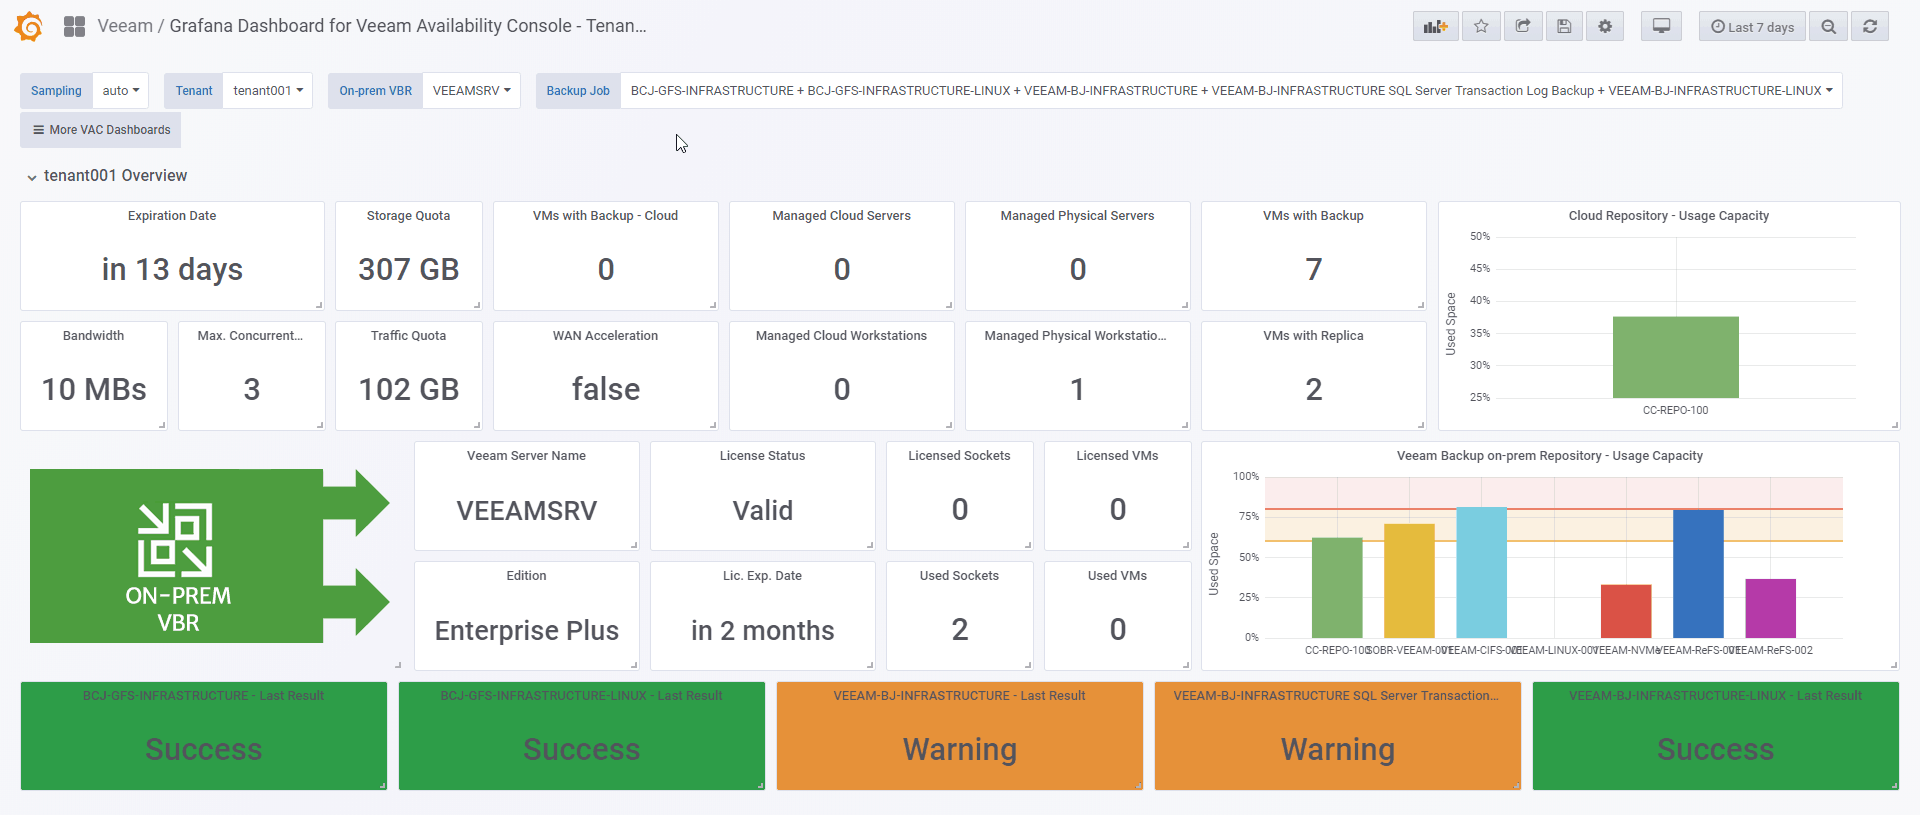
 Grafana Dashboard for Veeam Availability Suite – Tenant Overview
 The project it is on a very early state, v0.1 you can call it, so your feedback it will be important and very valued.
How to check the Veeam Availability Console RestAPI with a simple Web Browser
Veeam Availability Console comes with a RESTfulAPI already on it, we can check it using a simple web browser, explore the SWAGGER that Veeam Availability Console brings as standard, we will find it at https://VACURL:1281/swagger/ui/ and should look like this: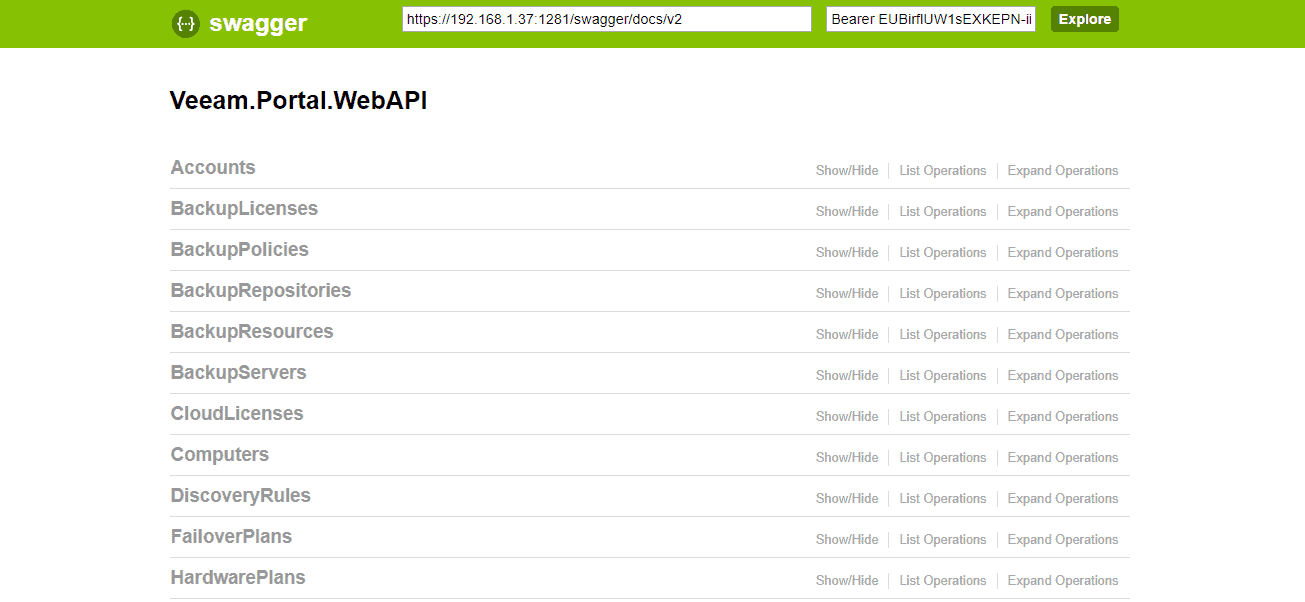
Now with this we are ready to continue towards the Perfect Dashboard for Veeam Availability Console.
Veeam Availability Console RestAPI Script
The script that can be downloaded directly from GitHub requires a brief configuration with certain parameters of our environments, but before we see this configuration, let’s see what this script gathers from RestAPI:
- Status of the Service Provider VAC and VCC License
- Status of the Tenant Licensing at VCC level
- Status of the Tenant Licensing at on-prem VBR level
- Summary of the latest Backup status – by job
- Summary of the percentage used per Backup Repository
Once we download the script to our InfluxDB server, we’ll edit it and change the following:
##
# Configurations
##
# Endpoint URL for InfluxDB
InfluxDBURL="YOURINFLUXDB"
InfluxDBPort="8086" #Default Port
InfluxDB="telegraf" #Default Database

# Endpoint URL for login action
Username="YOURVACUSER"
Password="YOURVACPASSWORD"
RestServer="YOURVACURL"
RestPort="1281" #Default Port
Once we edit these parameters, make the script executable:
chmod +x veeam_availability-console-grafana.sh
We will be able to execute it manually if we want to see what it does, we would have to observe an output like the next one repeated many times:
HTTP/1.1 204 No Content
Content-Type: application/json
Request-Id: 3565d5b6-011d-11e9-81c7-000000000000
X-Influxdb-Build: OSS
X-Influxdb-Version: 1.6.3
X-Request-Id: 3565d5b6-011d-11e9-81c7-000000000000
Date: Sun, 16 Dec 2018 10:27:37 GM
This is fine, and that’s what has to come out, now we have to program our script to launch automatically as often as we want, in my case every 30 minutes, we will use crontab -e to add it to cron, use your own path:
*/30 * * * * * /home/oper/veeam_availability-console-grafana.sh >> /var/log/veeamvac.log 2>&1
Verifying that we are ingesting information with Chronograf
The normal thing at this point, if we have done all the steps well, is that we are already sending information compiled by the script to InfluxDB, if we do a search using the wonderful Chronograf, we can see that we have information: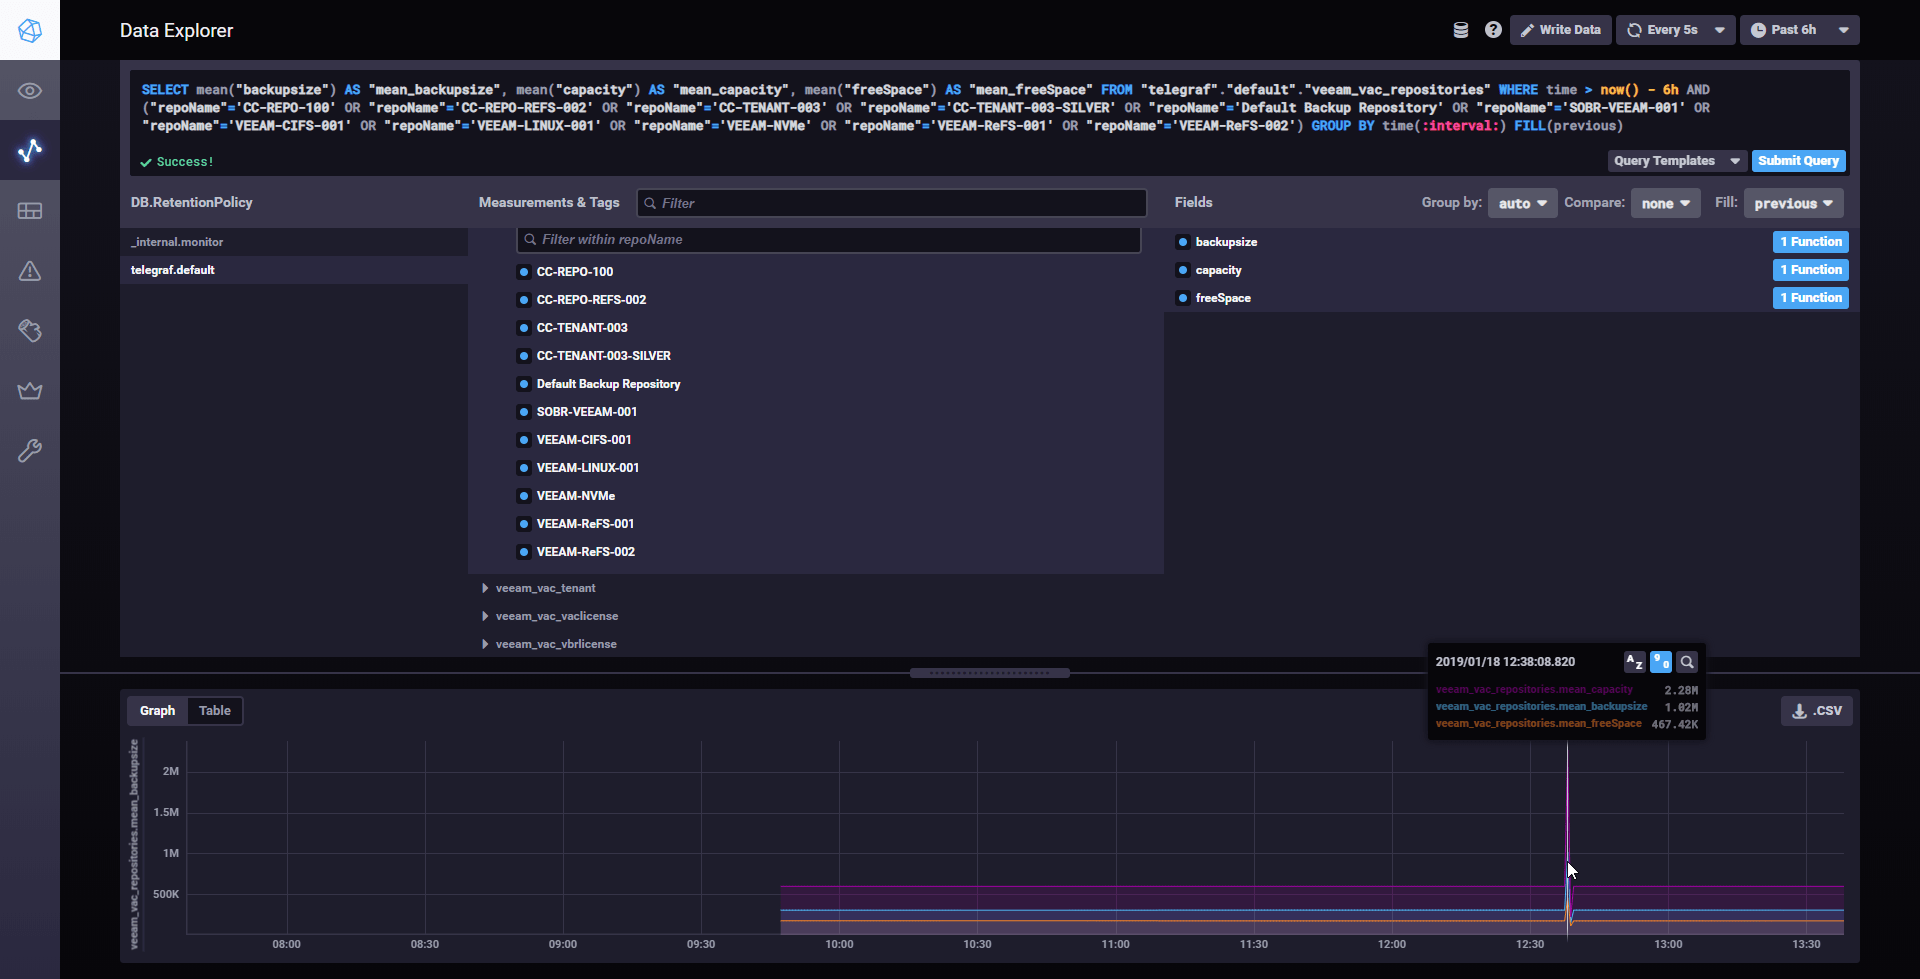 All the variables of this new Veeam script for VAC are stored in veeam_vac_* so it is really easy to find them.
Grafana Dashboards
I have created two Grafana Dashboards from scratch selecting the best requests to the database, finishing off colors, thinking what graphic and how to show it, and everything is automated so that it fits our environment without any problem and without having to edit anything manually. You can find the Dashboards here, once imported, you can use the top dropdown menus to select between tenants, VBR, etc:
- Veeam Availability Console Grafana Dashboard – SP Overview
- Veeam Availability Console Grafana Dashboard – Tenant Overview
How to Import easily the Grafana Dashboard
So that you don’t have to waste hours configuring a new Dashboard, and ingesting and debugging queries, I’ve already created four wonderful Dashboard with everything you need to monitor our environment in a very simple way, it will look like the image I showed you above.
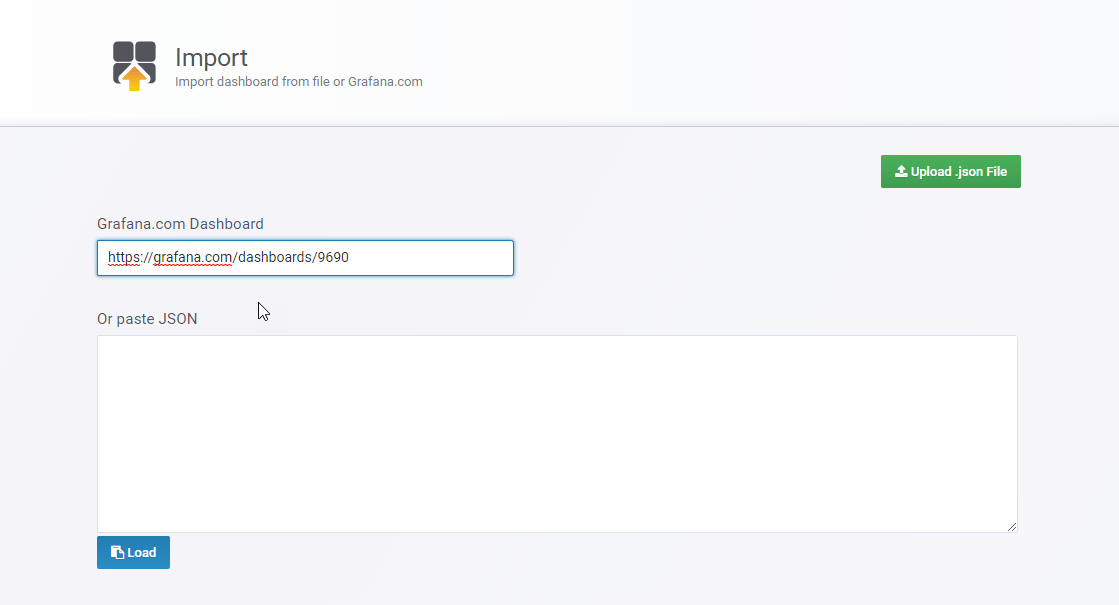
Select Create Dashboard – Import
 Select the name you want and enter the ID: 9690 and 9691, which is the unique ID of the Dashboard, or the URL:
 With the menus above you can deploy and adjust the Dashboard to your organization, backup jobs, and so on: Please leave your feedback in the comments, or in GitHub.
I hope you like it, and I would like to leave you the complete series here, so you can start playing with the plugins that I have been telling you about all these years:
- Looking for the Perfect Dashboard: InfluxDB, Telegraf, and Grafana – Part I (Installing InfluxDB, Telegraf, and Grafana on Ubuntu 20.04 LTS)
- En busca del Dashboard perfecto: InfluxDB, Telegraf y Grafana – Parte II (Instalar agente Telegraf en Nodos remotos Linux)
- En busca del Dashboard perfecto: InfluxDB, Telegraf y Grafana – Parte III Integración con PRTG
- En busca del Dashboard perfecto: InfluxDB, Telegraf y Grafana – Parte IV (Instalar agente Telegraf en Nodos remotos Windows)
- En busca del Dashboard perfecto: InfluxDB, Telegraf y Grafana – Parte V (Activar inputs específicos, Red, MySQL/MariaDB, Nginx)
- En busca del Dashboard perfecto: InfluxDB, Telegraf y Grafana – Parte VI (Monitorizando Veeam)
- En busca del Dashboard perfecto: InfluxDB, Telegraf y Grafana – Parte VII (Monitorizar vSphere)
- En busca del Dashboard perfecto: InfluxDB, Telegraf y Grafana – Parte VIII (Monitorizando Veeam con Enterprise Manager)
- En busca del Dashboard perfecto: InfluxDB, Telegraf y Grafana – Parte IX (Monitorizando Zimbra Collaboration)
- En busca del Dashboard perfecto: InfluxDB, Telegraf y Grafana – Parte X (Grafana Plugins)
- En busca del Dashboard perfecto: InfluxDB, Telegraf y Grafana – Parte XI – (Monitorizando URL e IPS con Telegraf y Ping)
- Looking for the Perfect Dashboard: InfluxDB, Telegraf, and Grafana – Part XII (Native Telegraf Plugin for vSphere)
- Looking for the Perfect Dashboard: InfluxDB, Telegraf, and Grafana – Part XIII (Veeam Backup for Microsoft Office 365 v4)
- Looking for the Perfect Dashboard: InfluxDB, Telegraf, and Grafana – Part XIV – Veeam Availability Console
- Looking for the Perfect Dashboard: InfluxDB, Telegraf, and Grafana – Part XV (IPMI Monitoring of our ESXi Hosts)
- Looking for Perfect Dashboard: InfluxDB, Telegraf, and Grafana – Part XVI (Performance and Advanced Security of Veeam Backup for Microsoft Office 365)
- Looking for the Perfect Dashboard: InfluxDB, Telegraf, and Grafana – Part XVII (Showing Dashboards on Two Monitors Using Raspberry Pi 4)
- En busca del Dashboard perfecto: InfluxDB, Telegraf y Grafana – Parte XVIII – Monitorizar temperatura y estado de Raspberry Pi 4
- Looking for the Perfect Dashboard: InfluxDB, Telegraf, and Grafana – Part XIX (Monitoring Veeam with Enterprise Manager) Shell Script
- Looking for the Perfect Dashboard: InfluxDB, Telegraf, and Grafana – Part XXIV (Monitoring Veeam Backup for Microsoft Azure)
- Looking for the Perfect Dashboard: InfluxDB, Telegraf, and Grafana – Part XXV (Monitoring Power Consumption)
- Looking for the Perfect Dashboard: InfluxDB, Telegraf, and Grafana – Part XXVI (Monitoring Veeam Backup for Nutanix)
- Looking for the Perfect Dashboard: InfluxDB, Telegraf, and Grafana – Part XXVII (Monitoring ReFS and XFS (block-cloning and reflink)
- Looking for the Perfect Dashboard: InfluxDB, Telegraf, and Grafana – Part XXVIII (Monitoring HPE StoreOnce)
- Looking for the Perfect Dashboard: InfluxDB, Telegraf, and Grafana – Part XXIX (Monitoring Pi-hole)
- Looking for the Perfect Dashboard: InfluxDB, Telegraf, and Grafana – Part XXIX (Monitoring Veeam Backup for AWS)
- Looking for the Perfect Dashboard: InfluxDB, Telegraf, and Grafana – Part XXXI (Monitoring Unifi Protect)
- Looking for the Perfect Dashboard: InfluxDB, Telegraf, and Grafana – Part XXXII (Monitoring Veeam ONE – experimental)
- Looking for the Perfect Dashboard: InfluxDB, Telegraf, and Grafana – Part XXXIII (Monitoring NetApp ONTAP)
- Looking for the Perfect Dashboard: InfluxDB, Telegraf, and Grafana – Part XXXIV (Monitoring Runecast)
- Looking for the Perfect Dashboard: InfluxDB, Telegraf, and Grafana – Part XXXV (GPU Monitoring)
- Looking for the Perfect Dashboard: InfluxDB, Telegraf, and Grafana – Part XXXVI (Monitoring Goldshell Miners – JSONv2)
- Looking for the Perfect Dashboard: InfluxDB, Telegraf, and Grafana – Part XXXVII (Monitoring Veeam Backup for Google Cloud Platform)
- En Busca del Dashboard perfecto: InfluxDB, Telegraf y Grafana – Parte XXXVIII (Monitorizando Temperatura y Humedad con Xiaomi Mijia)
- Looking for the Perfect Dashboard: InfluxDB, Telegraf, and Grafana – Part XL (Veeam Backup for Microsoft 365 – Restore Audit)
- Looking for the Perfect Dashboard: InfluxDB, Telegraf, and Grafana – Part XLI (Veeam Backup for Salesforce)
- Looking for the Perfect Dashboard: InfluxDB, Telegraf, and Grafana – Part XLII (Veeam ONE v12 Audit Events)
- Looking for the Perfect Dashboard: InfluxDB, Telegraf, and Grafana – Part XLIII (Monitoring QNAP using SNMP v3)
- Looking for the Perfect Dashboard: InfluxDB, Telegraf, and Grafana – Part XLIV (Monitoring Veeam Backup & Replication API)
- Looking for the Perfect Dashboard: InfluxDB, Telegraf, and Grafana – Part XLV (Monitoring Synology using SNMP v3)
- Looking for the Perfect Dashboard: InfluxDB, Telegraf, and Grafana – Part XLVI (Monitoring NVIDIA Jetson Nano)
- Looking for the Perfect Dashboard: InfluxDB, Telegraf, and Grafana – Part XLVII (Monitoring Open WebUI)
- Looking for the Perfect Dashboard: InfluxDB, Telegraf, and Grafana – Part XLVIII (Monitoring Veeam Data Platform Advanced)
- Looking for the Perfect Dashboard: InfluxDB, Telegraf, and Grafana – Part XLIX (Monitoring Unofficial Veeam ONE Node Exporter)
Wait one second, I have already saw your Veeam ONE Monitoring for Service Providers
That is absolutely fine, the blog post covering how to monitor our Veeam Cloud Connect with Veeam ONE, which you can find here:
It is still relevant, and one of the best ways to have deep visibility, and reporting, into your VMware, Veeam Backup and Replication and Veeam Cloud Connect infrastructure.
This post it is intended to give to you, as a Service Provider, more options to expand your monitoring, and maybe even share some Dashboards customized with your Tenants.
Hello Jorge
I am very interested in the VAC Dashboard for Service Providers, but I am a bit new to all this.
As I understand it I need
1) A linux server with an Influxdb and Chronograph
2) a grafana Dashboard running on the VAC server
Your dashboard plug in https://grafana.com/grafana/dashboards/9690
Your Script : “veeam-availability-console-script.sh” configured and set to run at 30 minute intervals
Any advice you could give on installation would be great.
Many Thanks
Hello Clive,
Probably what will be the best is to download the VSAN Monitoring OVA, which it is at the end all of this setup, here – https://flings.vmware.com/vsan-performance-monitor
Jorge
Many Thanks for the link.
I will let you know how I get on.
I assume this is OK to use with VAC 3.0?
Thanks
Hello Clive,
Probably some changes needs to be made for VAC v3.0, I didn’t had time to finish it yet
Hello Jorge
I have built an Ubuntu server (18.04) with Influxdb, Telegraf, Grafana and json jq
There were some quirks along the way but I have it all connected OK.
I have edited your script and configured it in a cron job
I have also imported the dashboard.
We are running VAC 3.0
Unfortunately I have been unable to pull any data from VAC.
I have created a Local admin on VAC server (called admin) and using swagger I can create a token from here for the admin account.
The admin account is entered in the script here
# Endpoint URL for login action
Username=”admin”
When running the script manually I get an error
HTTP/1.1 400 Bad Request
Content-Type: application/json
Request-Id: 363b4f1b-1a96-11ea-847f-0050568101ca
X-Influxdb-Build: OSS
X-Influxdb-Error: unable to parse ‘veeam_vac_vcclicense,edition=,status=,type=,contactPerson=,backupServerName=,companyName= licenseExpirationDate=1575849600,supportExpirationDate=1575849600,licensedCloudConnectBackups=,usedCloudConnectBackups=,licensedCloudConnectReplicas=,usedCloudConnectReplicas=,licensedCloudConnectServers=,usedCloudConnectServers=,licensedCloudConnectWorkstations=,usedCloudConnectWorkstations=’: missing tag value
X-Influxdb-Version: 1.7.9
X-Request-Id: 363b4f1b-1a96-11ea-847f-0050568101ca
Date: Mon, 09 Dec 2019 15:11:44 GMT
Content-Length: 433
This is also listed in the log file
Any ideas?
Many Thanks
Clive
Hello Jorge
Would appreciate it if you could find some time to have a look at this or should I wait for the next release?
thanks
Hi Clive,
I did not had time just yet, will try it over the weekend.
Best regards
Hello Jorge
Would appreciate it if you could find some time to have a look at this or should I wait for the next release?
thanks
Clive
Hello,
Trying already on my lab with the latest patch 4 from yesterday, will have something ready soon
Hi Jorgeuk,
I’m getting the same error output. Believe we also using the latest version of VAC.
Cheers,
Raynok
Hi Jorgeuk
Trust all is going well during the COVID19 lockdown.
Have you managed to figure out how to make it work for VAC 3.0 or later?
I tried to research but just cant get around the error “missing tag value” as above.
Cheers,
Hello Rayno,
I was thinking of invest my time on the new Veeam Service Provider Console, any plans for you to upgrade to that soon? I can give it a quick look to VAC v3.0, will try this week. Hope you and all yours are doing good.
Hey Jorge,
Same issue on VAC 4 for me. Would love to get this working
Can we get this working for V4 please?
Just getting:
HTTP/1.1 400 Bad Request
Content-Type: application/json
Request-Id: aa616030-a0c8-11ea-8736-000000000000
X-Influxdb-Build: OSS
X-Influxdb-Error: unable to parse ‘veeam_vac_vcclicense,edition=,status=,type=,contactPerson=,backupServerName=,companyName= licenseExpirationDate=1590624000,supportExpirationDate=1590624000,licensedCloudConnectBackups=,usedCloudConnectBackups=,licensedCloudConnectReplicas=,usedCloudConnectReplicas=,licensedCloudConnectServers=,usedCloudConnectServers=,licensedCloudConnectWorkstations=,usedCloudConnectWorkstations=’: missing tag value
X-Influxdb-Version: 1.5.4
X-Request-Id: aa616030-a0c8-11ea-8736-000000000000
Date: Thu, 28 May 2020 09:50:30 GMT
Content-Length: 433
{“error”:”unable to parse ‘veeam_vac_vcclicense,edition=,status=,type=,contactPerson=,backupServerName=,companyName= licenseExpirationDate=1590624000,supportExpirationDate=1590624000,licensedCloudConnectBackups=,usedCloudConnectBackups=,licensedCloudConnectReplicas=,usedCloudConnectReplicas=,licensedCloudConnectServers=,usedCloudConnectServers=,licensedCloudConnectWorkstations=,usedCloudConnectWorkstations=’: missing tag value”}
HTTP/1.1 400 Bad Request
Content-Type: application/json
Request-Id: f87f012e-a0c8-11ea-8752-000000000000
X-Influxdb-Build: OSS
X-Influxdb-Error: unable to parse ‘veeam_vac_vaclicense,productName=,licensedTo=,licenseType=,licensesCount=,licensesUsedCount=,supportID= licenseExpirationDate=1590624000,supportExpirationDate=1590624000,licensevmCount=,licenseworkstationCount=,licenseserverCount=,licensecloudWorkstationCount=,licensecloudServerCount=,licensecloudconnectBackupVmCount=,cloudconnectBackupWorkstationCount=,cloudconnectBackupServerCount=,cloudconnectReplicationVmCount=’: missing tag value
X-Influxdb-Version: 1.5.4
X-Request-Id: f87f012e-a0c8-11ea-8752-000000000000
Date: Thu, 28 May 2020 09:52:41 GMT
Content-Length: 468
{“error”:”unable to parse ‘veeam_vac_vaclicense,productName=,licensedTo=,licenseType=,licensesCount=,licensesUsedCount=,supportID= licenseExpirationDate=1590624000,supportExpirationDate=1590624000,licensevmCount=,licenseworkstationCount=,licenseserverCount=,licensecloudWorkstationCount=,licensecloudServerCount=,licensecloudconnectBackupVmCount=,cloudconnectBackupWorkstationCount=,cloudconnectBackupServerCount=,cloudconnectReplicationVmCount=’: missing tag value”}
Hola jorge
También tengo problemas para ejecutar el script veeam-availability-console-script.sh
-veeam service provider v4
se está produciendo el siguiente error:
[root@svxoracle01 ~]# sh veeam_availability-console-grafana.sh
HTTP/1.1 400 Bad Request
Content-Type: application/json
Request-Id: f84db1c7-5cdb-11eb-87fa-02001701b10c
X-Influxdb-Build: OSS
X-Influxdb-Error: unable to parse ‘veeam_vac_vcclicense,edition=,status=,type=,contactPerson=,backupServerName=,companyName= licenseExpirationDate=1611284400,supportExpirationDate=1611284400,licensedCloudConnectBackups=,usedCloudConnectBackups=,licensedCloudConnectReplicas=,usedCloudConnectReplicas=,licensedCloudConnectServers=,usedCloudConnectServers=,licensedCloudConnectWorkstations=,usedCloudConnectWorkstations=’: missing tag value
X-Influxdb-Version: 1.8.3
X-Request-Id: f84db1c7-5cdb-11eb-87fa-02001701b10c
Date: Fri, 22 Jan 2021 18:02:19 GMT
Content-Length: 433
{“error”:”unable to parse ‘veeam_vac_vcclicense,edition=,status=,type=,contactPerson=,backupServerName=,companyName= licenseExpirationDate=1611284400,supportExpirationDate=1611284400,licensedCloudConnectBackups=,usedCloudConnectBackups=,licensedCloudConnectReplicas=,usedCloudConnectReplicas=,licensedCloudConnectServers=,usedCloudConnectServers=,licensedCloudConnectWorkstations=,usedCloudConnectWorkstations=’: missing tag value”}
HTTP/1.1 400 Bad Request
Content-Type: application/json
Request-Id: f86d355e-5cdb-11eb-87fb-02001701b10c
X-Influxdb-Build: OSS
X-Influxdb-Error: unable to parse ‘veeam_vac_vaclicense,productName=,licensedTo=,licenseType=,licensesCount=,licensesUsedCount=,supportID= licenseExpirationDate=1611284400,supportExpirationDate=1611284400,licensevmCount=,licenseworkstationCount=,licenseserverCount=,licensecloudWorkstationCount=,licensecloudServerCount=,licensecloudconnectBackupVmCount=,cloudconnectBackupWorkstationCount=,cloudconnectBackupServerCount=,cloudconnectReplicationVmCount=’: missing tag value
X-Influxdb-Version: 1.8.3
X-Request-Id: f86d355e-5cdb-11eb-87fb-02001701b10c
Date: Fri, 22 Jan 2021 18:02:20 GMT
Content-Length: 468
{“error”:”unable to parse ‘veeam_vac_vaclicense,productName=,licensedTo=,licenseType=,licensesCount=,licensesUsedCount=,supportID= licenseExpirationDate=1611284400,supportExpirationDate=1611284400,licensevmCount=,licenseworkstationCount=,licenseserverCount=,licensecloudWorkstationCount=,licensecloudServerCount=,licensecloudconnectBackupVmCount=,cloudconnectBackupWorkstationCount=,cloudconnectBackupServerCount=,cloudconnectReplicationVmCount=’: missing tag value”}
Hi jorge,
Thanks so much for beeing so collab with us, this is a wonderfull solution. however im having the same issue with VSPC V5.
HTTP/1.1 400 Bad Request
Content-Type: application/json
Request-Id: 569f201f-87a5-11eb-802d-00505696bce5
X-Influxdb-Build: OSS
X-Influxdb-Error: unable to parse ‘veeam_vac_vcclicense,edition=,status=,type=,contactPerson=,backupServerName=,companyName= licenseExpirationDate=1616025600,supportExpirationDate=1616025600,licensedCloudConnectBackups=,usedCloudConnectBackups=,licensedCloudConnectReplicas=,usedCloudConnectReplicas=,licensedCloudConnectServers=,usedCloudConnectServers=,licensedCloudConnectWorkstations=,usedCloudConnectWorkstations=’: missing tag value
X-Influxdb-Version: 1.8.4
X-Request-Id: 569f201f-87a5-11eb-802d-00505696bce5
Date: Thu, 18 Mar 2021 04:49:35 GMT
Content-Length: 433
{“error”:”unable to parse ‘veeam_vac_vcclicense,edition=,status=,type=,contactPerson=,backupServerName=,companyName= licenseExpirationDate=1616025600,supportExpirationDate=1616025600,licensedCloudConnectBackups=,usedCloudConnectBackups=,licensedCloudConnectReplicas=,usedCloudConnectReplicas=,licensedCloudConnectServers=,usedCloudConnectServers=,licensedCloudConnectWorkstations=,usedCloudConnectWorkstations=’: missing tag value”}
HTTP/1.1 400 Bad Request
Content-Type: application/json
Request-Id: 5707d1f5-87a5-11eb-802e-00505696bce5
X-Influxdb-Build: OSS
X-Influxdb-Error: unable to parse ‘veeam_vac_vaclicense,productName=,licensedTo=,licenseType=,licensesCount=,licensesUsedCount=,supportID= licenseExpirationDate=1616025600,supportExpirationDate=1616025600,licensevmCount=,licenseworkstationCount=,licenseserverCount=,licensecloudWorkstationCount=,licensecloudServerCount=,licensecloudconnectBackupVmCount=,cloudconnectBackupWorkstationCount=,cloudconnectBackupServerCount=,cloudconnectReplicationVmCount=’: missing tag value
X-Influxdb-Version: 1.8.4
X-Request-Id: 5707d1f5-87a5-11eb-802e-00505696bce5
Date: Thu, 18 Mar 2021 04:49:36 GMT
Content-Length: 468
{“error”:”unable to parse ‘veeam_vac_vaclicense,productName=,licensedTo=,licenseType=,licensesCount=,licensesUsedCount=,supportID= licenseExpirationDate=1616025600,supportExpirationDate=1616025600,licensevmCount=,licenseworkstationCount=,licenseserverCount=,licensecloudWorkstationCount=,licensecloudServerCount=,licensecloudconnectBackupVmCount=,cloudconnectBackupWorkstationCount=,cloudconnectBackupServerCount=,cloudconnectReplicationVmCount=’: missing tag value”}
Would you mind taking a look on it?
Regards
Hello,
The old script has not been updated to v5, neither the dashboards 🙁
Hi Jorge,
I’m curious to know if you by any chance will revisit this project in the near future?
We have implemented:
Veeam Service Provider Console
Server Version 6.0.0.8787
Web UI Version 6.0.0.8787
And we are very interested in using this Script and Dashboard.
Thank you in advance
Hi Jorge,
I’m Curious to know if you by any change will revisit this project in the near future?
We have implemented Veeam Service Provider Console V6
And we are very interested in using this script with the Grafana Dashboard.
Thank you in advance.
Hello,
Short answer, YES! It will be developed and continued very soon. Actually, I just moved to Product Management today, so would love to discuss with you, on the formal way, around your needs, ideas, etc.
Would send you an email for next week.
Sounds great!
Really looking forward to hearing from you, when you have time of course.
Hello,
This doesn’t seem to be working if you use the instructions on the console & veeam knowledge base. Very confusing. Will try to follow your blog now
Hello Jahaziel,
Let me know how it goes, to be honest the script is quite old now, I need to spend more time developing using latest API version
Hi Jorge,
Any update on this? have you had the time to sart updading the script?
Hello Andre,
Yes! Well, not me, but another Partner, take a look at this – https://github.com/VeeamHub/grafana/tree/master/veeam-availability-console-grafana
So fresh new dashboards, and all. Give it a try