
 Greetings friends, after so many years counting all the possibilities Grafana, InfluxDB and Telegraf, I have come to realize that we have never dealt with the subject of notifications, so that Grafana alerts us when a value exceeds a certain threshold.
Grafana has several methods of sending notifications, Email, Slack and many others that you can see here:
I’m going to use the old, but effective, email notification.
Setting up aliases in Microsoft Office 365
In order to send and receive emails through Microsoft Office 365, the best thing is to use an alias, this way we can then create filters in a simpler way, in addition they do not have cost in Microsoft Office 365, so it is perfect, in my case I have created the alias [email protected], let’s see how:
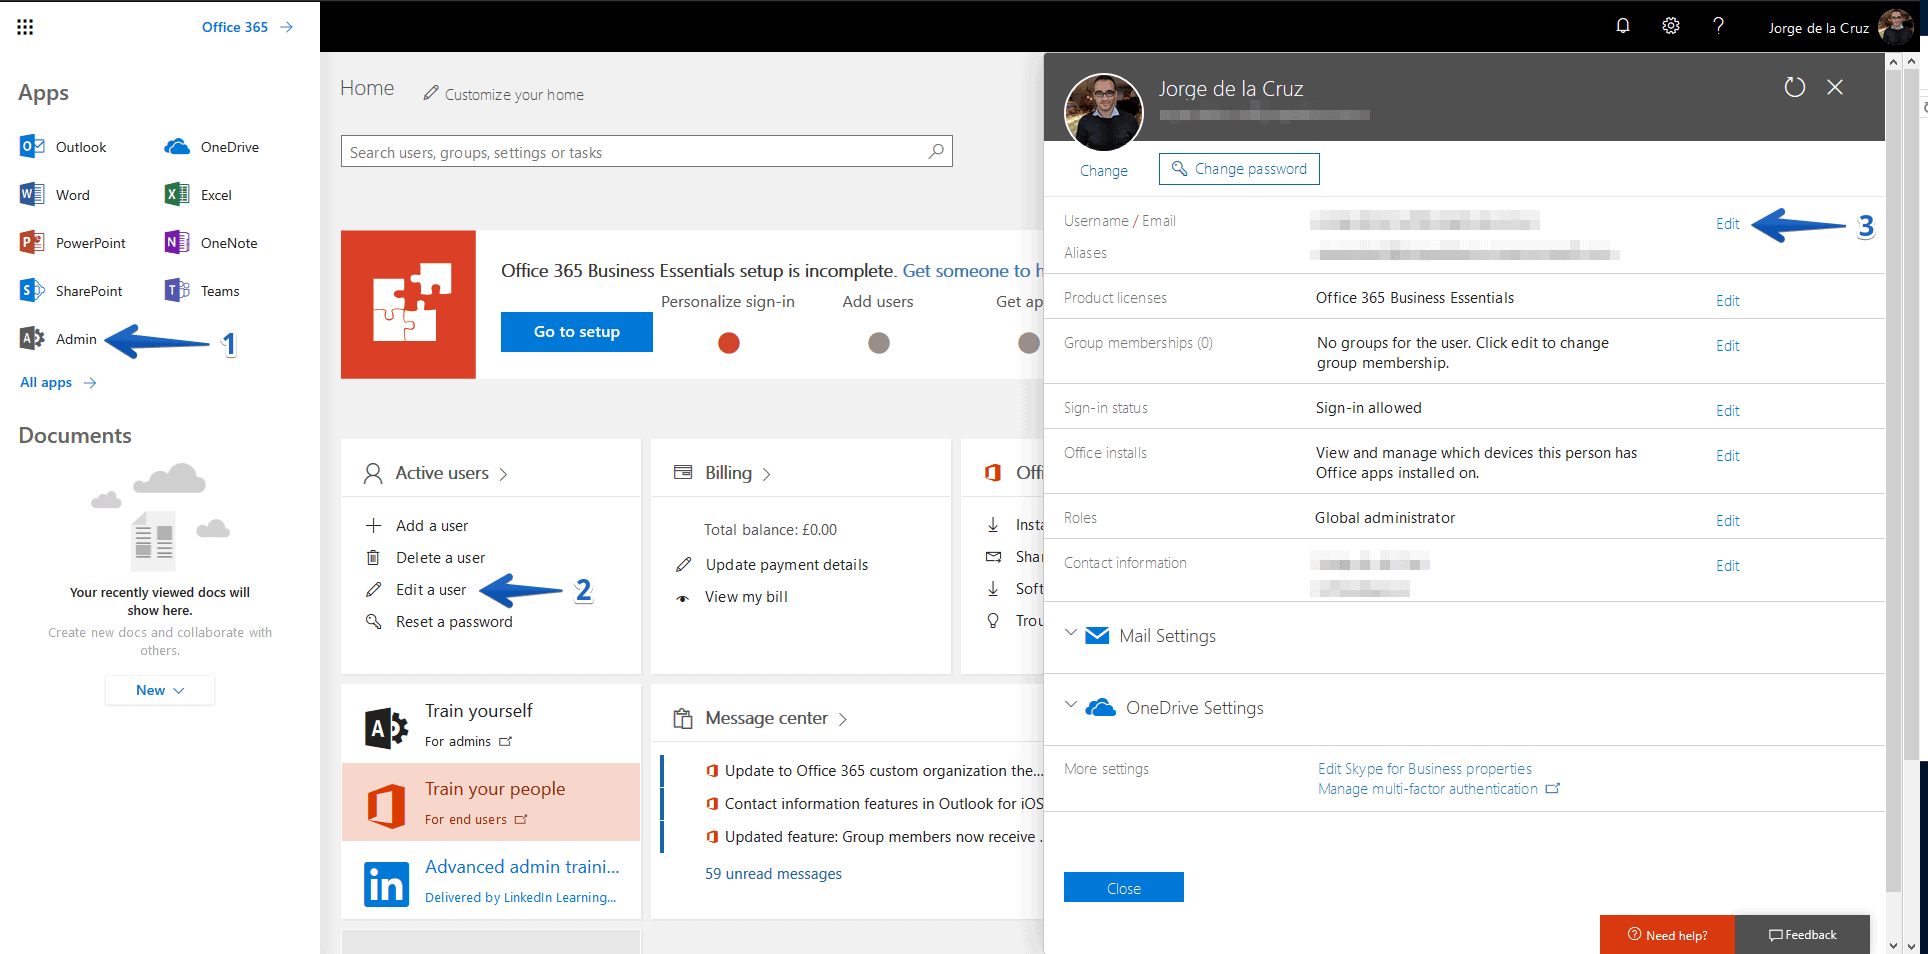
In the upper left menu we will click on Admin, then on Active users – Edit a user and then on Username/Email Aliases click on Edit
 We’ll add any alias we want, in my case as I told you [email protected]:
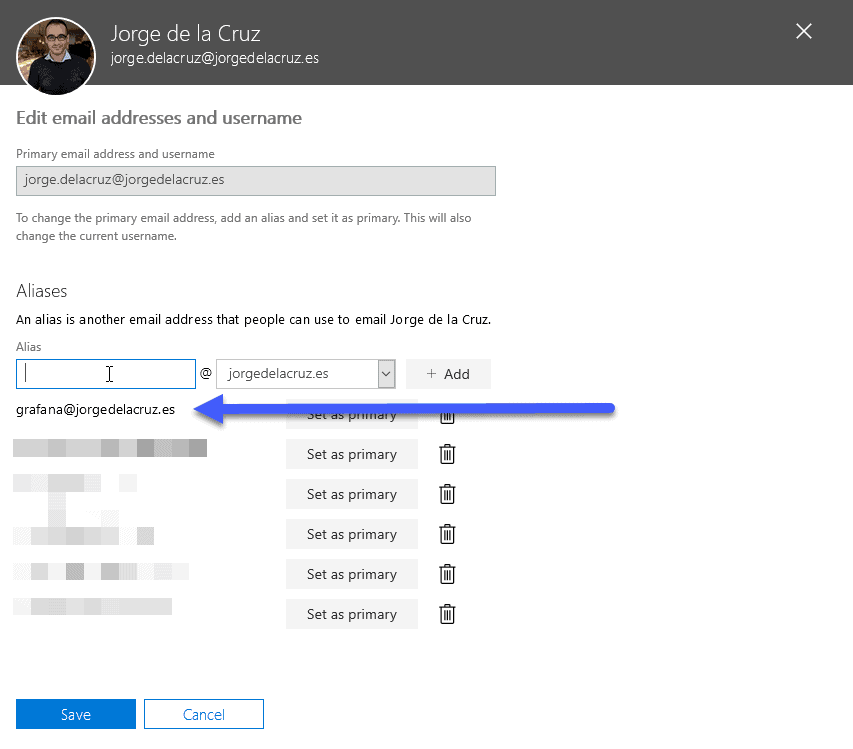
Configuration of the configuration file grafana.ini with our Office 365 information
We will have to edit our Grafana configuration file, in my case I have it in /etc/grafana/grafana.ini, if we look for the SMTP section, we will be able to find something like this, we will have to decomment it, put enabled in true and our data:
##################################### SMTP / Emailing ############################
[smtp]
enabled = true
host = smtp.office365.com:587
user = VUESTRACUENTADEOFFICE365
password = VUESTRAPASS
;cert_file =
;key_file =
skip_verify = true
from_address = [email protected]
Once we have entered our data correctly, we will restart the Grafana service:
service grafana-server restart
Configuration of our alarms in Grafana
Now that we have everything ready, we can go to our Grafana, and in the menu on the left we can click on Alerting – Add channel: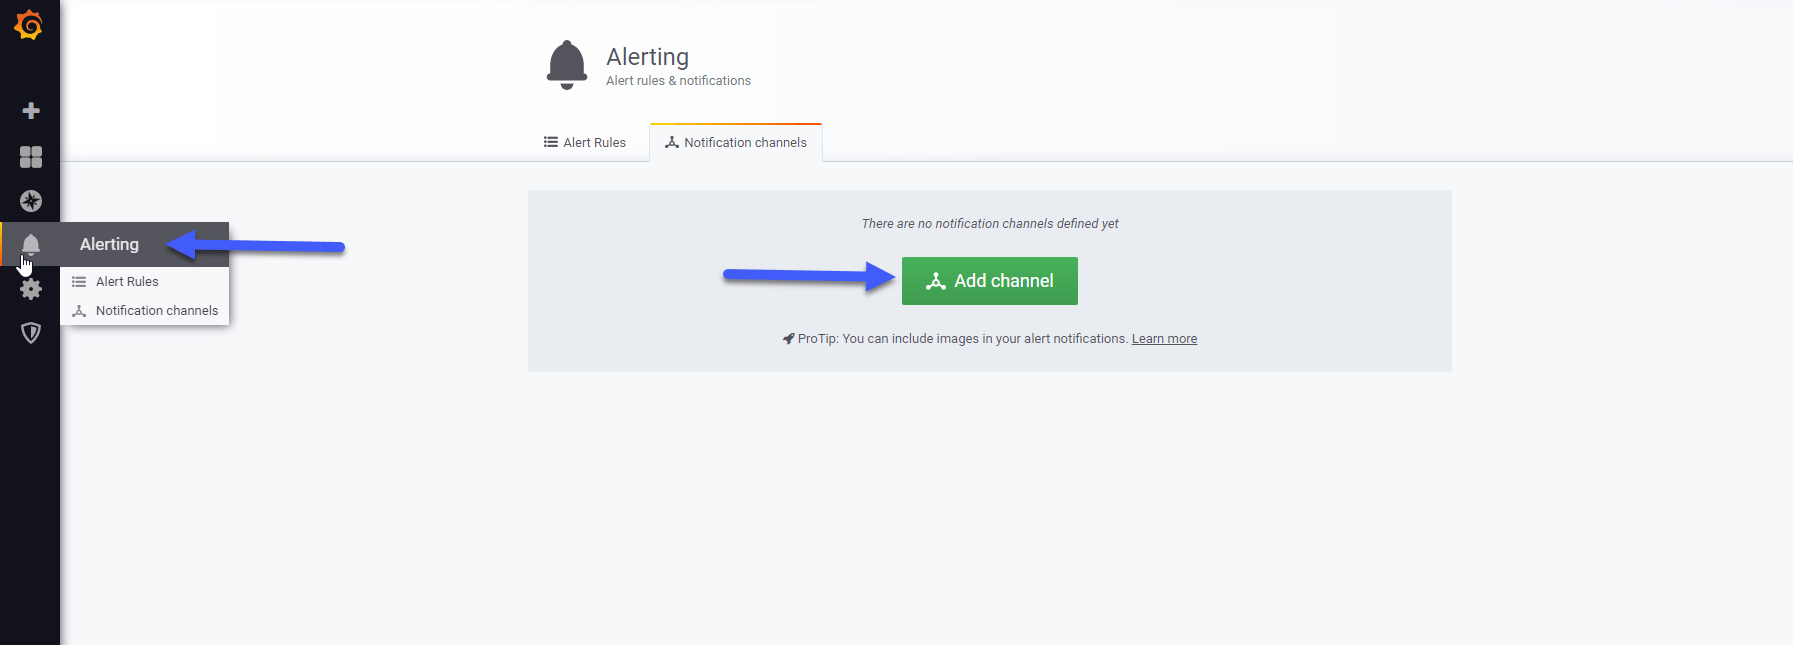 I have selected Email, put a name, and marked the options as you can see here, I have tested everything and it has come out in green:
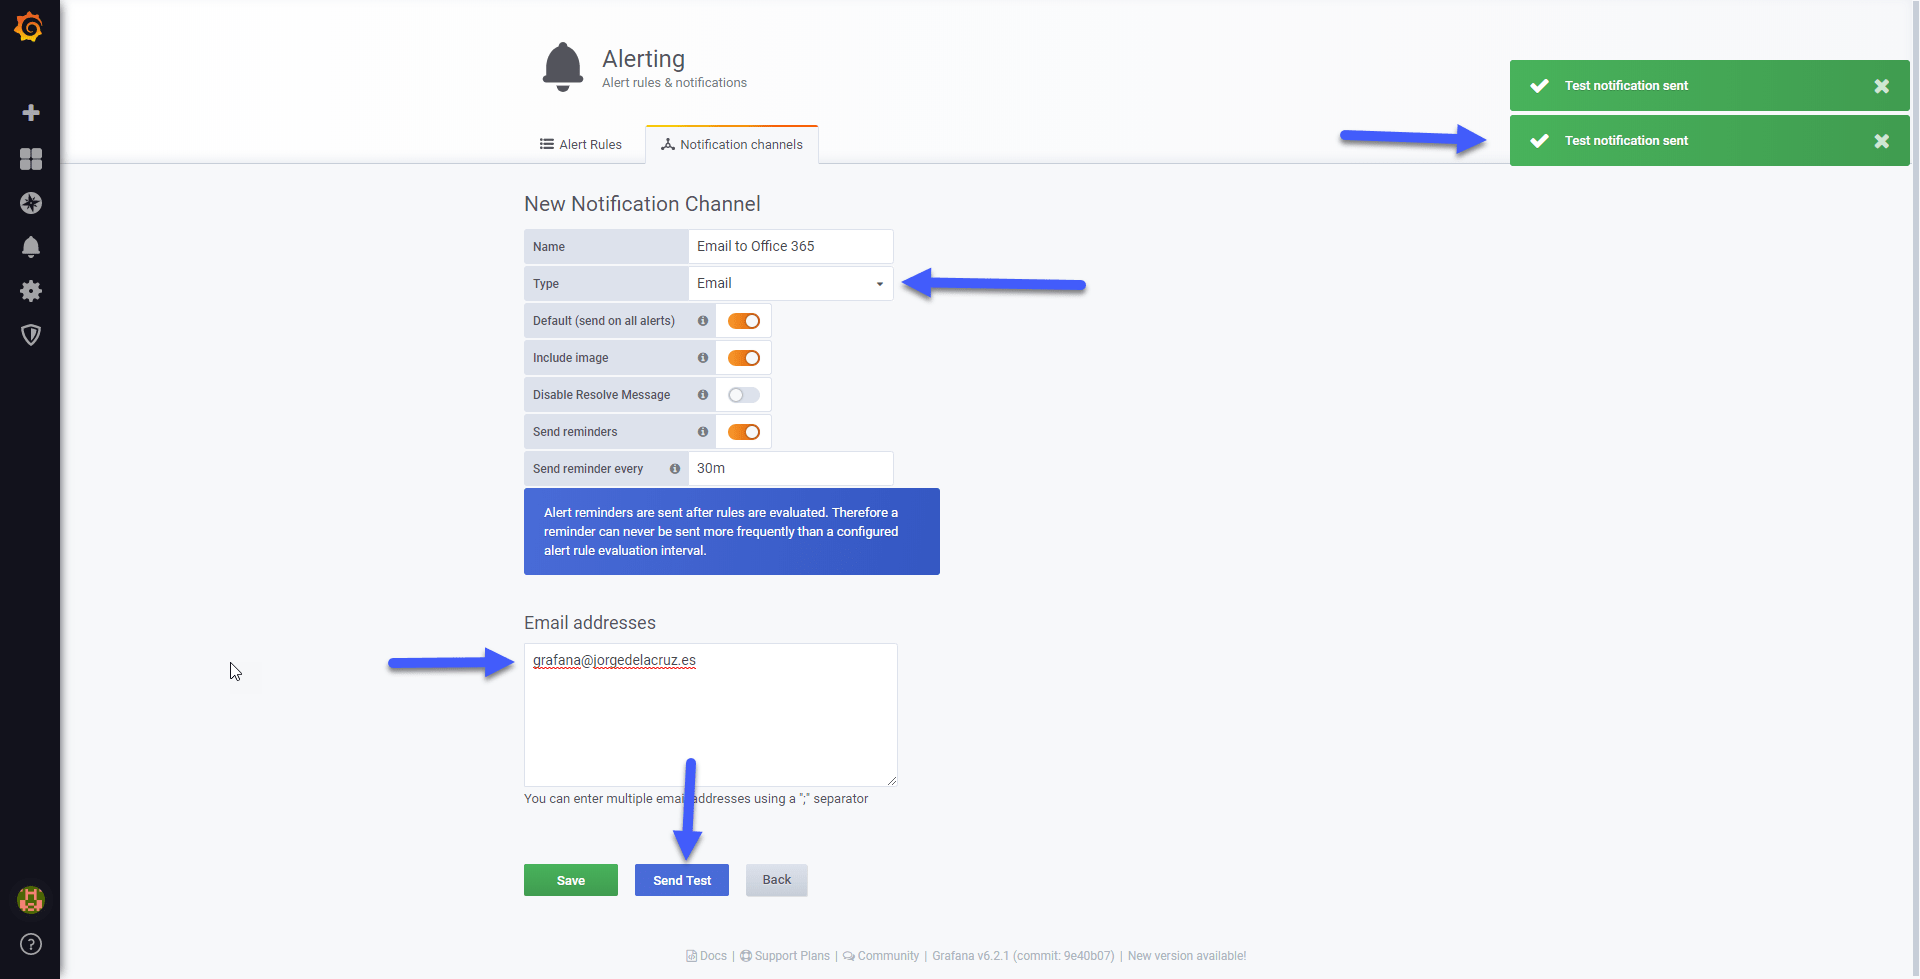 If we look in the /var/log/grafana/grafana.log we will be able to see the following:
t=2019-06-20T03:48:30-0500 lvl=info msg="Sending alert notification to" logger=alerting.notifier.email addresses=[[email protected]]
If we go to our brand new Exchange Online, we can see the test alarm, which is really beautiful: Perfect, now that we have the configuration of Grafana, we can go to our Dashboards to create alarms of our metrics.
Two important issues, not all the ways to show metrics allow us notifications, for example the singlestat does not allow it, but the right graphs do, so we will use those.
The other point to keep in mind is that we can not use variables for notifications, now I show you, we can see that to have notification, we can not use variable, but the host directly in this case (this is my query A) Edit the graph:
  In the graph of which I want notification, we will go to alerts, and Create Alert:
 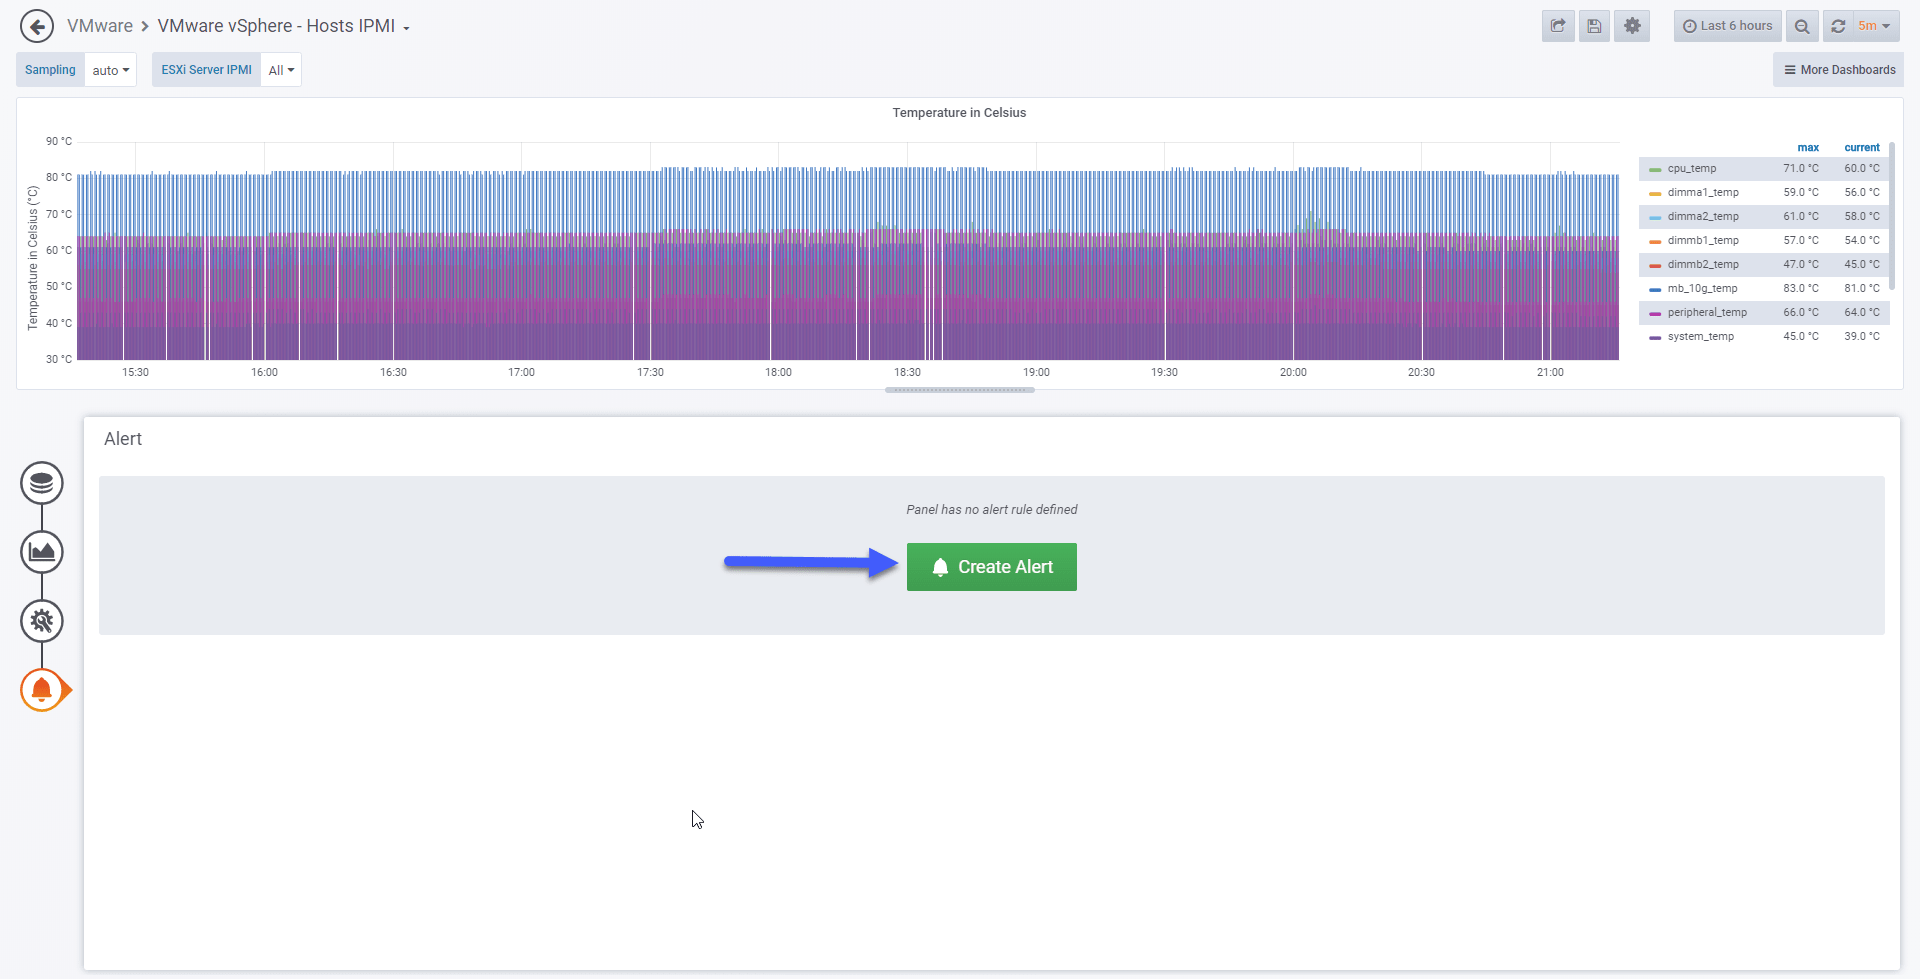 We can see several issues here, first the interval until it sends the alarm, if I have checked every 1 minute for up to 5 minutes, this means that if I have a temperature of 70C for more than 5 minutes have alarm, we can test it:
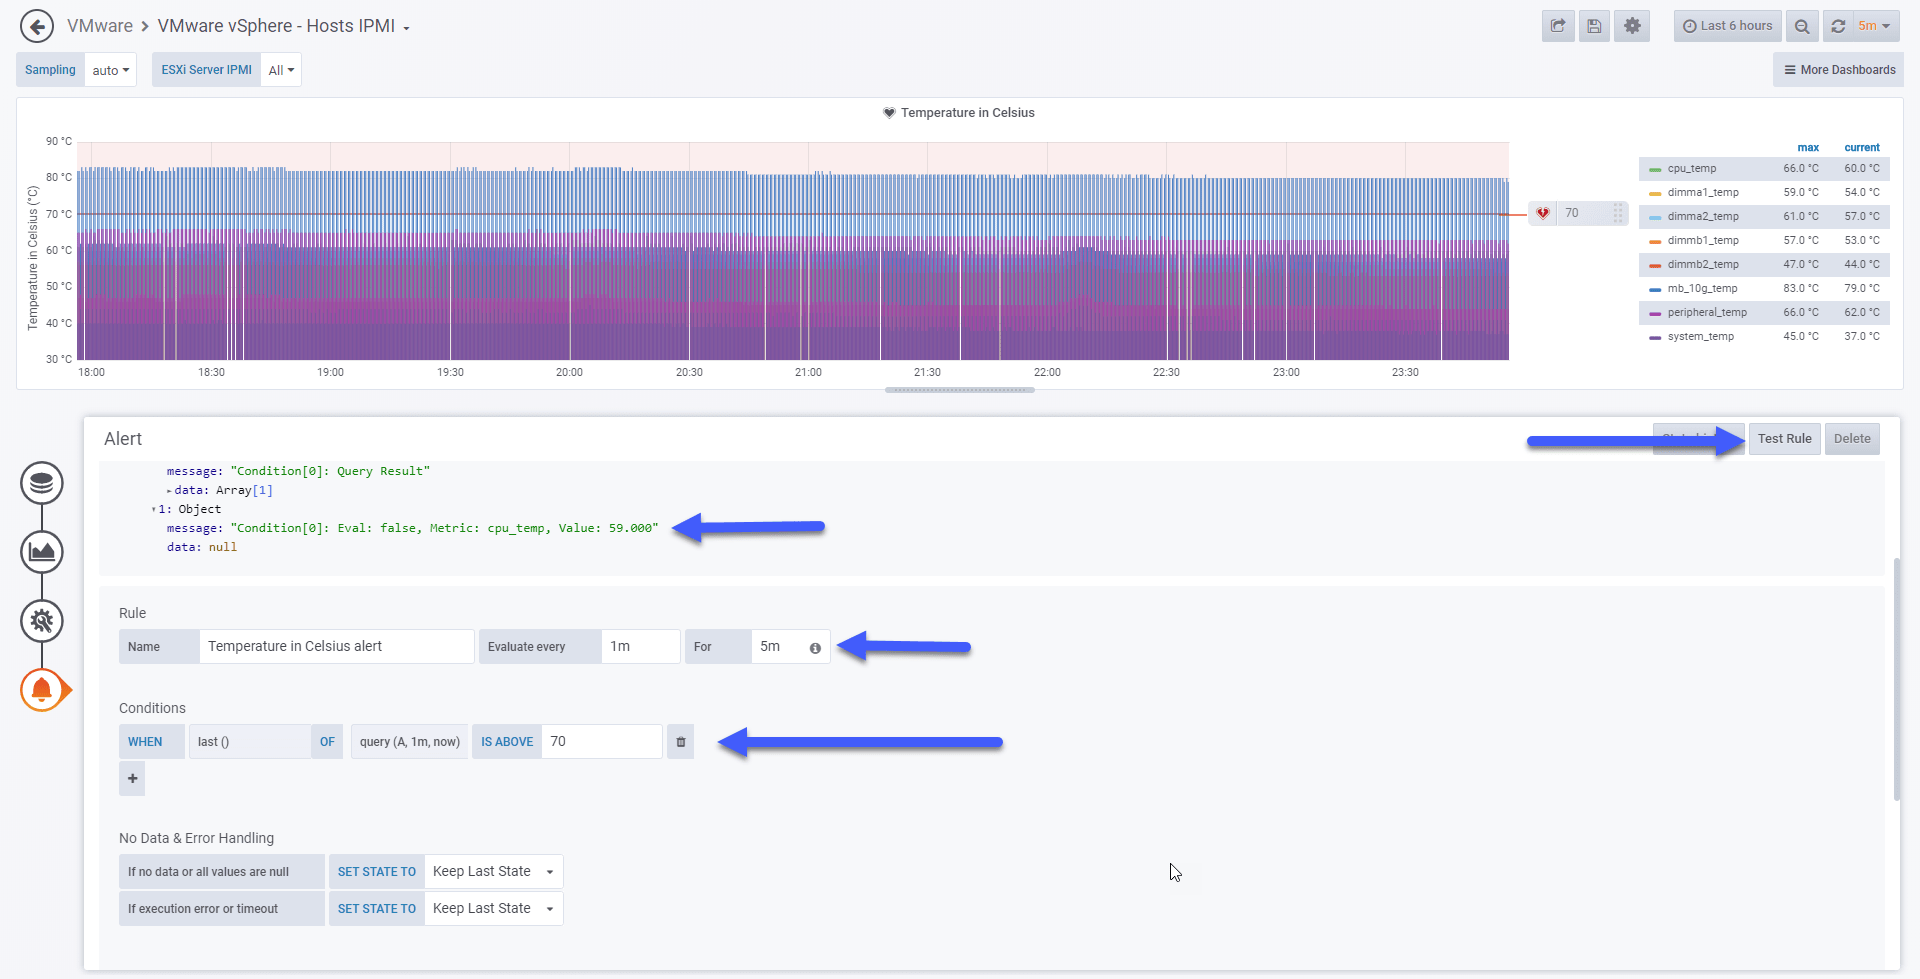 Once we have the alarm, and we can see the heart monitorizandolo monitorizandolo, if it turns green, everything is fine, if it turns red and breaks is that there are problems:
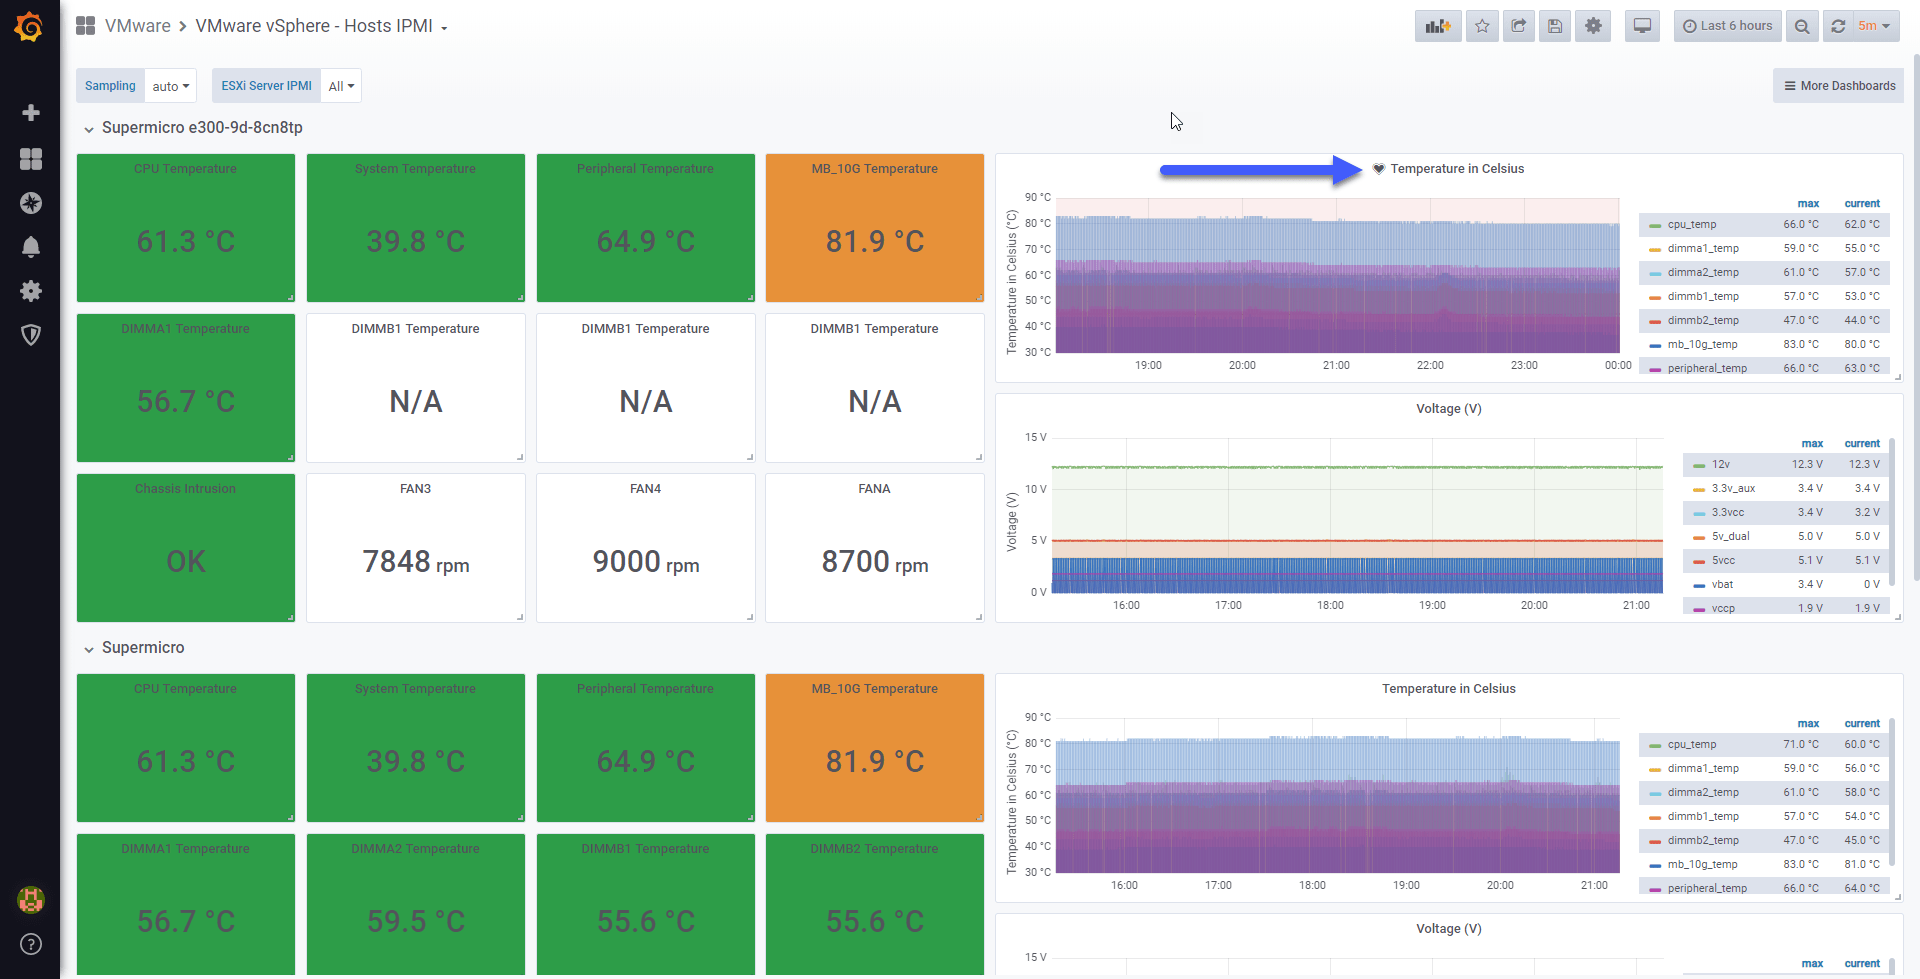 I have lowered the alarm temperature to 40C to see if it came, and here we can see the beautiful email that has come to me from this notification:
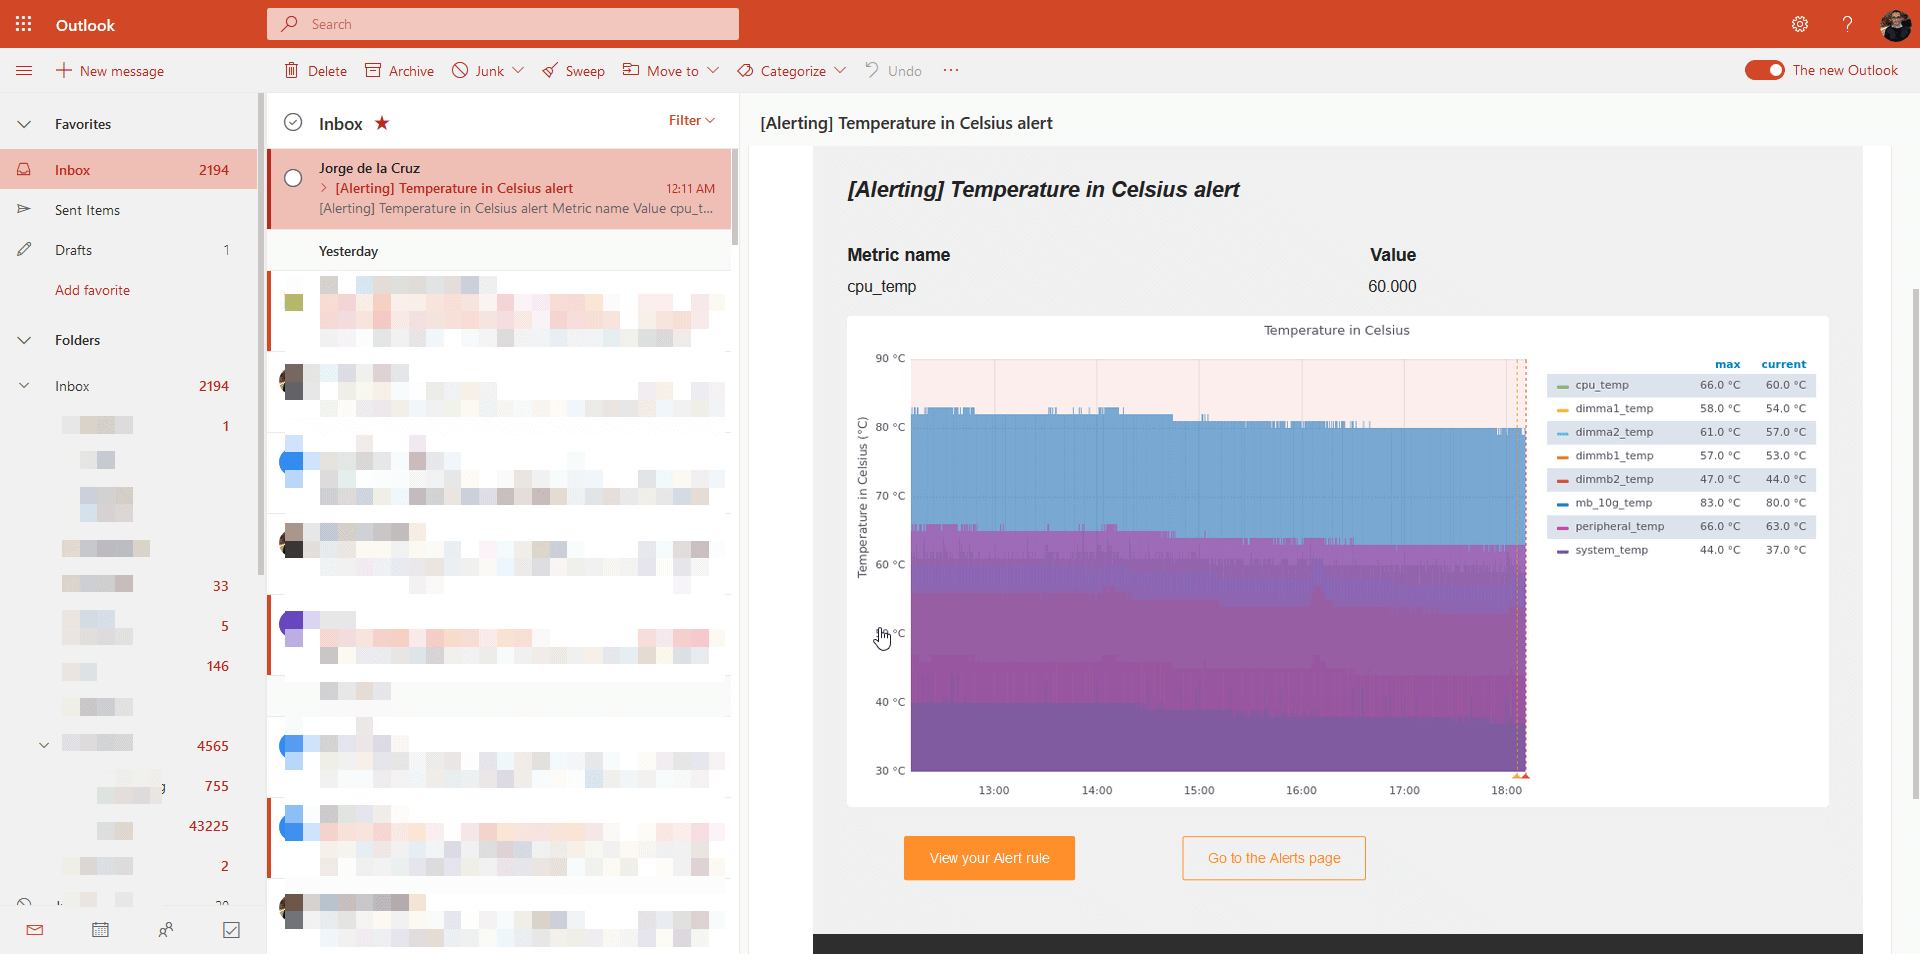 In addition now the graph shows the heart broken above, in addition to showing two vertical lines with the warning and the alert, and its value:
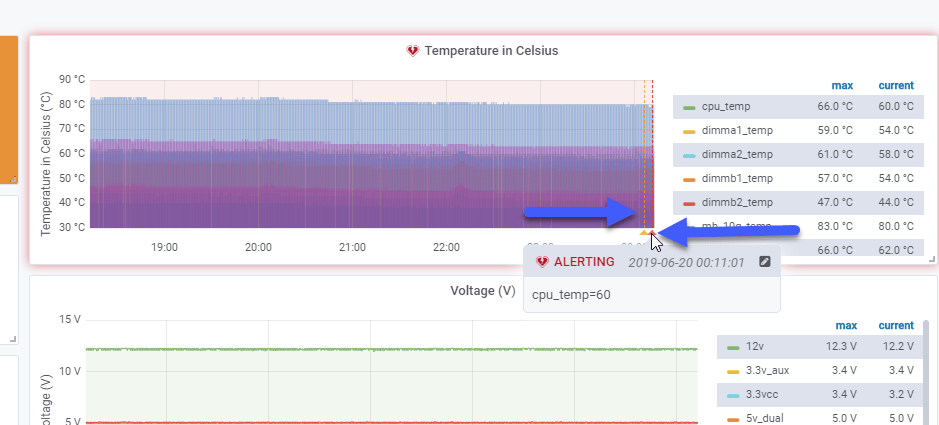 We could add the menu of alerts and place it somewhere on our dashboard, to have everything together, it would be such that so that we could put it somewhere on our dashboard, to have everything together, and so on:
 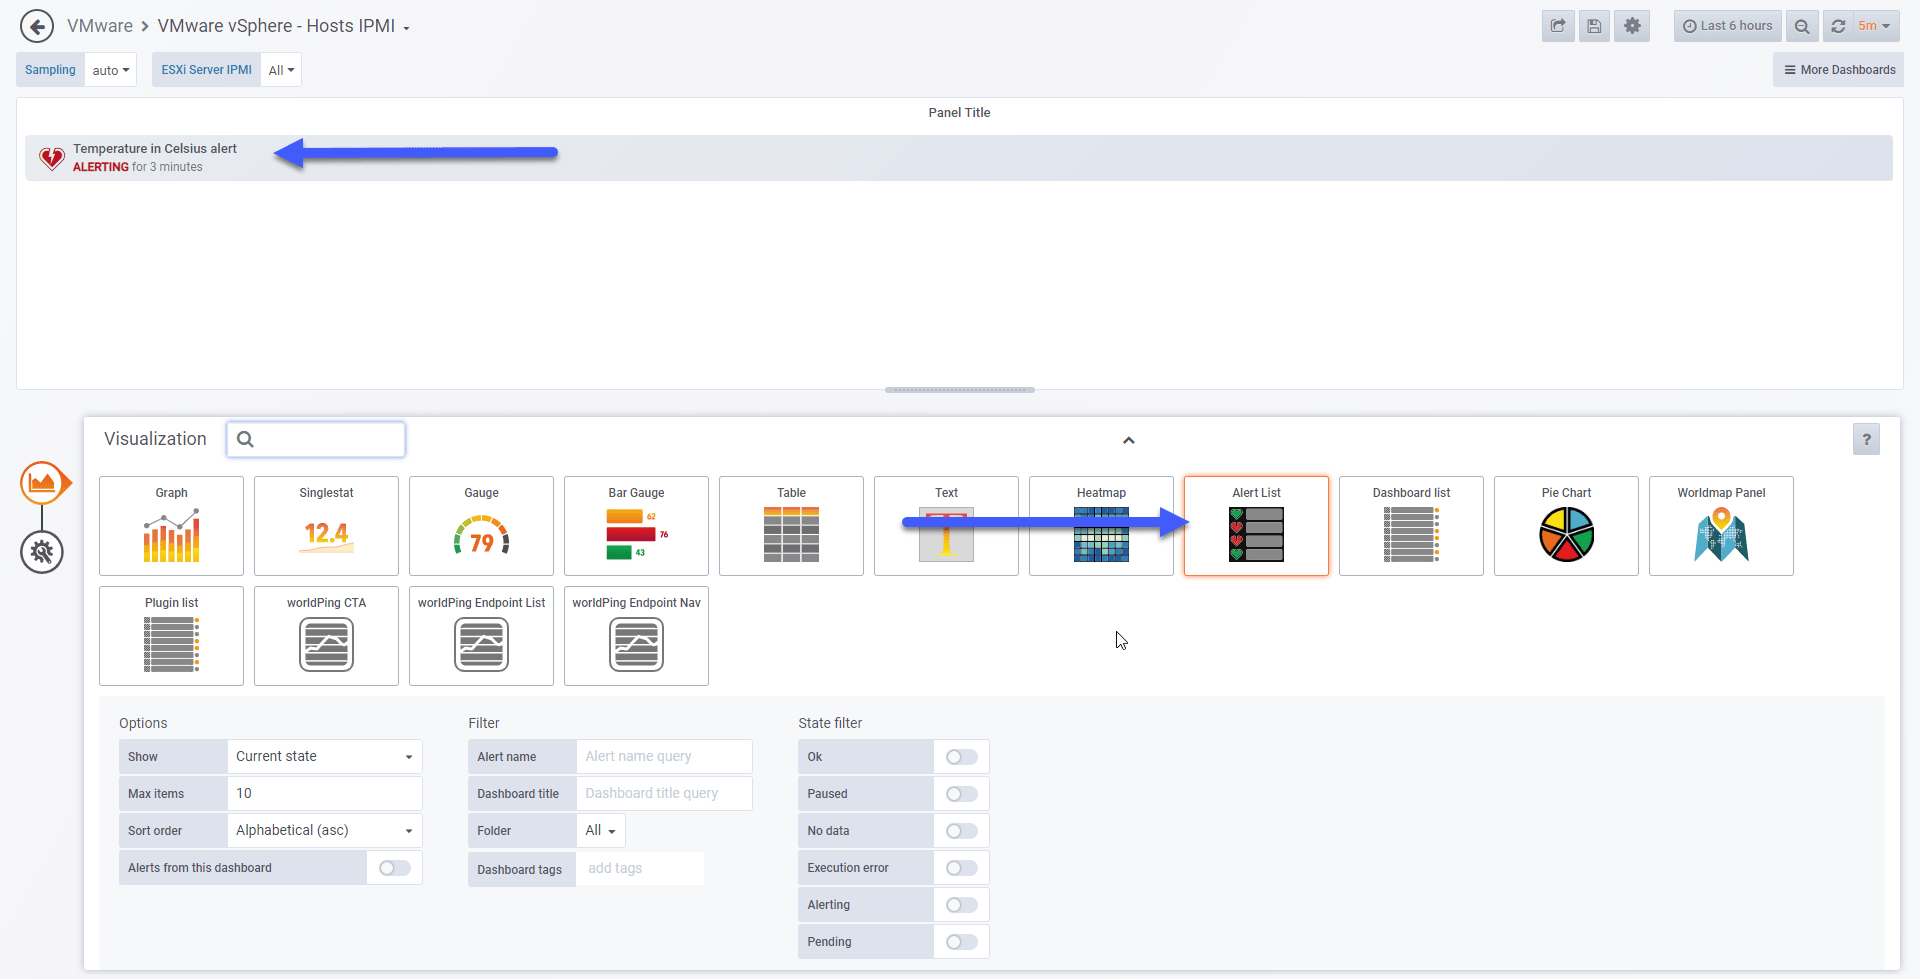 Finally, here you have the email of when the temperature has returned to a channel below the alarm interval:
 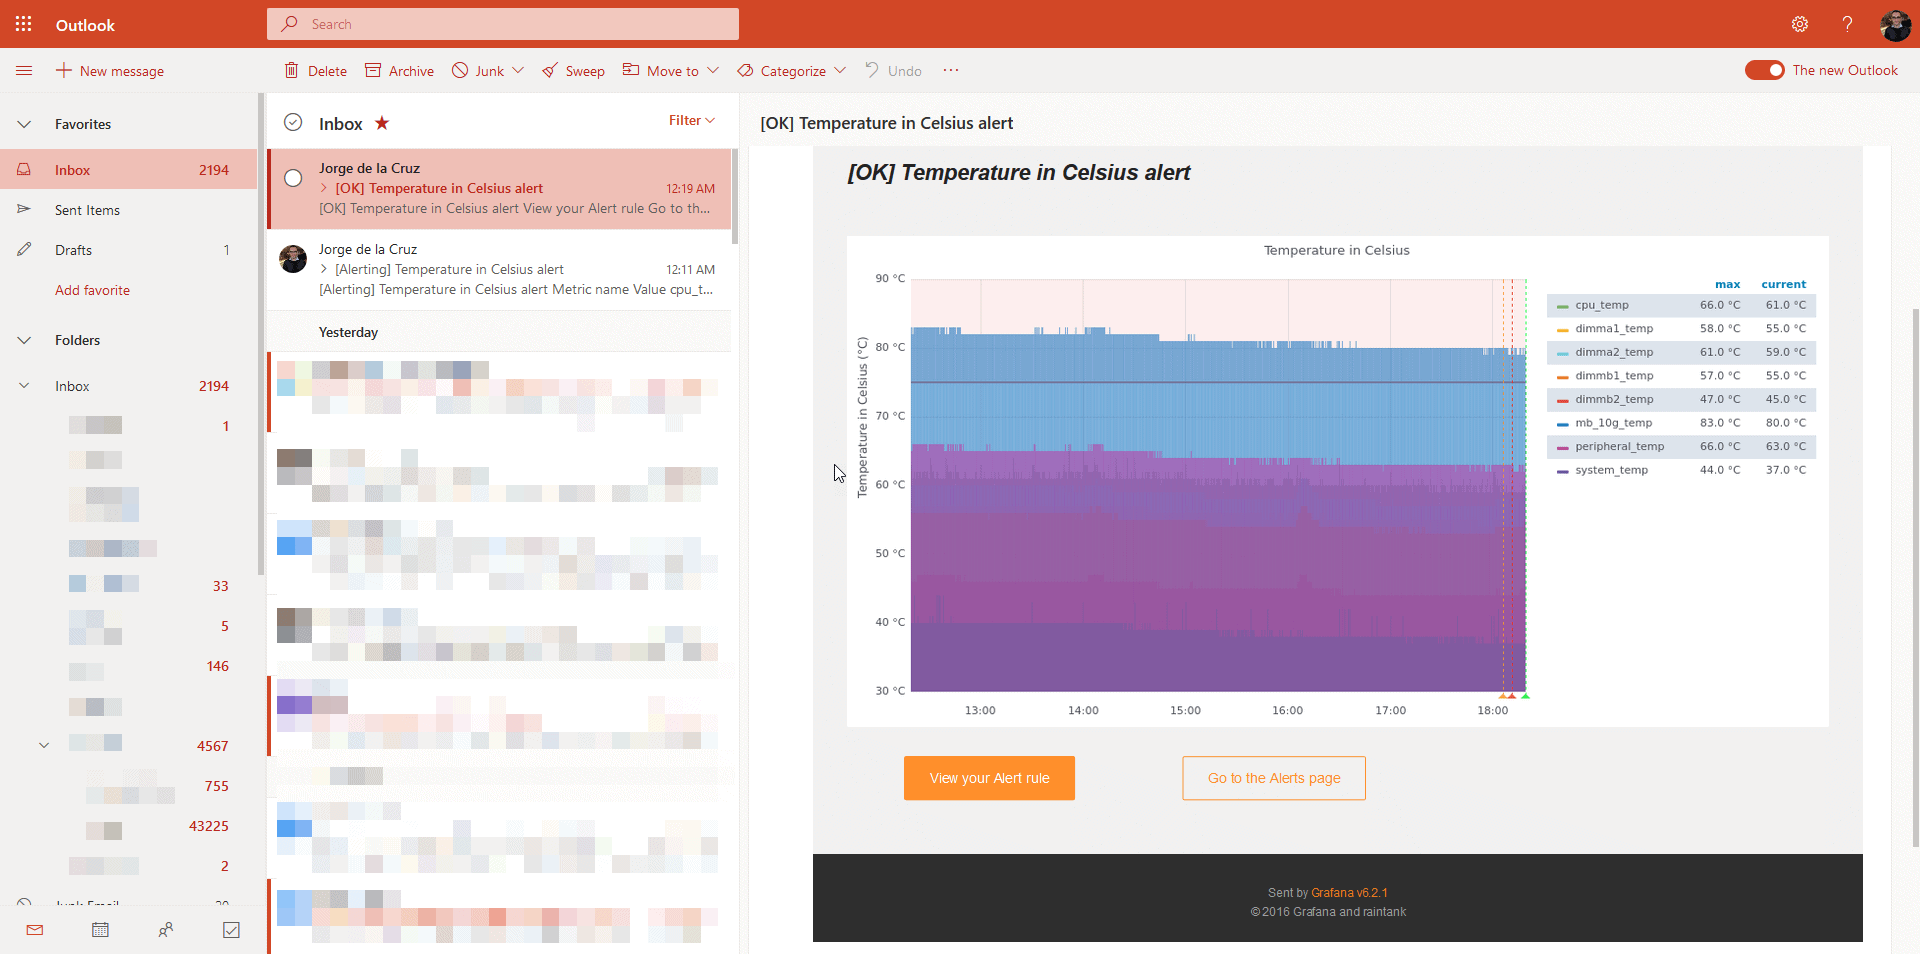 Nothing more friends, I hope you like it, and you will find it useful.
Hey Jorge
Been trying to get this working using an Office 365 email server but I get nothing but timeouts. Any thoughts on what I might try?
Running Grafana 7.3.1
#################################### SMTP / Emailing ##########################
[smtp]
enabled = true
host = smtp.office365.com:587
user = [email protected]
# If the password contains # or ; you have to wrap it with triple quotes. Ex “””#password;”””
password = “XXXXXXXXX”
cert_file =
key_file =
skip_verify = true
from_address = [email protected]
from_name = Grafana
# EHLO identity in SMTP dialog (defaults to instance_name)
;ehlo_identity = dashboard.example.com
Log file output:
t=2021-04-02T15:57:32-0500 lvl=info msg=”Sending alert notification to” logger=alerting.notifier.email addresses=[[email protected]] singleEmail=false
t=2021-04-02T15:57:42-0500 lvl=eror msg=”Failed to send alert notification email” logger=alerting.notifier.email error=”Failed to send notification to email addresses: [email protected]: read tcp XX.XX.XX.XX:39500->52.96.55.242:587: i/o timeout”
t=2021-04-02T15:57:42-0500 lvl=eror msg=”failed to send notification” logger=alerting.notifier uid= error=”Failed to send notification to email addresses: [email protected]: read tcp XX.XX.XX.XX:39500->52.96.55.242:587: i/o timeout”
t=2021-04-02T15:57:42-0500 lvl=eror msg=”failed to send notification” logger=alerting.notifier uid= error=”Failed to send notification to email addresses: [email protected]: read tcp XX.XX.XX.XX:39500->52.96.55.242:587: i/o timeout”
t=2021-04-02T15:57:42-0500 lvl=eror msg=”Failed to send alert notifications” logger=context userId=1 orgId=1 uname=admin error=”Failed to send notification to email addresses: [email protected]: read tcp XX.XX.XX.XX:39500->52.96.55.242:587: i/o timeout” remote_addr=10.200.19.189
t=2021-04-02T15:57:42-0500 lvl=eror msg=”Request Completed” logger=context userId=1 orgId=1 uname=admin method=POST path=/api/alert-notifications/test status=500 remote_addr=10.200.19.189 time_ms=10030 size=48 referer=http://sea-server-02.netscout.com:3000/alerting/notification/new
Hello, let me try tomorrow and will come back to you
Hey, Jorge. Have you had a chance to look at this? Thanks, Al