
 Greetings friends, since 2016 I have been showing you how to get the Perfect Dashboard using Grafana, InfluxDB, and Telegraf, we have come a long way together, and we have seen how to monitor a myriad of critical components, such as SSL, web page responses, VMware vSphere, Veeam, and much, much more.
Today we return to the basics, exploring some of the more visually appealing plugins, and giving it a more personal touch, how it is to analyze Cloudflare’s statistics where we have our blog, personal website, e-commerce, etc. cached.
Note: As the API has been deprecated. Cloudflare now publishes everything by GraphQL, I have corrected the whole script to make it work smoothly.
Once you have finished this tutorial, you will have something similar to this, it is better to give it several days or weeks to see the full potential: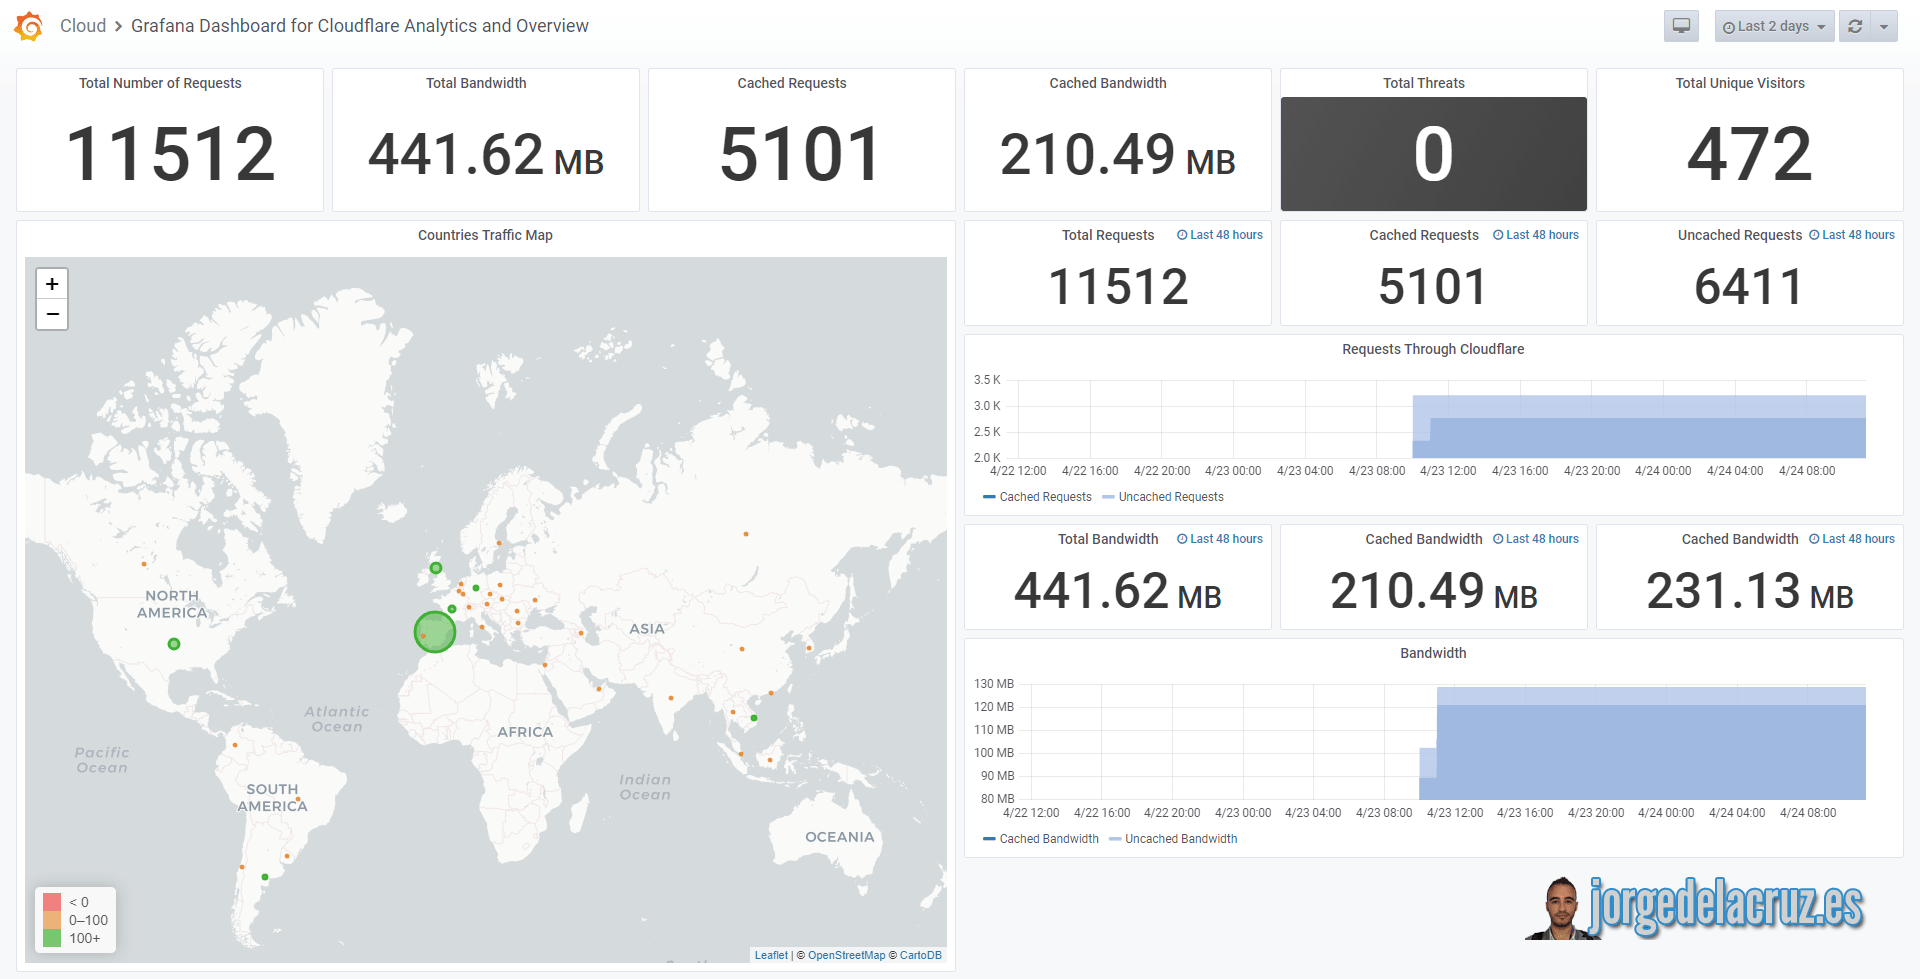
Telegraf, InfluxDB, and Grafana topology monitoring Cloudflare
Although I have already shown you on some occasions the diagram of how the monitoring would be using Telegraf, Grafana, and InfluxDB, I leave you again the diagram, this time monitoring Cloudflare:
Download and configure the script cloudflare-analytics.sh
Let’s download the script that will make all this work, we will download the latest version from the Github repository:
This shell script can be downloaded and run from the telegraf server, or influxDB, or any other Linux. We will have to edit the configuration parameters:
We need two pieces of information from Cloudflare that we can find as follows.
Take the Global API Key
Inside Cloudflare, we will go to the top menu, click on our account: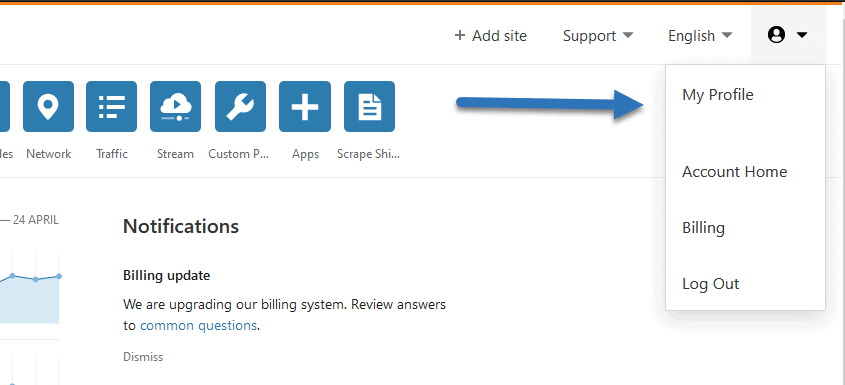 Once there, we’ll go to API Tokens – Global API Key, view
With this, we’ll have our API Key. I have not found any other way of working for now.
Find our Cloudflare Zone ID
To find the Cloudflare Zone ID, from our panel, we’ll select the domain we want and from there if we scroll, we’ll see the Zone ID: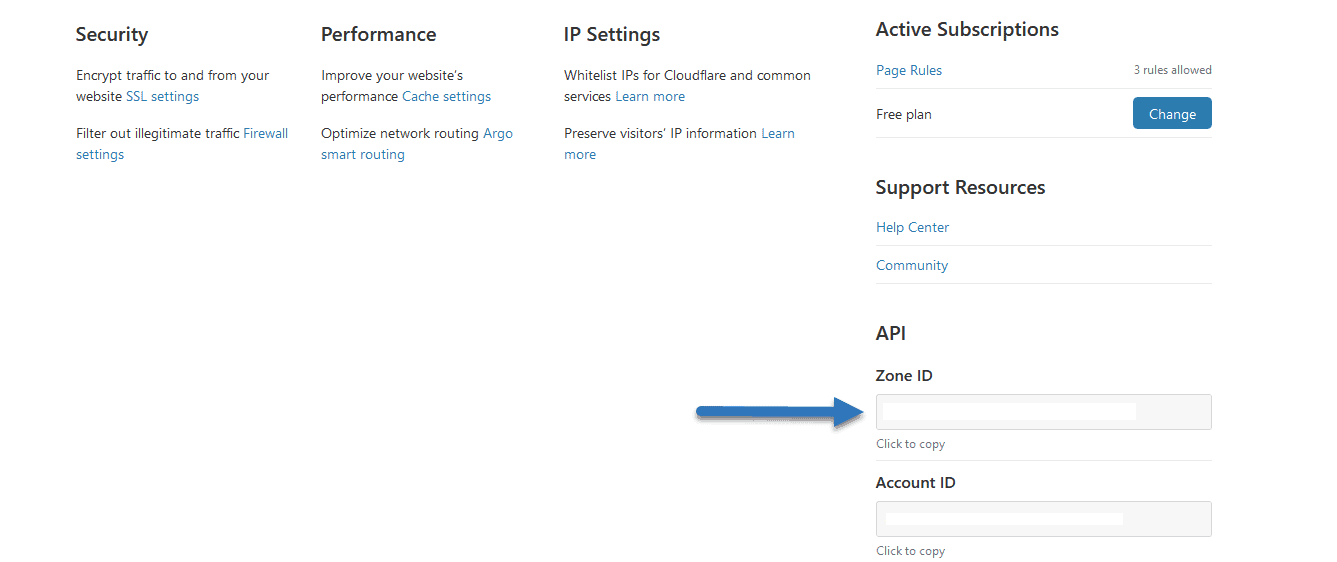 We already have our Zone ID too. We will make the script executable with this simple step:
chmod +x cloudflare-analytics.sh
We will make sure we have jq installed, an apt-get install jq or yum install jq if we use CentOS:
sudo apt-get install jq
And when we launch it, if everything went well, we’ll see what happens next:
HTTP/1.1 204 No Content
Content-Type: application/json
Request-Id: 53d8ecec-8611-11ea-bc44-0050569002da
X-Influxdb-Build: OSS
X-Influxdb-Version: 1.7.10
X-Request-Id: 53d8ecec-8611-11ea-bc44-0050569002da
Date: Fri, 24 Apr 2020 07:00:00 GMT
Besides, it would be nice to put it in the cron to run every day at 9 a.m:
crontab -e
0 9 * * * /home/oper/cloudflare-analytics.sh >> /var/log/cloudflare.log 2>&1
That’s it, we’re going to the next step.
Grafana Worldmap Panel
We will need to have installed the magnificent Worldmap Panel, as simple as from the Grafana server launch:
grafana-cli plugins install grafana-worldmap-panel
And restart Grafana’s service:
service grafana-server restart
And you’re all set.
Grafana Dashboards
I created a Dashboard from scratch by selecting the best requests to the database, finishing off colors, thinking about graphics, and how to display them, and everything is automated so that it fits our environment without any problem and without having to edit anything manually. The Dashboard can be found here, once imported, you will see all the stats:
Import Grafana Dashboards easily
So that you don’t have to waste hours configuring a new Dashboard, and ingesting and debugging you want, I have already created four wonderful Dashboards with everything you need to monitor our environment in a very simple way, you will be like the image I showed you above. Select the name you want and enter the ID: 12167, which is the unique ID of the Dashboard, or the URL:
We’ll have everything popping up without any problem:
That’s all folks, if you want to follow the full Blog series about Grafana, InfluxDB, Telegraf, please click on the next links:
- En busca del Dashboard perfecto: InfluxDB, Telegraf y Grafana – Parte I (Instalando InfluxDB, Telegraf y Grafana)
- En busca del Dashboard perfecto: InfluxDB, Telegraf y Grafana – Parte II (Instalar agente Telegraf en Nodos remotos Linux)
- En busca del Dashboard perfecto: InfluxDB, Telegraf y Grafana – Parte III Integración con PRTG
- En busca del Dashboard perfecto: InfluxDB, Telegraf y Grafana – Parte IV (Instalar agente Telegraf en Nodos remotos Windows)
- En busca del Dashboard perfecto: InfluxDB, Telegraf y Grafana – Parte V (Activar inputs específicos, Red, MySQL/MariaDB, Nginx)
- En busca del Dashboard perfecto: InfluxDB, Telegraf y Grafana – Parte VI (Monitorizando Veeam)
- En busca del Dashboard perfecto: InfluxDB, Telegraf y Grafana – Parte VII (Monitorizar vSphere)
- En busca del Dashboard perfecto: InfluxDB, Telegraf y Grafana – Parte VIII (Monitorizando Veeam con Enterprise Manager)
- En busca del Dashboard perfecto: InfluxDB, Telegraf y Grafana – Parte IX (Monitorizando Zimbra Collaboration)
- En busca del Dashboard perfecto: InfluxDB, Telegraf y Grafana – Parte X (Grafana Plugins)
- En busca del Dashboard perfecto: InfluxDB, Telegraf y Grafana – Parte XI
- Looking for the Perfect Dashboard: InfluxDB, Telegraf and Grafana – Part XII (Native Telegraf Plugin for vSphere)
- Looking for the Perfect Dashboard: InfluxDB, Telegraf and Grafana – Part XIII (Veeam Backup for Microsoft Office 365 v4)
- Looking for the Perfect Dashboard: InfluxDB, Telegraf and Grafana – Part XIV – Veeam Availability Console
- Looking for the Perfect Dashboard: InfluxDB, Telegraf and Grafana – Part XV (IPMI Monitoring of our ESXi Hosts)
- Looking for Perfect Dashboard: InfluxDB, Telegraf and Grafana – Part XVI (Performance and Advanced Security of Veeam Backup for Microsoft Office 365)
- Looking for the Perfect Dashboard: InfluxDB, Telegraf and Grafana – Part XVII (Showing Dashboards on Two Monitors Using Raspberry Pi 4)
- En busca del Dashboard perfecto: InfluxDB, Telegraf y Grafana – Parte XVIII – Monitorizar temperatura y estado de Raspberry Pi 4
- Looking for the Perfect Dashboard: InfluxDB, Telegraf and Grafana – Part XIX (Monitoring Veeam with Enterprise Manager) Shell Script
- Looking for the perfect Dashboard: InfluxDB, Telegraf, and Grafana – Part XX (Monitoring SSL Certificates x.509)
- En busca del Dashboard perfecto: InfluxDB, Telegraf y Grafana – Parte XXI (Monitorizando HTTP Responses)
- Looking for the Perfect Dashboard: InfluxDB, Telegraf, and Grafana – Part XXII (Monitoring Cloudflare, include beautiful Maps)
As a heads up, your .sh file has the incorrect filename. You’re missing the second “L” in cloudflare-analytics.sh
I’m getting an error after trying to load the Grafana dashboard:
Failed create dashboard model
undefined is not iterable (cannot read property Symbol(Symbol.iterator))
Any idea what this is?
is this still working? its not storing data for me anymore…
Hello, let me try, that API was EOL, so not sure if they removed it, they want you to pay 🙁
have it working since a couple of weeks, dunno if its a db problem on my side cause requests seems to work just fine…
sudo sh cloudflare-analytics.sh
cloudflare-analytics.sh: 38: let: not found
date: invalid date ‘@’
cloudflare-analytics.sh: 111: declare: not found
jq: error (at :1): Cannot iterate over null (null)
Hello,
Are you using the latest script? And which OS you running? Can you try ./ instead of sh?
Hi Jorge – thank you with ./ it worked just fine, Just a general question if dont state a zone ID in the script would it be possible then to pick all data from all zones i have in Cloudflare?
– also generally spoken thank you for your fantastic work! your instructions saved me many days of trial and error and keep inspiring me to try out new things…
Hello Franz,
I guess that can be programmed to look at all the zones, but at the moment I am not sure, as the Graph is quite strict to select Zone ID, etc. MY bet is that before you run the other graph calls, you first list all the zones you have access to, and then do a loop of the graphql and all the code, per zone, that should work.
I am really glad to see that this work helped you!
Best regards
sudo sh cloudflare-analytics.sh
cloudflare-analytics.sh: 38: let: date not found
: invalid date ‘@’
./cloudflare-analytics.sh
it doesn’t bring an error but it doesn’t load any graphics in grafana, it’s possible to have some log for debug
Hello, yes, of course, you can try grabbing some of the queries and use them in the console itself.
Give them a try and let me know.
Hii, i got error on latest script “jq: error (at :1): Cannot iterate over null (null)”
Hello,
Are you using the latest version of the script, and you copied/paste correctly all the ids, etc? I need to give it another try soon.
Sinds the latest update of InfluxDB 2.0 the script won’t work anymore 🙁
{“code”:”unauthorized”,”message”:”Unauthorized”}Writing stats for day 2022-09-02
Writing Zone data per Country to InfluxDB cloudflare_analytics_country
HTTP/1.1 401 Unauthorized
Content-Type: application/json; charset=utf-8
X-Influxdb-Build: OSS
X-Influxdb-Version: v2.4.0
X-Platform-Error-Code: unauthorized
Date: Sun, 04 Sep 2022 11:59:06 GMT
Content-Length: 48
Since this is the only cloudflare dashboard that makes sense and you are the grafana guru here my questions:
I think this got together with user password combo for database. Telegraf is not using this anymore. It uses the api key. Can we make it work with api key for the database?
Thanks in advance,
Hello,
What have you tried, and what is not working exactly?
I don’t have user & and password combo for telegraf database and tried with influx admin user and password without success. I only have telegraf bucket and it’s api key. Couldn’t find any user & pass combo. Beyond this I think cloudflare is using updated API but this will be another subject i think.
Forgot to mention:
Influx 2.7.1
Grafana v10.0.3
And latest version of telegraf
Yes, what is happening is that this dashboard have not been updated to Flux, hence the old way of doing it.
Will see if I find time to update it.
I will happliy wait patiently as usual mate, take your time. Thank you
Hello again, any updates on flux migration? Did you have any time to spare to us 😀