• Skip to main content
  • Skip to secondary menu
  • Skip to primary sidebar
The Blog of Jorge de la Cruz

The Blog of Jorge de la Cruz

Everything about VMware, Veeam, InfluxData, Grafana, Zimbra, etc.

  • Home
  • VMWARE
  • VEEAM
    • Veeam Content Recap 2021
    • Veeam v11a
      • Veeam Backup and Replication v11a
    • Veeam Backup for AWS
      • Veeam Backup for AWS v4
    • Veeam Backup for Azure
      • Veeam Backup for Azure v3
    • VeeamON 2021
      • Veeam Announces Support for Red Hat Enterprise Virtualization (RHEV/KVM)
      • Veeam announces enhancements for new versions of Veeam Backup for AWS v4/Azure v3/GVP v2
      • VBO v6 – Self-Service Portal and Native Integration with Azure Archive and AWS S3 Glacier
  • Grafana
    • Part I (Installing InfluxDB, Telegraf and Grafana on Ubuntu 20.04 LTS)
    • Part VIII (Monitoring Veeam using Veeam Enterprise Manager)
    • Part XII (Native Telegraf Plugin for vSphere)
    • Part XIII – Veeam Backup for Microsoft Office 365 v4
    • Part XIV – Veeam Availability Console
    • Part XV – IPMI Monitoring of our ESXi Hosts
    • Part XVI – Performance and Advanced Security of Veeam Backup for Microsoft Office 365
    • Part XVII – Showing Dashboards on Two Monitors Using Raspberry Pi 4
    • Part XIX (Monitoring Veeam with Enterprise Manager) Shell Script
    • Part XXII (Monitoring Cloudflare, include beautiful Maps)
    • Part XXIII (Monitoring WordPress with Jetpack RESTful API)
    • Part XXIV (Monitoring Veeam Backup for Microsoft Azure)
    • Part XXV (Monitoring Power Consumption)
    • Part XXVI (Monitoring Veeam Backup for Nutanix)
    • Part XXVII (Monitoring ReFS and XFS (block-cloning and reflink)
    • Part XXVIII (Monitoring HPE StoreOnce)
    • Part XXIX (Monitoring Pi-hole)
    • Part XXXI (Monitoring Unifi Protect)
    • Part XXXII (Monitoring Veeam ONE – experimental)
    • Part XXXIII (Monitoring NetApp ONTAP)
    • Part XXXIV (Monitoring Runecast)
  • Nutanix
  • ZIMBRA
  • PRTG
  • LINUX
  • MICROSOFT

VMware: How to extract Temperature information from ESXi for ARM, send it to InfluxDB, and display it with Grafana

14th November 2020 - Written in: opensource, vmware

Greetings friends, I told you a few weeks ago what VMware had just launched, and that it was going to revolutionize the world of virtualization and make it, even more, accessible in many new use cases with the new ESXi for ARM.

Well, one of the things that worried me the most, I think I mentioned it in the video, was being able to control the temperature of the Raspberry Pi with ESXi for ARM, as ESXi usually gets all this data from the IPMI, iDRAC, iLO, etc.

But luckily we have a hero (Tom Hebel) who works in VMware and who has compiled a native driver to extract this information, besides being able to interact with many more things.

  • https://github.com/thebel1/thpimon

Diagram of how this solution works

It’s fine, I think, just creating a .json that telegraf then parses and writes to InfluxDB, but if I find a better way to do it, everything will get better, here the diagram:

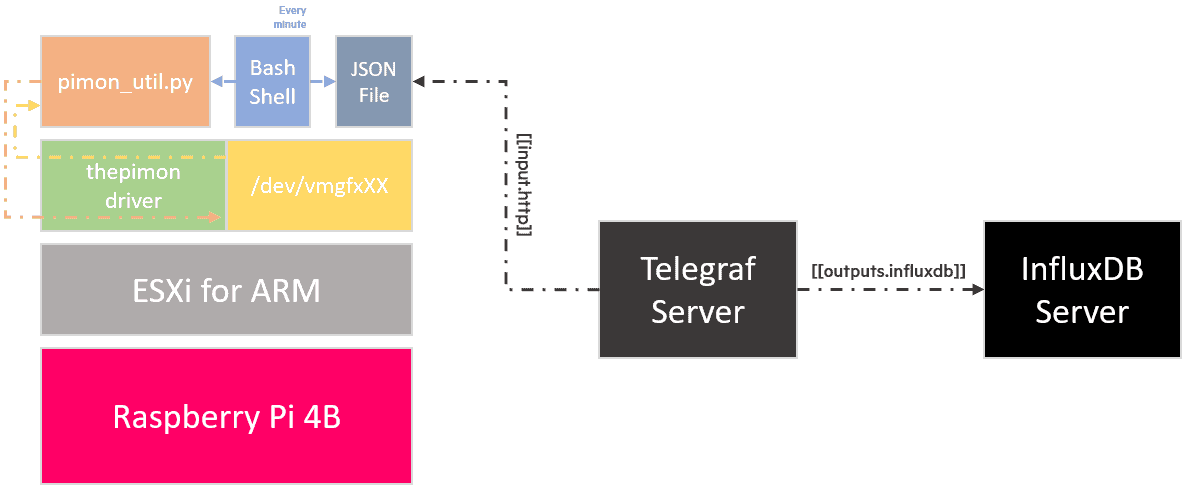
Download and install the ESXi for ARM Native Driver for Raspberry Pi

I don’t know if it needs to be said, but all these steps are obviously for an unsupported product, created by the Community 🙂

To download the plugin from our ESXi over SSH, we will first have to disable the firewall so that it can connect through the ESXi http client, as well as having to download the system security so that we can install this plugin:

Plain text
Copy to clipboard
Open code in new window
EnlighterJS 3 Syntax Highlighter
esxcli software acceptance set --level=CommunitySupported
esxcli network firewall ruleset set -e true -r httpClient
esxcli software acceptance set --level=CommunitySupported esxcli network firewall ruleset set -e true -r httpClient
esxcli software acceptance set --level=CommunitySupported
esxcli network firewall ruleset set -e true -r httpClient

Once we have made these changes, we will proceed to download the package, directly from Tom’s GitHub, take a look at it for you, as it may have new versions:

Plain text
Copy to clipboard
Open code in new window
EnlighterJS 3 Syntax Highlighter
wget https://github.com/thebel1/thpimon/raw/main/build/vib/thpimon-0.1.0-1OEM.701.1.0.40650718.aarch64.vib

Fantastic, let’s proceed with the installation of the Raspberry Pi driver for ESXi for ARM:

Plain text
Copy to clipboard
Open code in new window
EnlighterJS 3 Syntax Highlighter
esxcli software vib install -v /thpimon-0.1.0-1OEM.701.1.0.40650718.aarch64.vib

This should show you something similar to this, after a few seconds or even a minute:

Plain text
Copy to clipboard
Open code in new window
EnlighterJS 3 Syntax Highlighter
Installation Result
Message: Operation finished successfully.
Reboot Required: false
VIBs Installed: THX_bootbank_thpimon_0.1.0-1OEM.701.1.0.40650718
VIBs Removed:
VIBs Skipped:
Installation Result Message: Operation finished successfully. Reboot Required: false VIBs Installed: THX_bootbank_thpimon_0.1.0-1OEM.701.1.0.40650718 VIBs Removed: VIBs Skipped:
Installation Result
Message: Operation finished successfully.
Reboot Required: false
VIBs Installed: THX_bootbank_thpimon_0.1.0-1OEM.701.1.0.40650718
VIBs Removed:
VIBs Skipped:

Although the VIB says not to reboot, it is really recommended, so you know:

Plain text
Copy to clipboard
Open code in new window
EnlighterJS 3 Syntax Highlighter
reboot
reboot
reboot

Once we reboot, we check that we have a new device in /dev/vmgfxXX in my case is /dev/vmgfx32.

Note: Put this in a scratch partition or in some datastore where the ESXi can access to keep it even if we reboot.

Now we will download the example of monitoring the RPi that our friend Tom has:

Plain text
Copy to clipboard
Open code in new window
EnlighterJS 3 Syntax Highlighter
mkdir /scratch/downloads
cd /scratch/downloads
wget https://github.com/thebel1/thpimon/archive/main.zip
unzip main.zip
mkdir /scratch/downloads cd /scratch/downloads wget https://github.com/thebel1/thpimon/archive/main.zip unzip main.zip
mkdir /scratch/downloads
cd /scratch/downloads
wget https://github.com/thebel1/thpimon/archive/main.zip
unzip main.zip

Before launching the script, we will go with vi to edit the following file /scratch/downloads/thpimon-main/pyUtil/pimonLib/__init__.py

Plain text
Copy to clipboard
Open code in new window
EnlighterJS 3 Syntax Highlighter
vi /scratch/downloads/thpimon-main/pyUtil/pimonLib/__init__.py

And we will modify the line called PIMON_DEVICE_PATH with our new device, like this:

Plain text
Copy to clipboard
Open code in new window
EnlighterJS 3 Syntax Highlighter
################################################################################
import math
import struct
import fcntl
#########################################################################
PIMON_DEVICE_PATH = '/dev/vmgfx32'
#########################################################################
RPIQ_BUFFER_LEN = 32
RPIQ_PROCESS_REQ = 0
################################################################################ import math import struct import fcntl ######################################################################### PIMON_DEVICE_PATH = '/dev/vmgfx32' ######################################################################### RPIQ_BUFFER_LEN = 32 RPIQ_PROCESS_REQ = 0
################################################################################
import math
import struct
import fcntl
#########################################################################
PIMON_DEVICE_PATH = '/dev/vmgfx32'
#########################################################################
RPIQ_BUFFER_LEN = 32
RPIQ_PROCESS_REQ = 0

We are going to test that everything works, we will launch the following script, which should give us the necessary information:

Plain text
Copy to clipboard
Open code in new window
EnlighterJS 3 Syntax Highlighter
./thpimon-main/pyUtil/pimon_util.py
Firmware Revision: 0x5f440c10
Board Model: 0
Board Revision: 0xd03114
Board MAC Address: f7:12:b1:32:a6:dc
Board Serial: 0x000000ab401f61
Temp: 38.0 (deg. C)
./thpimon-main/pyUtil/pimon_util.py Firmware Revision: 0x5f440c10 Board Model: 0 Board Revision: 0xd03114 Board MAC Address: f7:12:b1:32:a6:dc Board Serial: 0x000000ab401f61 Temp: 38.0 (deg. C)
./thpimon-main/pyUtil/pimon_util.py
Firmware Revision: 0x5f440c10
Board Model: 0
Board Revision: 0xd03114
Board MAC Address: f7:12:b1:32:a6:dc
Board Serial: 0x000000ab401f61
Temp: 38.0 (deg. C)

We already have the most important part! Thank you very much, again Tom Hebel for your great work.

Download Script to collect information and produce the .json

It’s time to download and configure the simple script I created, we can download it from here, directly to the ESXi for ARM:

Plain text
Copy to clipboard
Open code in new window
EnlighterJS 3 Syntax Highlighter
cd /scratch/downloads/
wget https://raw.githubusercontent.com/jorgedlcruz/esxi_arm-grafana/main/esxi-arm-rpi_grafana.sh
cd /scratch/downloads/ wget https://raw.githubusercontent.com/jorgedlcruz/esxi_arm-grafana/main/esxi-arm-rpi_grafana.sh
cd /scratch/downloads/
wget https://raw.githubusercontent.com/jorgedlcruz/esxi_arm-grafana/main/esxi-arm-rpi_grafana.sh

Some values must be edited in order to make it work properly, these values:

Plain text
Copy to clipboard
Open code in new window
EnlighterJS 3 Syntax Highlighter
# Configurations
##
thepimonPath="/scratch/downloads/thpimon-main/pyUtil/pimon_util.py"
# Configurations ## thepimonPath="/scratch/downloads/thpimon-main/pyUtil/pimon_util.py"
# Configurations
##
thepimonPath="/scratch/downloads/thpimon-main/pyUtil/pimon_util.py"

We will make the script executable, as always:

Plain text
Copy to clipboard
Open code in new window
EnlighterJS 3 Syntax Highlighter
chmod +x esxi-arm-rpi_grafana.sh

And we will launch the script to see what works:

Plain text
Copy to clipboard
Open code in new window
EnlighterJS 3 Syntax Highlighter
./esxi-arm-rpi_grafana.sh
Building the JSON file
All good, now you can go to https://esxi-zlon-rpi-001.jorgedelacruz.es/ui/pimonarm.json and use the JSON on your favourite Monitoring system
./esxi-arm-rpi_grafana.sh Building the JSON file All good, now you can go to https://esxi-zlon-rpi-001.jorgedelacruz.es/ui/pimonarm.json and use the JSON on your favourite Monitoring system
./esxi-arm-rpi_grafana.sh
Building the JSON file
All good, now you can go to https://esxi-zlon-rpi-001.jorgedelacruz.es/ui/pimonarm.json and use the JSON on your favourite Monitoring system

With this done, now you have a valid .json ANYTHING can take and parse, as long as they have access over HTTPS to the ESXi for ARM. Example of the .JSON:

Plain text
Copy to clipboard
Open code in new window
EnlighterJS 3 Syntax Highlighter
curl https://esxi-zlon-rpi-001.jorgedelacruz.es/ui/pimonarm.json -k
{
"thpimon": {
"title": "The simplest way to take data out of the ESXi",
"firmware": "0x5f440c10",
"boardmodel": "0",
"boardrevision": "0xd03114",
"boardserial": "0x000000ab401f61",
"boardtemp": "32.0",
"hostname": "esxi-zlon-rpi-001.jorgedelacruz.es"
}
}
curl https://esxi-zlon-rpi-001.jorgedelacruz.es/ui/pimonarm.json -k { "thpimon": { "title": "The simplest way to take data out of the ESXi", "firmware": "0x5f440c10", "boardmodel": "0", "boardrevision": "0xd03114", "boardserial": "0x000000ab401f61", "boardtemp": "32.0", "hostname": "esxi-zlon-rpi-001.jorgedelacruz.es" } }
curl https://esxi-zlon-rpi-001.jorgedelacruz.es/ui/pimonarm.json -k
{
    "thpimon": {
        "title": "The simplest way to take data out of the ESXi",
        "firmware": "0x5f440c10",
        "boardmodel": "0",
        "boardrevision": "0xd03114",
        "boardserial": "0x000000ab401f61",
        "boardtemp": "32.0",
        "hostname": "esxi-zlon-rpi-001.jorgedelacruz.es"
    }
}

I am using telegraf, so let’s take a look.

How to create a cron to run the script every minute

Many of the changes we have made will be lost when restarting, including the cron, but I leave it for you to have it at hand, we will go to the file /var/spool/cron/crontabs/root and edit it:

Plain text
Copy to clipboard
Open code in new window
EnlighterJS 3 Syntax Highlighter
vi /var/spool/cron/crontabs/root

We will add the following at the end of it, you can point to the route where you have the script:

Plain text
Copy to clipboard
Open code in new window
EnlighterJS 3 Syntax Highlighter
*/1 * * * * /scratch/downloads/esxi-arm-rpi_grafana.sh

Okay, that’s it, every minute we will have a fresh .json ready to be parsed.

Telegraf configuration to parse the new .json and send it to InfluxDB

This time I am going to use the always versatile inputs.http, to parse directly from the .json, the config can not be easier, I have created a new file under /etc/telegraf/telegraf.d/pimonarm.conf with this inside:

Plain text
Copy to clipboard
Open code in new window
EnlighterJS 3 Syntax Highlighter
[[inputs.http]]
#URL for ESXi for ARM data in JSON format
urls = ["https://esxi-zlon-rpi-001.jorgedelacruz.es/ui/pimonarm.json"]
method = "GET"
#Overwrite measurement name from default `http` to `vsphere_esxi_arm`
name_override = "vsphere_esxi_arm"
#Exclude url and host items from tags
tagexclude = ["url", "host"]
#Data from HTTP in JSON format
data_format = "json"
#Parse `thpimon` array only
json_query = "thpimon"
#Set pimon metadata as tags
tag_keys = ["hostname", "firmware", "boardmodel", "boardrevision", "boardserial"]
#JSON values to set as string fields
json_string_fields = ["boardtemp"]
insecure_skip_verify = true
[[inputs.http]] #URL for ESXi for ARM data in JSON format urls = ["https://esxi-zlon-rpi-001.jorgedelacruz.es/ui/pimonarm.json"] method = "GET" #Overwrite measurement name from default `http` to `vsphere_esxi_arm` name_override = "vsphere_esxi_arm" #Exclude url and host items from tags tagexclude = ["url", "host"] #Data from HTTP in JSON format data_format = "json" #Parse `thpimon` array only json_query = "thpimon" #Set pimon metadata as tags tag_keys = ["hostname", "firmware", "boardmodel", "boardrevision", "boardserial"] #JSON values to set as string fields json_string_fields = ["boardtemp"] insecure_skip_verify = true
[[inputs.http]]
#URL for ESXi for ARM data in JSON format
urls = ["https://esxi-zlon-rpi-001.jorgedelacruz.es/ui/pimonarm.json"]
method = "GET"
#Overwrite measurement name from default `http` to `vsphere_esxi_arm`
name_override = "vsphere_esxi_arm"

#Exclude url and host items from tags
tagexclude = ["url", "host"]

#Data from HTTP in JSON format
data_format = "json"

#Parse `thpimon` array only
json_query = "thpimon"

#Set pimon metadata as tags
tag_keys = ["hostname", "firmware", "boardmodel", "boardrevision", "boardserial"]

#JSON values to set as string fields
json_string_fields = ["boardtemp"]

insecure_skip_verify = true

Then we can test it with the next command:

Plain text
Copy to clipboard
Open code in new window
EnlighterJS 3 Syntax Highlighter
telegraf --config /etc/telegraf/telegraf.d/pimonarm.conf --test

If all good, you will see something like this:

Plain text
Copy to clipboard
Open code in new window
EnlighterJS 3 Syntax Highlighter
2020-11-15T00:17:41Z I! Starting Telegraf 1.16.1
> vsphere_esxi_arm,boardmodel=0,boardrevision=0xd03114,boardserial=0x000000ab401f61,firmware=0x5f440c10,hostname=esxi-zlon-rpi-001.jorgedelacruz.es boardtemp="37.0" 1605399462000000000
2020-11-15T00:17:41Z I! Starting Telegraf 1.16.1 > vsphere_esxi_arm,boardmodel=0,boardrevision=0xd03114,boardserial=0x000000ab401f61,firmware=0x5f440c10,hostname=esxi-zlon-rpi-001.jorgedelacruz.es boardtemp="37.0" 1605399462000000000
2020-11-15T00:17:41Z I! Starting Telegraf 1.16.1
> vsphere_esxi_arm,boardmodel=0,boardrevision=0xd03114,boardserial=0x000000ab401f61,firmware=0x5f440c10,hostname=esxi-zlon-rpi-001.jorgedelacruz.es boardtemp="37.0" 1605399462000000000

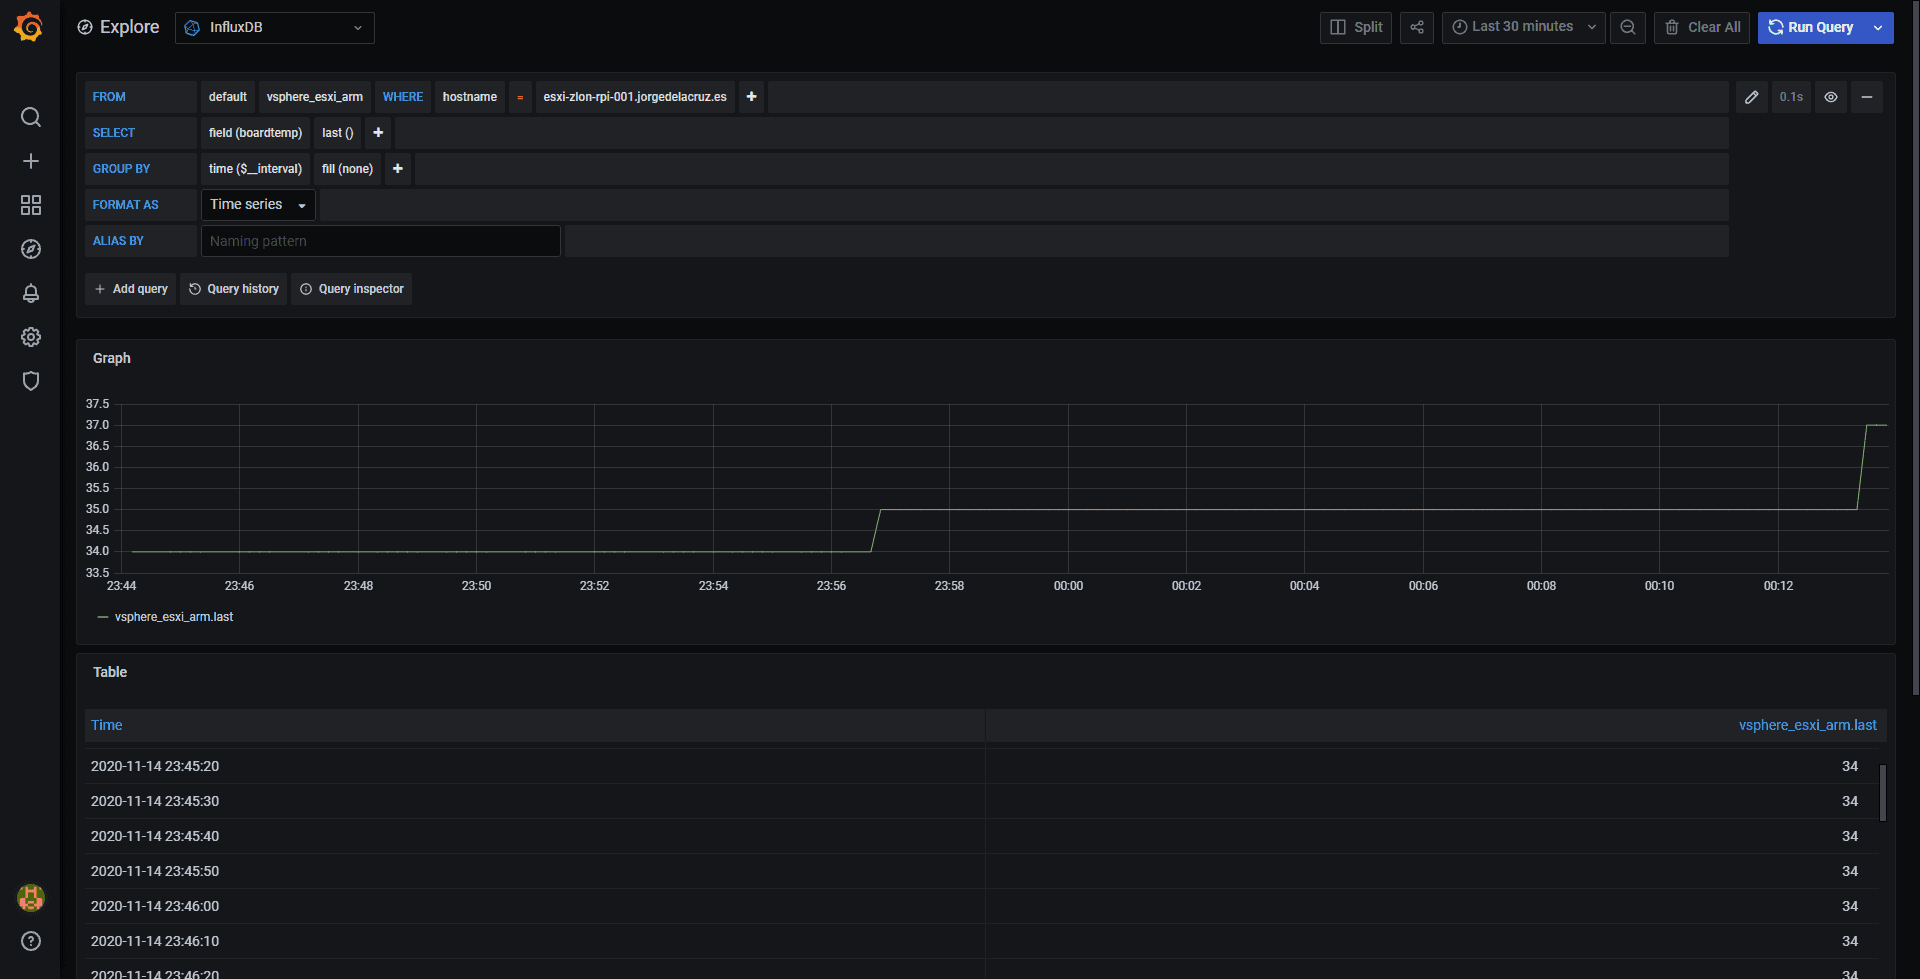
If we go to our Grafana – Explorer, we can see that we have data!

Grafana Dashboard to see everything in a centralized way

Now that we have all this information, we probably want to show it in a more elegant way. I have used the well-known vSphere Hosts Dashboard I already had and added the ESXi ARM part at the end of it.

Just by importing it using the Grafana URL, you will have something similar to this:

  • https://grafana.com/grafana/dashboards/8165

At the end of it all, in case you have ESXi for ARM, they will appear to you. Remember that you need vCenter for all this to work:
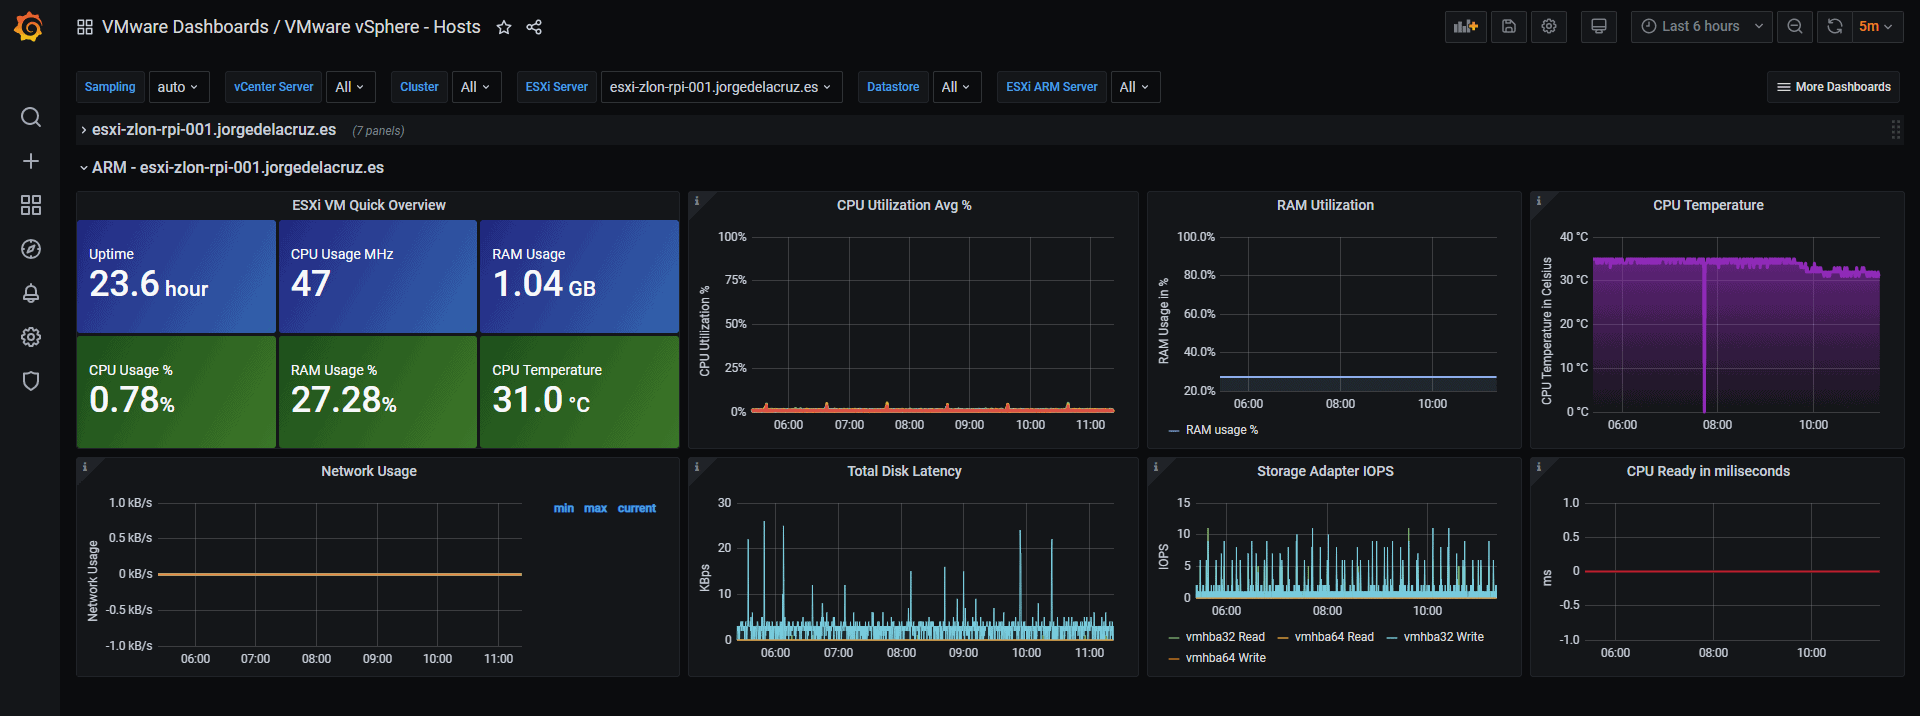
That’s all friends, thank you for the following links that have helped me a lot:

  • https://www.virten.net/2020/11/get-raspberry-pi-cpu-temperature-on-esxi-arm/
  • https://www.virten.net/2020/11/get-raspberry-pi-cpu-temperature-on-esxi-arm/
  • https://www.virtuallyghetto.com/2020/11/stateless-esxi-arm-with-raspberry-pi.html
  • https://www.virtuallyghetto.com/2020/10/automated-network-scripted-installation-of-esxi-arm-without-sd-card.html
  • https://www.virtuallyghetto.com/2020/10/esxi-on-arm-fling.html
  • https://github.com/thebel1/thpimon

Endnote – Using CGI to get a JSON on Demand

Florian from virten.net has published a similar process using a CGI that ESXi runs every time this URL is called:

  • https://www.virten.net/2020/11/esxi-arm-on-raspi-pull-cpu-temperature-using-curl/

It seems a very simple and elegant process, the only thing that makes me a little nervous is that it is using hostd-operation.cgi that is supposed to be reserved for the system, although we don’t know much about it, if it was hardcoded, it might be a reason. Anyway, Florian steps are very cool and there is no need for cron, now you have another option 🙂

Filed Under: opensource, vmware Tagged With: esxi arm grafana, esxi arm monitoring, esxi arm temperature

Reader Interactions

Comments

  1. David says

    15th March 2021 at 9:48 am

    Can this method handle multiple ESXi-arm servers and normal ESXi on the same report? I’ve got 1 ESXi on a NUC and 3 x pi’s but only one of the pi’s appears in the hosts report. Hosts report was working and reporting the NUC running ESXi until I updated to this version of the Grafana dashboard.

  2. jorgeuk says

    15th March 2021 at 9:56 am

    Hello,
    Yes, you should be able to monitor both, the ARM one will be at the end, like in this picture –
    And of course, the normal ones are untouched so should work as usual.

  3. Carlos Guerra says

    7th March 2022 at 4:57 am

    and how can we get same plugin for celeron processor?

  4. jorgeuk says

    7th March 2022 at 11:05 am

    Hello,
    What server do you have? I have already an IPMI dashboard for this. As long as it has some kind of ipmi, irac, ilo, etc. Let me know

Leave a Reply

Your email address will not be published. Required fields are marked *

This site uses Akismet to reduce spam. Learn how your comment data is processed.

Primary Sidebar

  • E-mail
  • GitHub
  • LinkedIn
  • RSS
  • Twitter
  • YouTube

Posts Calendar

November 2020
M T W T F S S
 1
2345678
9101112131415
16171819202122
23242526272829
30  
« Oct   Dec »

Disclaimer

All opinions expressed on this site are my own and do not represent the opinions of any company I have worked with, am working with, or will be working with.

Copyright © 2025 · The Blog of Jorge de la Cruz