
 Greetings friends, one of the common questions I get is how we can get how many times an ESXi is overprovisioned. A few months ago I already covered how to get this data, in the case you are already using Veeam ONE:
But I am aware that not everyone is using Veeam ONE today, and perhaps you are using the free Influxdata telegraf, Grafana, and the dashboards I’ve built and showed you how to configure a few times:
- Looking for the Perfect Dashboard: InfluxDB, Telegraf and Grafana – Part I (Installing InfluxDB, Telegraf and Grafana on Ubuntu 20.04 LTS)
- Looking for the Perfect Dashboard: InfluxDB, Telegraf and Grafana – Part XII (Native Telegraf Plugin for vSphere)
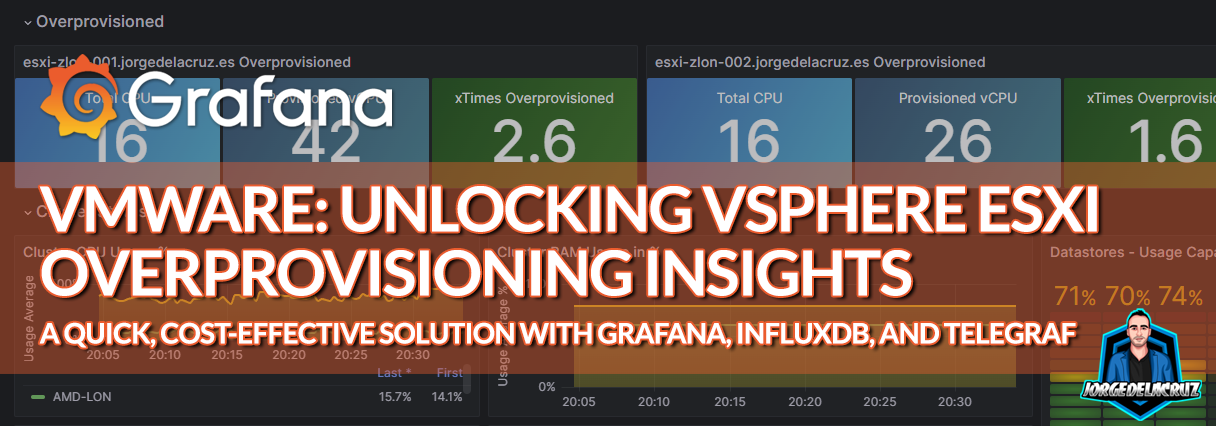
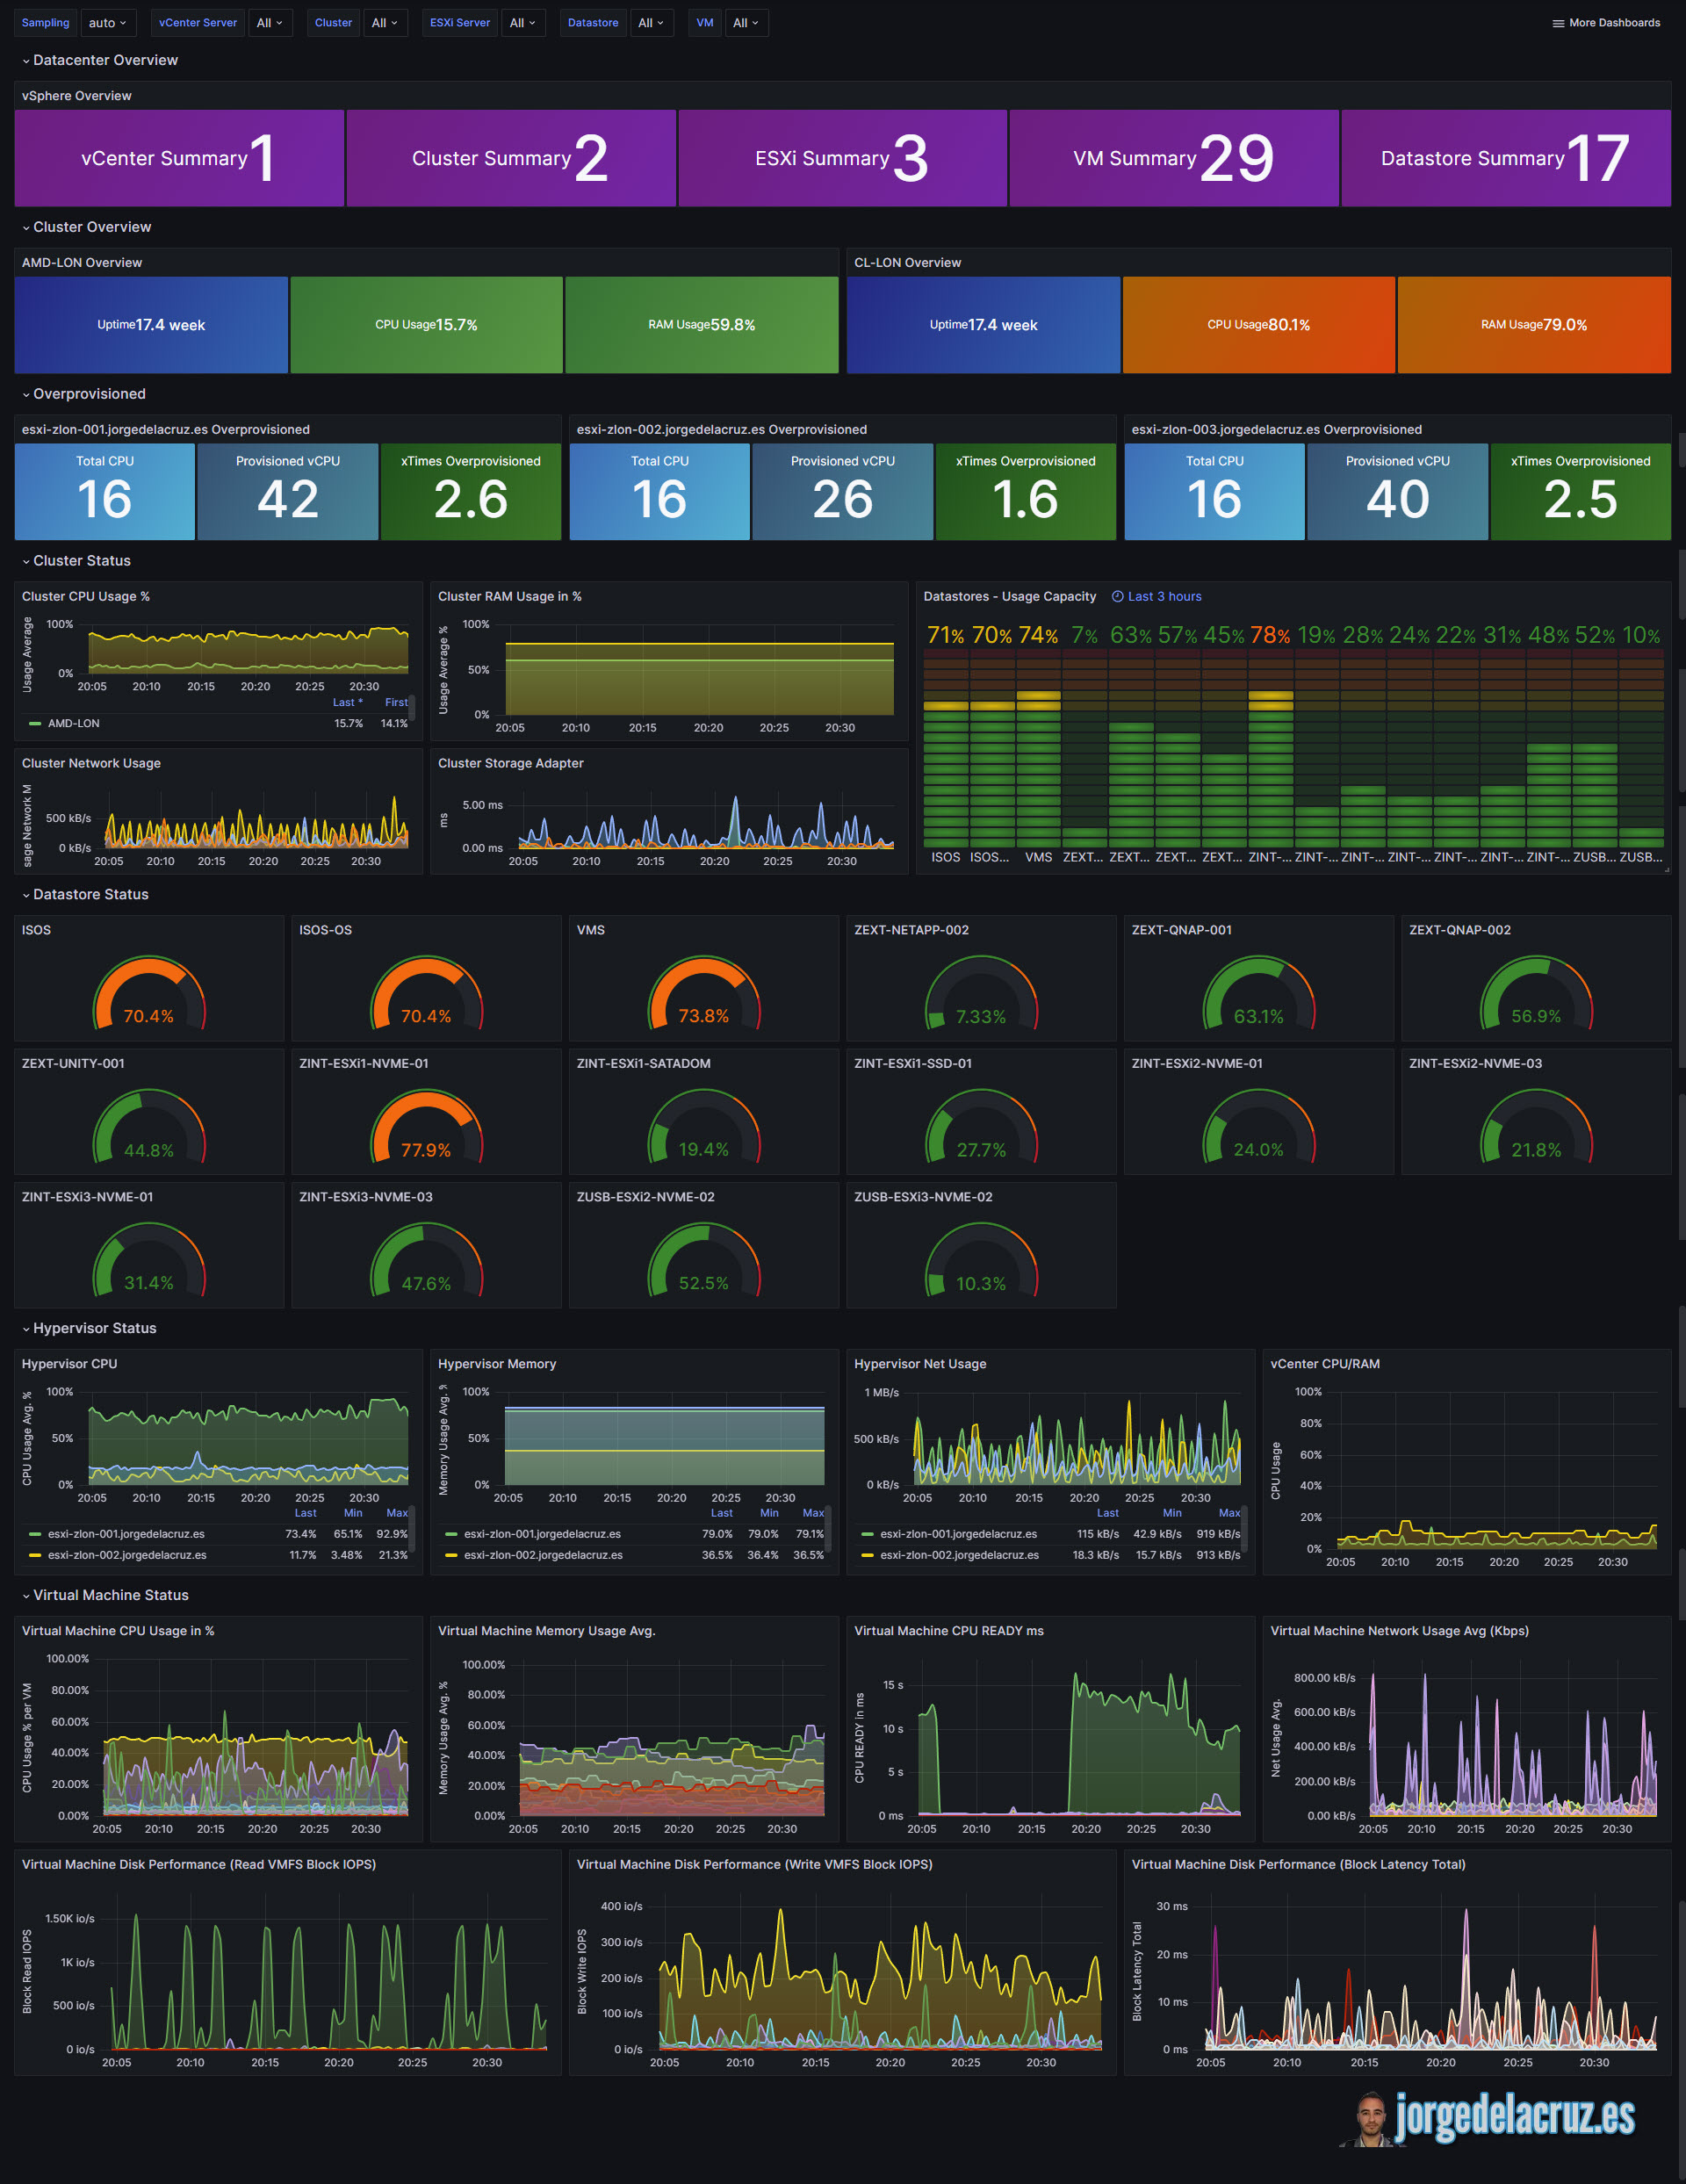
So, if you are already using the integration, I have good news for you. Thanks to Kris Vermeulen, who reminded about this recently, I am plelased to share with all of you an update to your current Dashboards. If you download the new version it will llook more or less like this:
How can I get the last version? Is it free, dude?
Getting into the Matrix
Quick Intro
For some of you this is not needed, so if you only use the product as it is and do not want to explore further, now is your time to close this tab <> Maybe you can leave a comment, or feedback about the project before 🙂
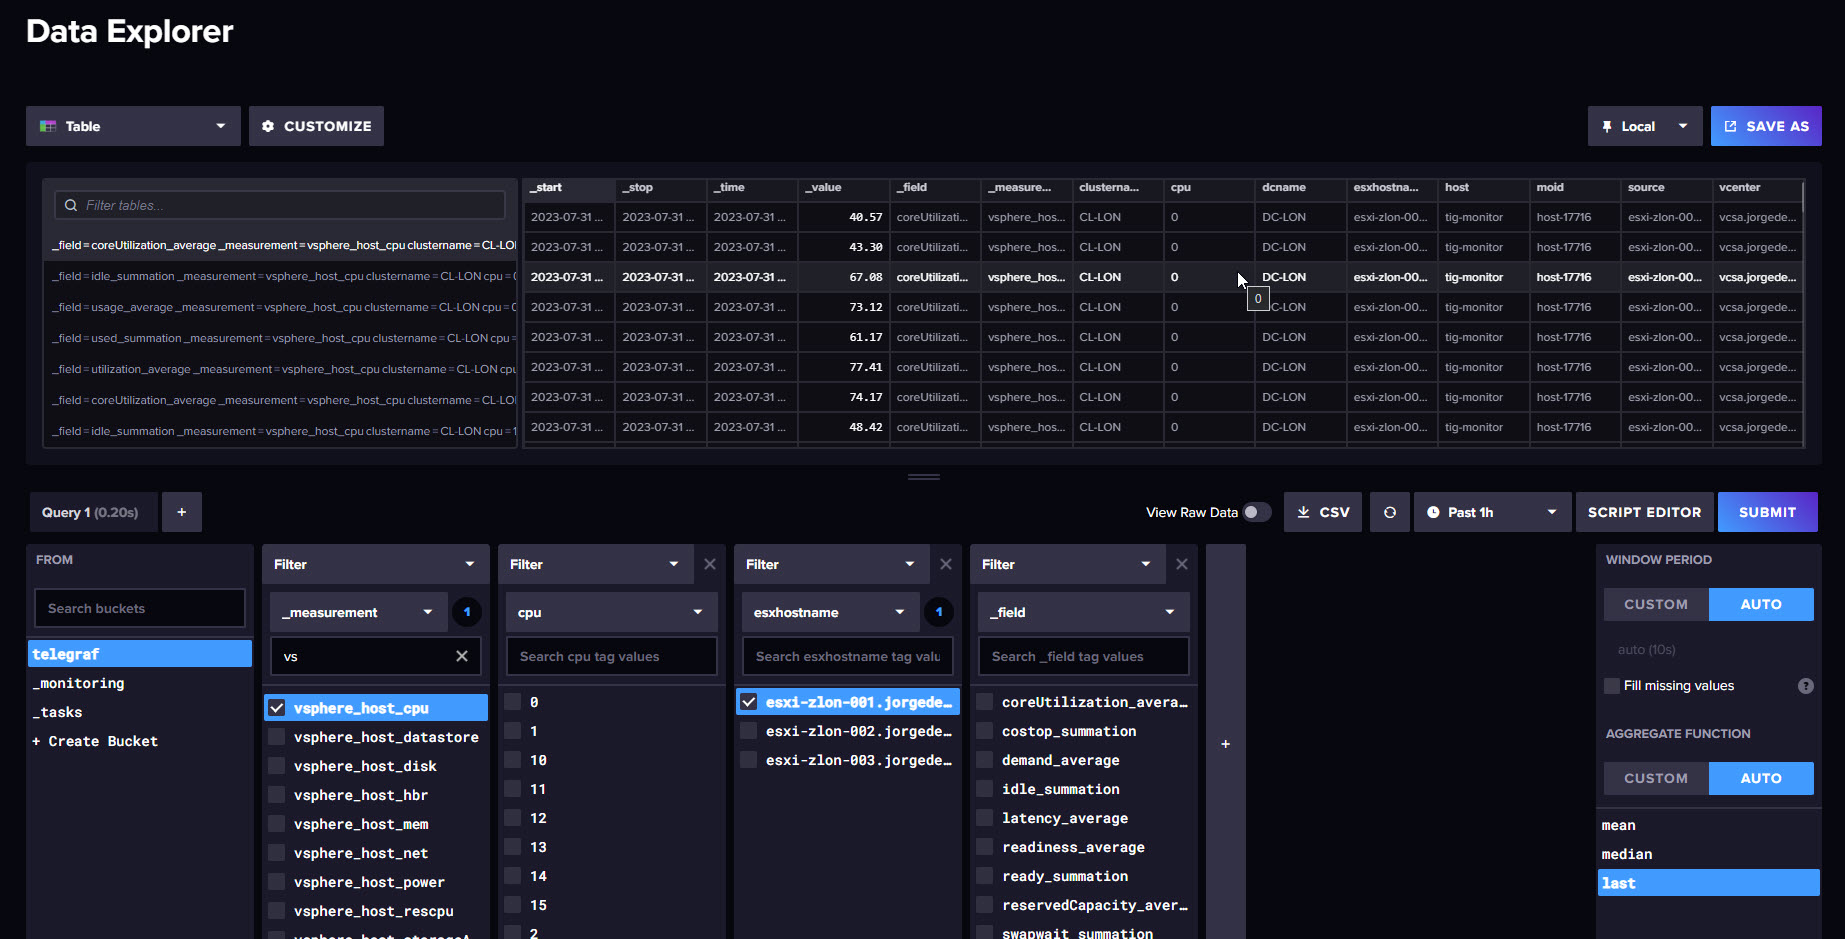
To calculate CPU Overcommit, or overprovisioned we need to measurements from InfluxDB:
- vsphere_host_cpu
- vsphere_vm_cpu
These are very simple tables, where the data looks like this, once grouped by either Host, or VM:
Following the white rabbit
From here we can see something interesting, and that is that we have a lot of data, metrics/values, per CPU (vCPU or Core for Hosts), that is great, and a normal query will be good to see consumption and usage, now, when we want to calculate howe many of that column are we can put something like this:
from(bucket: "telegraf")
  |> range(start: v.timeRangeStart, stop: v.timeRangeStop)
  |> filter(fn: (r) => r["_measurement"] == "vsphere_host_cpu")
  |> filter(fn: (r) => r["esxhostname"] == 'MYESXI.MYDOMAIN')
  |> filter(fn: (r) => r["cpu"] != "instance-total")
  |> keep(columns: ["cpu"])
  |> distinct(column: "cpu")
  |> group()
  |> count()
That it is going to give us the total number of CPU we have on that ESXi. We are going in the right direction!
Let’s move to VMs, as we do not only want to get how many CPU has every VM, but also we want to know the assigned Host, so the query is a bit more complex (just adding the ESXi to the mix really):
from(bucket: "telegraf")
  |> range(start: v.timeRangeStart, stop: v.timeRangeStop)
  |> filter(fn: (r) => r["_measurement"] == "vsphere_vm_cpu")
  |> filter(fn: (r) => r["esxhostname"] == 'MYESXI.MYDOMAIN')
  |> keep(columns: ["cpu","vmname"])
  |> filter(fn: (r) => r["cpu"] != "instance-total")
  |> group(columns: ["vmname"])
  |> distinct(column: "cpu")
  |> group()
  |> count()
And with this, we will have the total number provisioned CPU across all VMs on that ESXi. As we are using a range of time, the query should calculate only VMs that have data, meaning that if you delete a VM 7 days ago, it should not count if you run it with a period of 24 hours ago.
Now, this is all good and seems simple. How do we run a mathematical operation to see how many times is the total VM CPUs vs the Host CPU?
That is a very good question, I couldn’t find anything directly on InfluxDB, so I am happy to be using Grafana for this purpose. Let’s move to the next section then.
Grafana, zeros and ones
So, here we are, inside Grafana queries. We will start adding the queries one by one. First the Host CPU oriented one, and second the VM CPU oriented one. Mind that I am using clever regex and Grafana variables that I have already defined on the dashboard settings, so we can use them on cases like this:
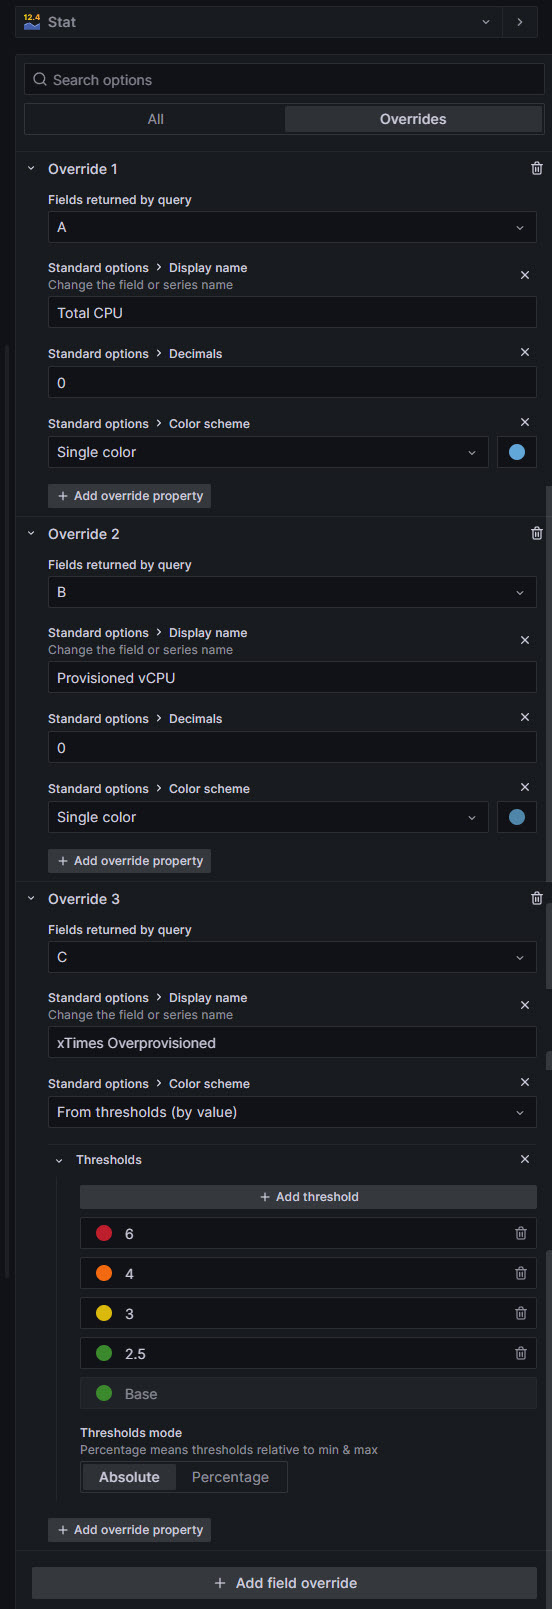
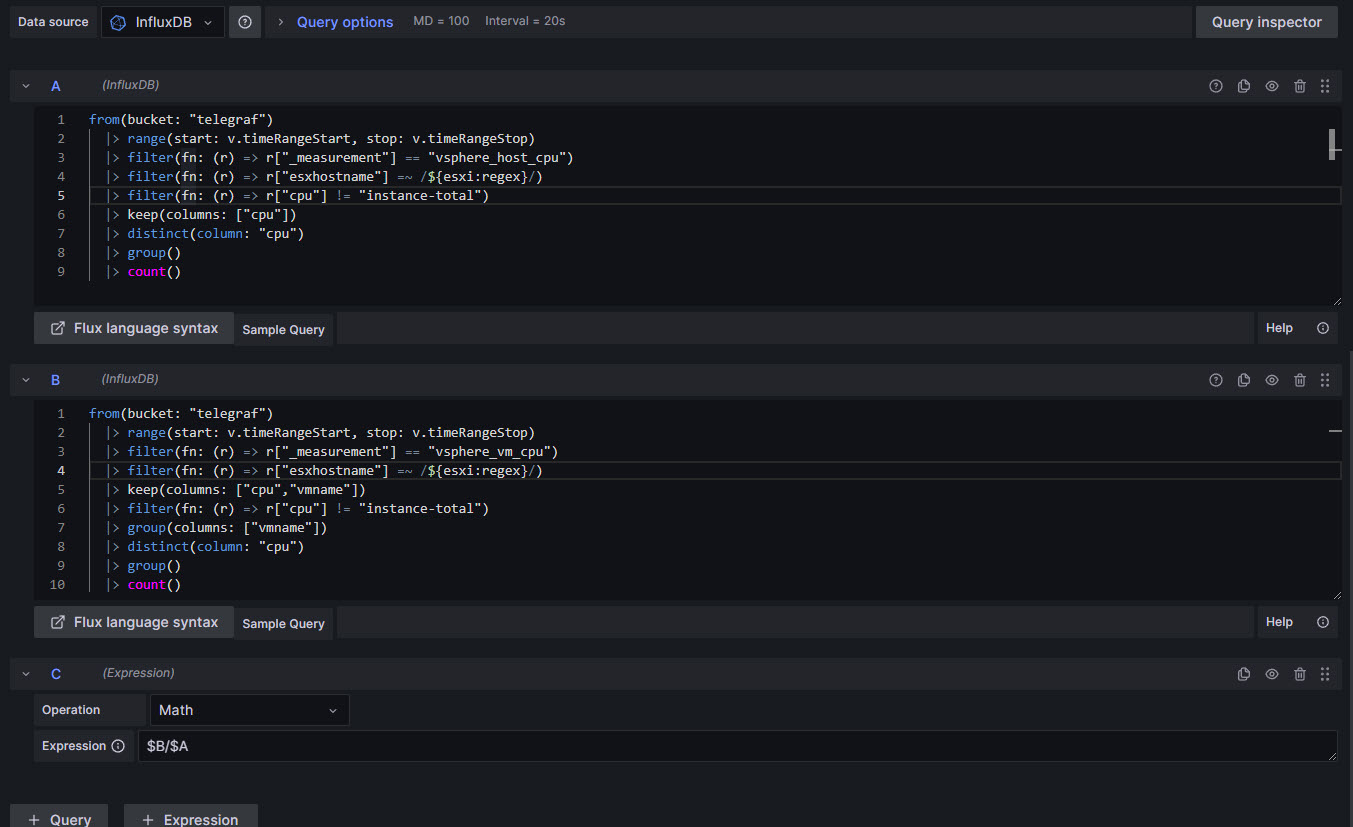 The final query, C, it is a simple Expression where I do a simple division of the Total VM CPU divided by the Total Host CPU. Extremely simple, once we know what we are doing, right? Once we have all of this, we can play with the overrides, colors and all, to have something that looks good enough for our use-case:
 That’s all folks, if you are interested into more posts about Grafana, please help yourself:
- Looking for the Perfect Dashboard: InfluxDB, Telegraf, and Grafana – Part I (Installing InfluxDB, Telegraf, and Grafana on Ubuntu 20.04 LTS)
- En busca del Dashboard perfecto: InfluxDB, Telegraf y Grafana – Parte II (Instalar agente Telegraf en Nodos remotos Linux)
- En busca del Dashboard perfecto: InfluxDB, Telegraf y Grafana – Parte III Integración con PRTG
- En busca del Dashboard perfecto: InfluxDB, Telegraf y Grafana – Parte IV (Instalar agente Telegraf en Nodos remotos Windows)
- En busca del Dashboard perfecto: InfluxDB, Telegraf y Grafana – Parte V (Activar inputs específicos, Red, MySQL/MariaDB, Nginx)
- En busca del Dashboard perfecto: InfluxDB, Telegraf y Grafana – Parte VI (Monitorizando Veeam)
- En busca del Dashboard perfecto: InfluxDB, Telegraf y Grafana – Parte VII (Monitorizar vSphere)
- En busca del Dashboard perfecto: InfluxDB, Telegraf y Grafana – Parte VIII (Monitorizando Veeam con Enterprise Manager)
- En busca del Dashboard perfecto: InfluxDB, Telegraf y Grafana – Parte IX (Monitorizando Zimbra Collaboration)
- En busca del Dashboard perfecto: InfluxDB, Telegraf y Grafana – Parte X (Grafana Plugins)
- En busca del Dashboard perfecto: InfluxDB, Telegraf y Grafana – Parte XI – (Monitorizando URL e IPS con Telegraf y Ping)
- Looking for the Perfect Dashboard: InfluxDB, Telegraf, and Grafana – Part XII (Native Telegraf Plugin for vSphere)
- Looking for the Perfect Dashboard: InfluxDB, Telegraf, and Grafana – Part XIII (Veeam Backup for Microsoft Office 365 v4)
- Looking for the Perfect Dashboard: InfluxDB, Telegraf, and Grafana – Part XIV – Veeam Availability Console
- Looking for the Perfect Dashboard: InfluxDB, Telegraf, and Grafana – Part XV (IPMI Monitoring of our ESXi Hosts)
- Looking for Perfect Dashboard: InfluxDB, Telegraf, and Grafana – Part XVI (Performance and Advanced Security of Veeam Backup for Microsoft Office 365)
- Looking for the Perfect Dashboard: InfluxDB, Telegraf, and Grafana – Part XVII (Showing Dashboards on Two Monitors Using Raspberry Pi 4)
- En busca del Dashboard perfecto: InfluxDB, Telegraf y Grafana – Parte XVIII – Monitorizar temperatura y estado de Raspberry Pi 4
- Looking for the Perfect Dashboard: InfluxDB, Telegraf, and Grafana – Part XIX (Monitoring Veeam with Enterprise Manager) Shell Script
- Looking for the Perfect Dashboard: InfluxDB, Telegraf, and Grafana – Part XXIV (Monitoring Veeam Backup for Microsoft Azure)
- Looking for the Perfect Dashboard: InfluxDB, Telegraf, and Grafana – Part XXV (Monitoring Power Consumption)
- Looking for the Perfect Dashboard: InfluxDB, Telegraf, and Grafana – Part XXVI (Monitoring Veeam Backup for Nutanix)
- Looking for the Perfect Dashboard: InfluxDB, Telegraf, and Grafana – Part XXVII (Monitoring ReFS and XFS (block-cloning and reflink)
- Looking for the Perfect Dashboard: InfluxDB, Telegraf, and Grafana – Part XXVIII (Monitoring HPE StoreOnce)
- Looking for the Perfect Dashboard: InfluxDB, Telegraf, and Grafana – Part XXIX (Monitoring Pi-hole)
- Looking for the Perfect Dashboard: InfluxDB, Telegraf, and Grafana – Part XXIX (Monitoring Veeam Backup for AWS)
- Looking for the Perfect Dashboard: InfluxDB, Telegraf, and Grafana – Part XXXI (Monitoring Unifi Protect)
- Looking for the Perfect Dashboard: InfluxDB, Telegraf, and Grafana – Part XXXII (Monitoring Veeam ONE – experimental)
- Looking for the Perfect Dashboard: InfluxDB, Telegraf, and Grafana – Part XXXIII (Monitoring NetApp ONTAP)
- Looking for the Perfect Dashboard: InfluxDB, Telegraf, and Grafana – Part XXXIV (Monitoring Runecast)
- Looking for the Perfect Dashboard: InfluxDB, Telegraf, and Grafana – Part XXXV (GPU Monitoring)
- Looking for the Perfect Dashboard: InfluxDB, Telegraf, and Grafana – Part XXXVI (Monitoring Goldshell Miners – JSONv2)
- Looking for the Perfect Dashboard: InfluxDB, Telegraf, and Grafana – Part XXXVII (Monitoring Veeam Backup for Google Cloud Platform)
- En Busca del Dashboard perfecto: InfluxDB, Telegraf y Grafana – Parte XXXVIII (Monitorizando Temperatura y Humedad con Xiaomi Mijia)
- Looking for the Perfect Dashboard: InfluxDB, Telegraf, and Grafana – Part XL (Veeam Backup for Microsoft 365 – Restore Audit)
- Looking for the Perfect Dashboard: InfluxDB, Telegraf, and Grafana – Part XLI (Veeam Backup for Salesforce)
- Looking for the Perfect Dashboard: InfluxDB, Telegraf, and Grafana – Part XLII (Veeam ONE v12 Audit Events)
- Looking for the Perfect Dashboard: InfluxDB, Telegraf, and Grafana – Part XLIII (Monitoring QNAP using SNMP v3)
Dashboard download is not working. Thank you 4 your great work
Hello, might be a bug on Grafana.com, try the revisions page, download latest: https://grafana.com/grafana/dashboards/8159-vmware-vsphere-overview/?tab=revisions
Cheers!
Hello Jorge, thanks for dashboard is working perfectly.
In the vsphere overview row, when there is more than one vcenter it separates the information, how is it possible for information from each vcenter to appear when filtered?
Hello,
Can you please share some screenshot so I can take a look?
Thank you!
Thank you for all Dashboard, really helpful, all of my VMware dashbaord stop working after 24 Hrs, when I do ” systemctl status telegraf.service” it gives me below:
[inputs.vsphere] Error in plugin: Post “https://vcenter.exmaple.com/sdk”: dial tcp: lookup vcenter.exmaple.com: no such host
I can ping vcenter.exmaple.com from my ubuntu 22.04 with no issue, however I replaced it with vCenter IP and restarted telegraph service, now I am getting:
[inputs.vsphere] Unable to find metric name for id 429. Skipping!
Hello,
What vCenter version are you running? And the unable to find metric is a warning or error?
Also, what telegraf version?
Hi,
Telegraf 1.21.4+ds1-0ubuntu2
vCenter: 8.0.2 23929136
it was metric error.
I am in day 5th with IP on vsphere-stats.conf and no issue, for some reason FQDN stop working after 24 hours, not a big deal just wanted to let you know.