
 Greetings everyone, for years I have been sharing the benefits of using Telegraf, InfluxDB, and Grafana, and do not get me wrong, that stack is the best in the industry to monitor absolutely anything, especially performance, and super big historical time-series. The beauty of telegraf with all the plugins that it has, is that you can plug it anywhere.
Just recently I was looking for a much simpler way of getting the uptime, or really just checking if something was working, whatever it is my website, a few critical servers that I have, etc. So looking around I’ve discovered Uptime Kuma.
What it is Uptime Kuma?
Uptime Kuma is an open-source project created by Louis Lam, among its many features, this project give us:
- Monitoring uptime for HTTP(s) / TCP / HTTP(s) Keyword / HTTP(s) Json Query / Ping / DNS Record / Push / Steam Game Server / Docker Containers
- Fancy, Reactive, Fast UI/UX
- Notifications via Telegram, Discord, Gotify, Slack, Pushover, Email (SMTP), and 90+ notification services, click here for the full list
- 20-second intervals
- Multi Languages
- Multiple status pages
- Map status pages to specific domains
- Ping chart
- Certificate info
- Proxy support
- 2FA support
To me, this is one of the best and simplest monitoring tool I have ever seen, perhaps similar to PRTG due simplicity, but open source and totally free. This is an example of monitoring my blog:
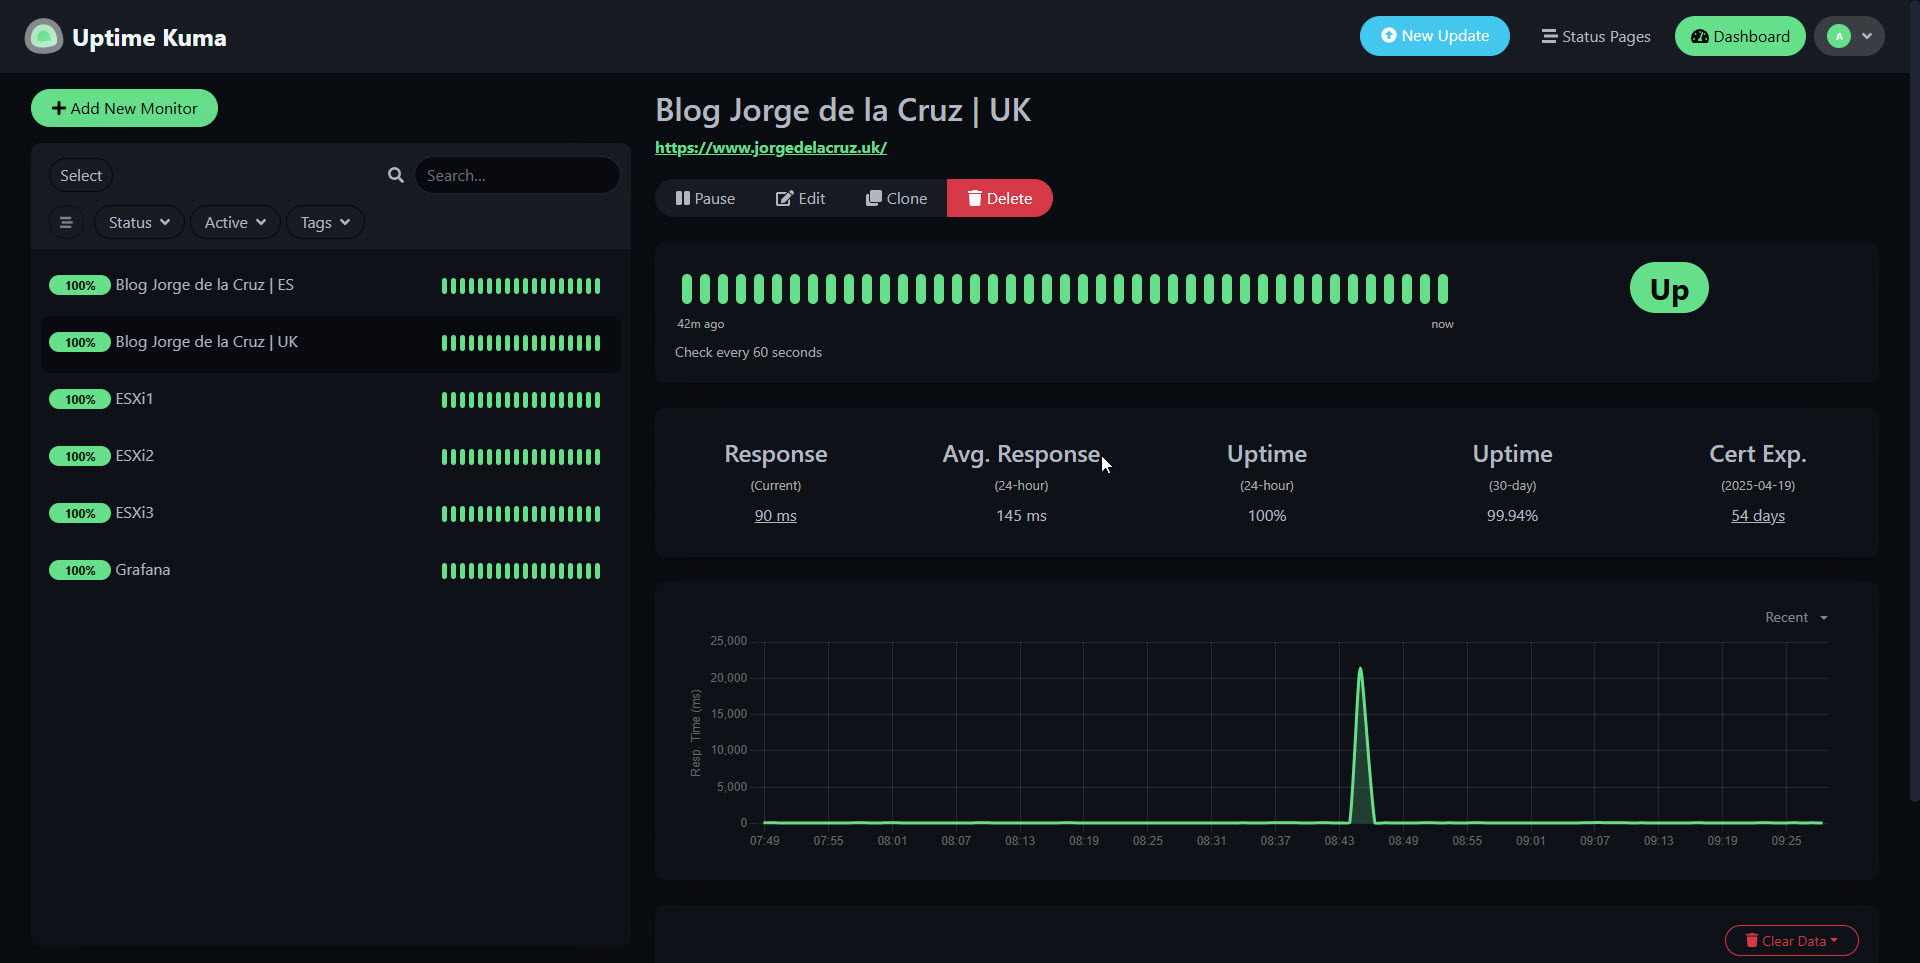 That took me just 5 seconds, just adding my URL, and say to monitor the SSL certificate as well. The simplicity here is a given.
How-to Install Uptime Kuma – YouTube video
For those who like videos, here is a complete tutorial:
How-to Install Uptime Kuma – Step by Step
Installing Uptime Kuma is truly simple, I wish it was a bit more package orientated, but nevertheless, really simple. We will need NodeJS installed, so in my case I went for the version 20.x, but please check first what is the current version when you are seeing this post, use LTS wherever possible.
curl -fsSL https://deb.nodesource.com/setup_20.x | sudo -E bash -
sudo apt install -y nodejs
Let’s run a quick sanity check that things are all good, we should see the version of our NodeJS and npm:
node -v
v20.18.3
npm -v
10.8.2
As we are cloning the official GitHub project, we are going to need Git, most likely it is not installed on your Ubuntu 24.04 if you have not ran anything similar, it is very easy to install as well:
sudo apt install -y git
Let’s now move to the folder where we want to install Uptime Kuma, then clone the project and move inside the new folder:
cd /home/oper
git clone https://github.com/louislam/uptime-kuma.git
cd uptime-kuma
Let’s now run the installation command:
npm run setup
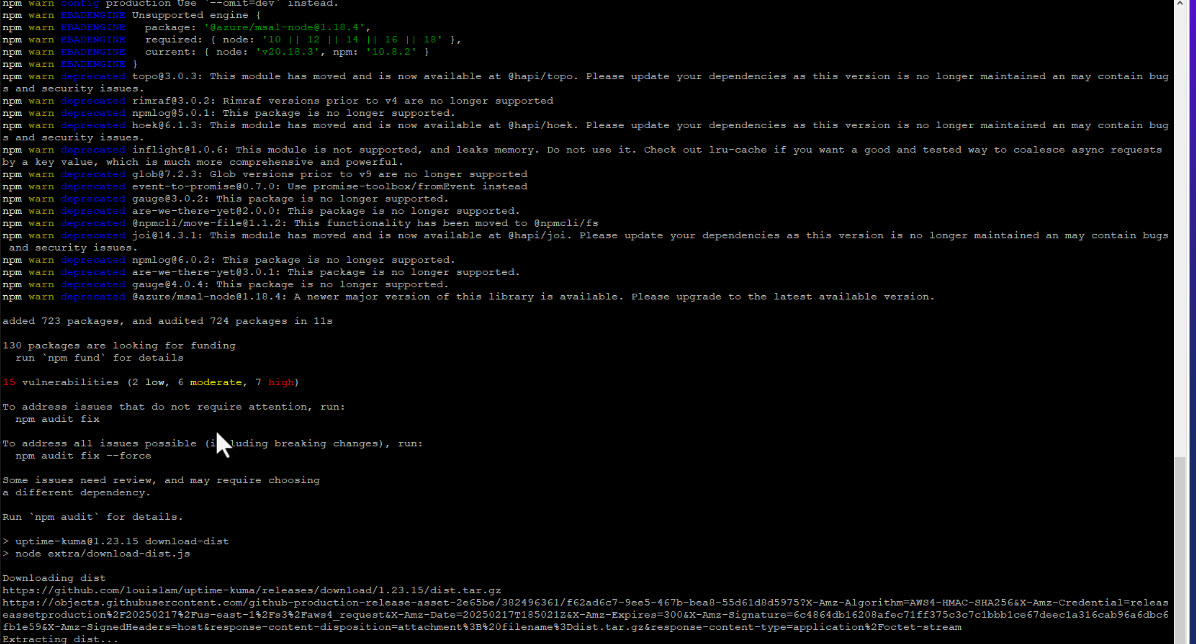
It doesn’t take long, and the output should be similar to the next:
How to run Uptime Kuma in the background
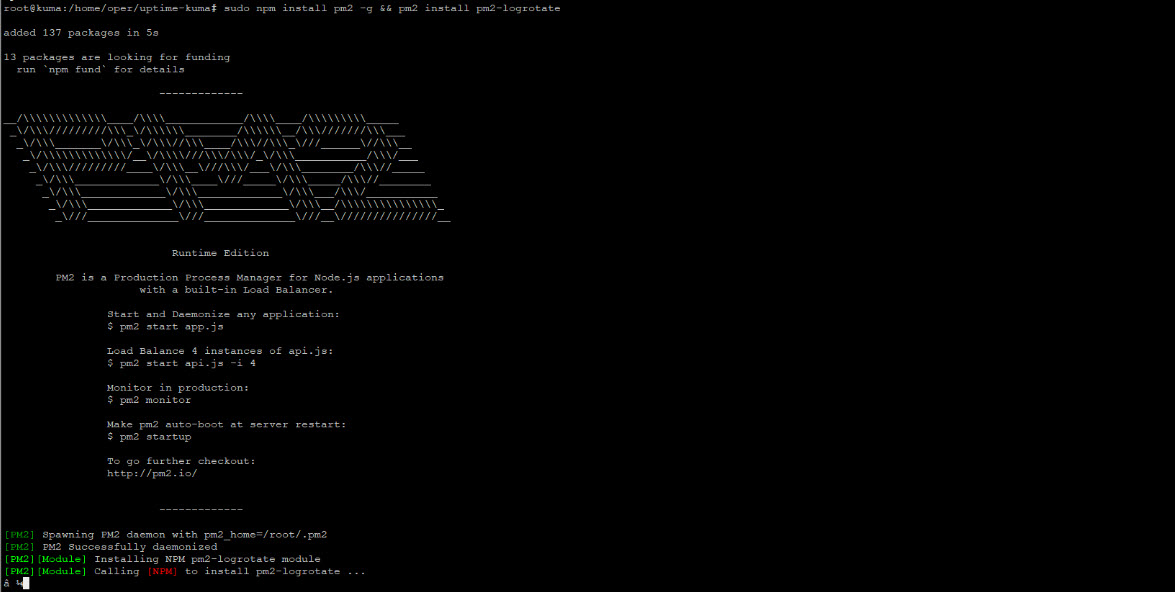
As this is a standalone web app, I am sure we want to run it on the background, and also on startup of the server, for that we are going to need PM2, it is easy to install as well:
sudo npm install pm2 -g && pm2 install pm2-logrotate
You should see something similar to this, it doesn’t take long:
 Let’s start now Uptime Kuma with pm2, as easy as:
pm2 start server/server.js --name uptime-kuma
If you want that Uptime Kuma starts within your server, we need to add it to startup:
pm2 startup
pm2 save
And that’s it, we can now go to the port 3001 of the IP and access:
- http://UPTIMEKUMAIP:3001
First login, and quick overview to Uptime Kuma
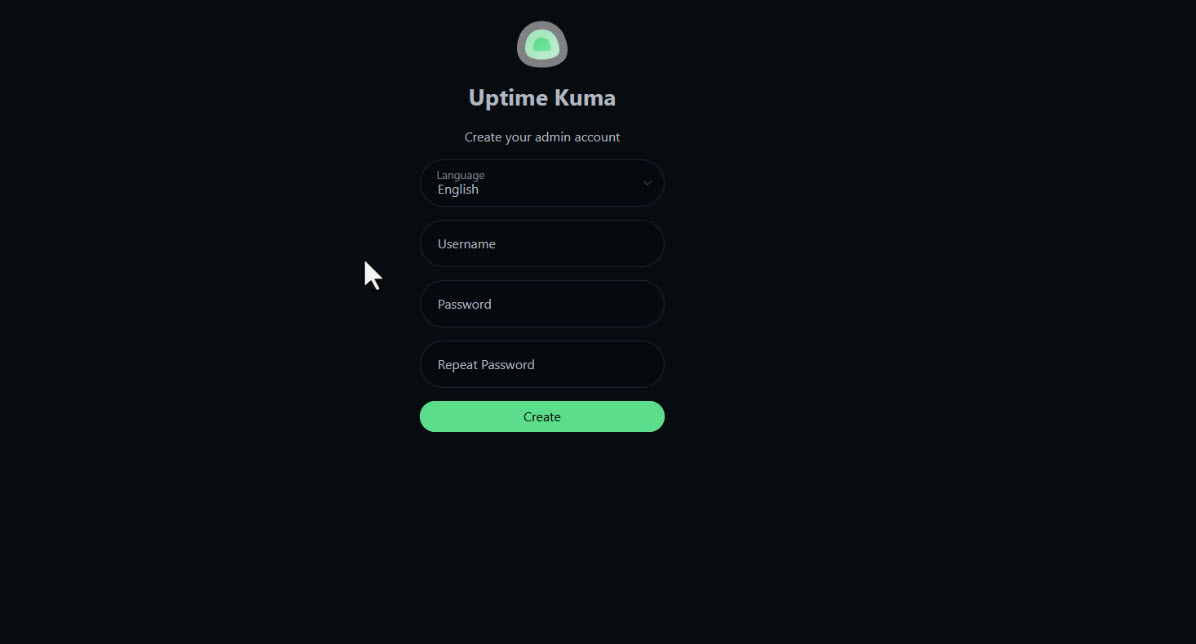
Now we need to create an user and password:
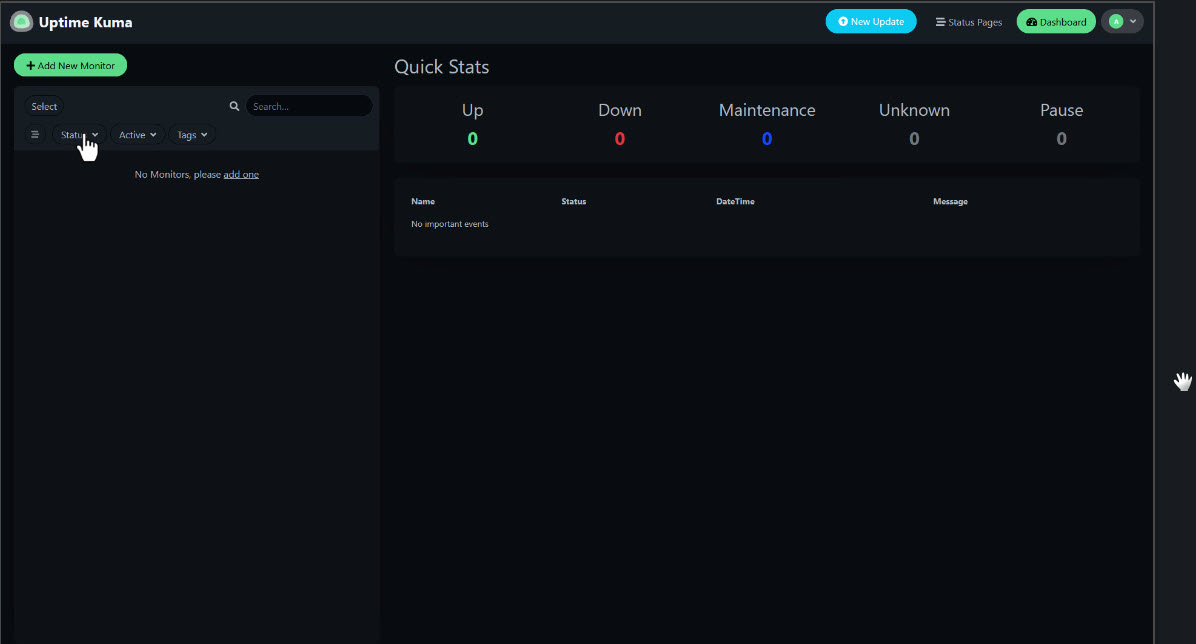
 And then we will finally land on the page where we can add nodes to monitor:
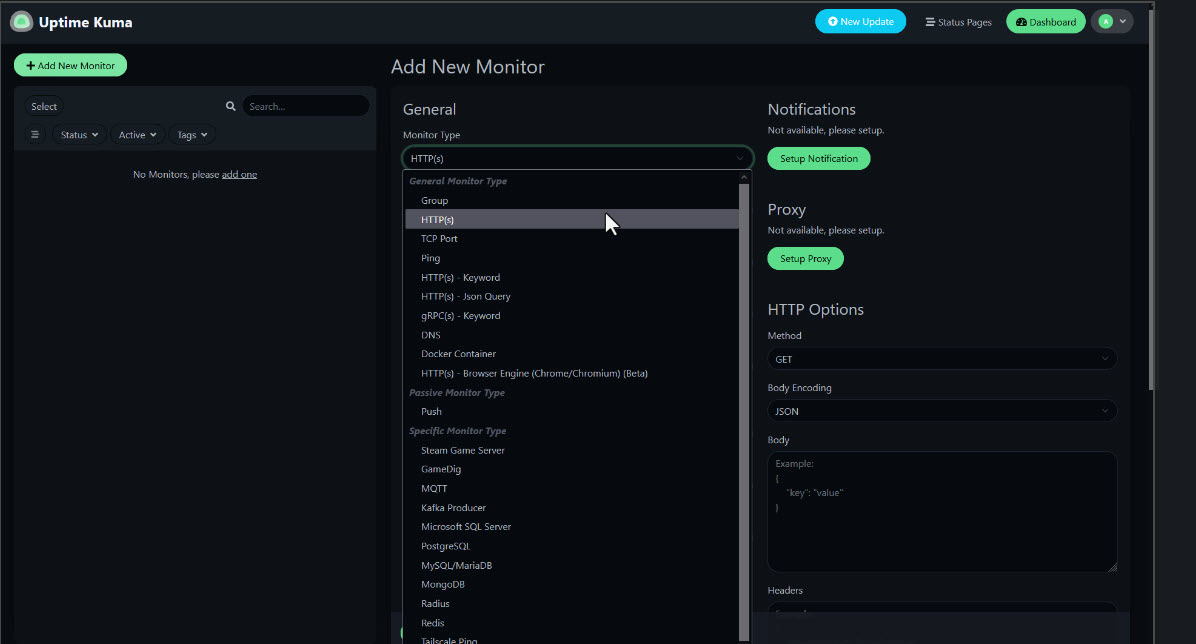
 There are many different ways of monitor our nodes, but the more usual ones are at the top, monitor DNS, websites with their SSL certificate, gRPC, etc. Truly powerful, yet simple:
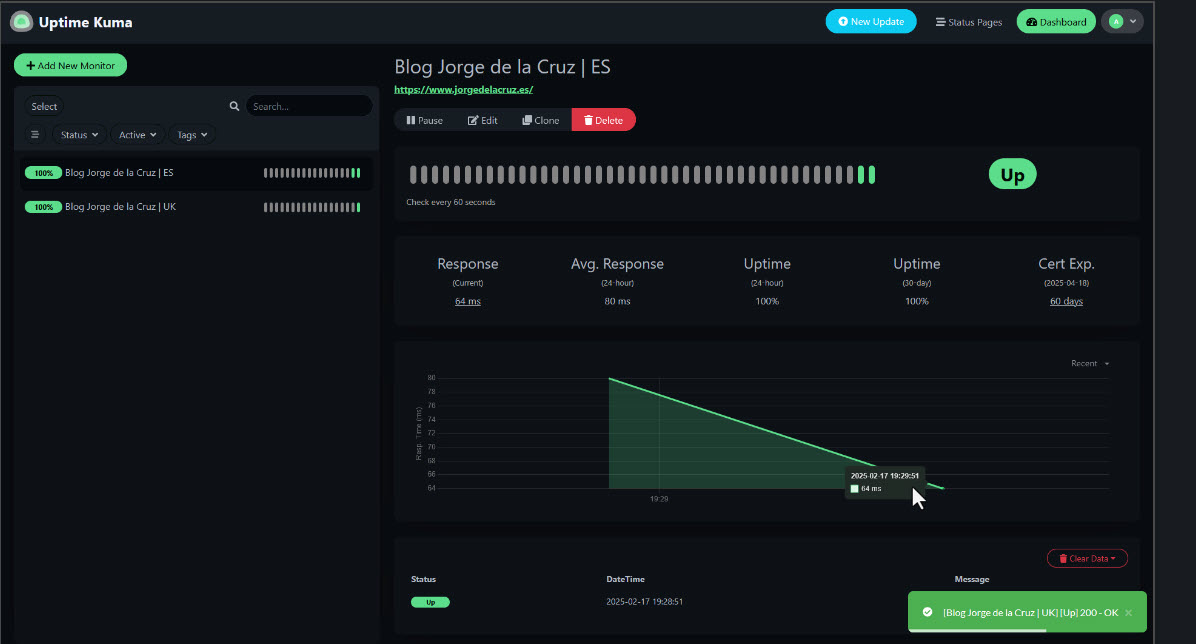
 This will be how the node looks like, at least the regular HTTP one, monitoring the SSL certificate as well:
How to Run an Nginx Reverse Proxy with an SSL certificate
Let’s make things even a bit better. As I am sure you would want to run this a bit more professionally, let’s add Nginx to the mix, so we pass that 3001 port to a proper HTTPS with a valid certificate.
Let’s start by installing Nginx:
sudo apt install -y nginx
Now we need to create a new site on the configuration:
sudo nano /etc/nginx/sites-available/kuma
We need to add the next configuration to it, as a quick explanation, we are just forcing to the port 80 to redirect to HTTPS, then adding a listener to the Uptime Kuma app, and pointing to the directory where we have our SSL files, these can be of course coming from certbot, up to you. I am of course using a valid FQDN that I am planning to expose externally, because things .local or so are hard to get a valid SSL:
server {
    listen 80;
    server_name kuma.jorgedelacruz.es;
    return 301 https://$host$request_uri;
}

server {
    listen 443 ssl;
    server_name kuma.jorgedelacruz.es;
    ssl_certificate /etc/nginx/ssl/fullchain.pem;
    ssl_certificate_key /etc/nginx/ssl/privkey.pem;

    location / {
        proxy_pass http://localhost:3001;
        proxy_set_header Host $host;
        proxy_set_header X-Real-IP $remote_addr;
        proxy_set_header X-Forwarded-For $proxy_add_x_forwarded_for;
        proxy_set_header X-Forwarded-Proto $scheme;
    }
}
Let’s now enable this new site into Nginx, test it, and finally restart the service:
sudo ln -s /etc/nginx/sites-available/kuma /etc/nginx/sites-enabled/
sudo nginx -t
sudo systemctl restart nginx
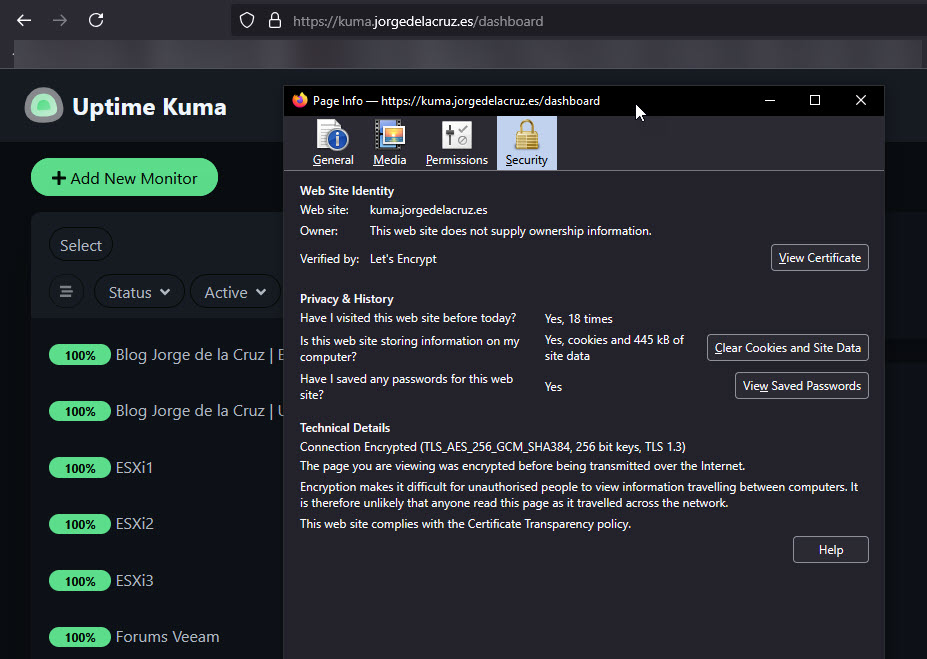
If you do not have any problem, you would be able to access now your Uptime Kuma with https://yourfqdn.com, or even with https://YOURIP but that last one will always give you and SSL error.
 That’s it, to me Uptime Kuma it has been a before and after. This product is so simple, yet powerful, on another blog entries we will see a bit more into deep configuration, but so far, I will totally recommend you to start playing with it, and monitor all the things!
Leave a Reply