
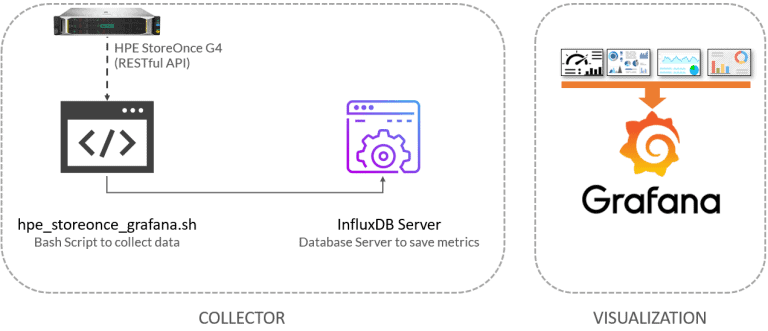
Greetings friends, a new week is a week with a new dashboard, this is so, I would like to be able to offer you many more use cases, with many other technologies, but time is very limited and I only have some nights to prepare this. Today we are going to see a very interesting topic, I was talking about HPE StoreOnce in previous posts, so as you
Looking for the Perfect Dashboard: InfluxDB, Telegraf and Grafana – Part XXVII (Monitoring ReFS and XFS (block-cloning and reflink)
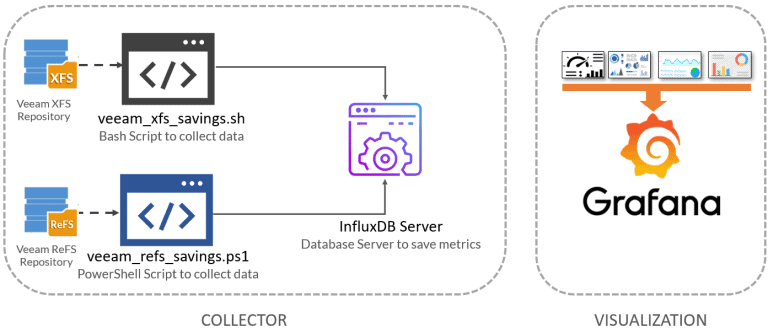
Greetings friends, a new week is a week with a new dashboard, this is so, I would like to be able to offer you many more use cases, with many other technologies, but time is very limited and I only have some nights to prepare this. Today we are going to see a topic that I have heard for at least 5 years, I mean to know and to know the amount of
Looking for the Perfect Dashboard: InfluxDB, Telegraf and Grafana – Part XXVI (Monitoring Veeam Backup for Nutanix)
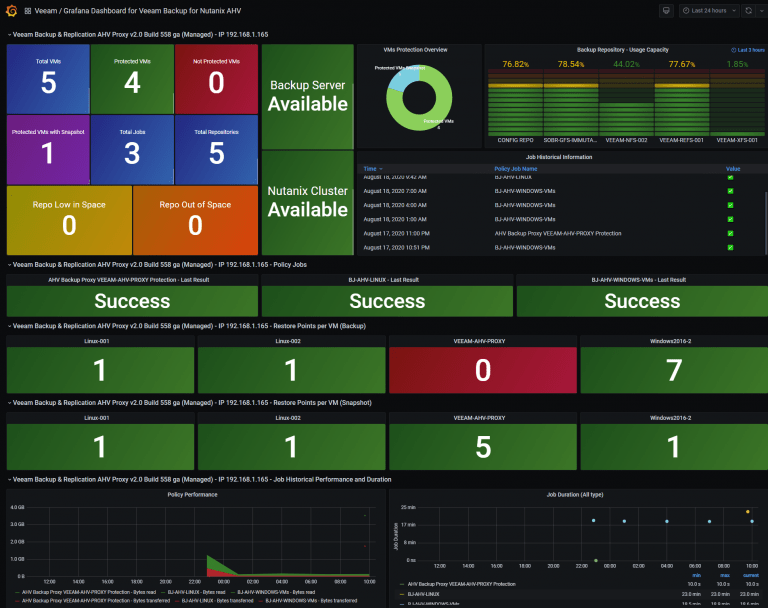
Greetings friends, since a few years ago, Veeam has native protection for workloads in Nutanix Acropolis, I told you how to deploy the Proxy and configure jobs, also the article contained the new report of Veeam ONE. But it is true that the monitoring of jobs, restore points, etc. in Veeam ONE can not include as much information as we need, so I
Veeam: How-to Deploy, and Configure MinIO with Erasure Coding Enabled, Immutability, and Let’s Encrypt
Greetings friends, just a few days ago Veeam officially announced the support for MinIO Immutability on its HCL. This is wonderful news for us to test this functionality in our labs, or in case we are using Linux storage with MinIO for production. In this blog entry, we're going to jump into the pool and see: how to install and configure MinIO
HackGato Key Light – Alternative to Elgato Key Light
Greetings friends, since a few months ago my number of calls has increased considerably, either with clients or with the team or family, I spend many hours in front of the camera. In another entry, I showed you how to give a professional look with OBS, and I also told you that headphones are perfect for these long periods of computer, with sublime