

Greetings friends, a few years ago I showed you how to monitor the CPU temperature using telegraf for a Raspberry Pi. I have recently purchased an exciting NVIDIA Jetson Nano and I wanted to monitor it as well, this device is a bit unique. I have used the RPi dashboard as inspiration, but this is an arm board with some unique GPU capabilities,
opensource
Looking for the Perfect Dashboard: InfluxDB, Telegraf, and Grafana – Part XLV (Monitoring Synology using SNMP v3)
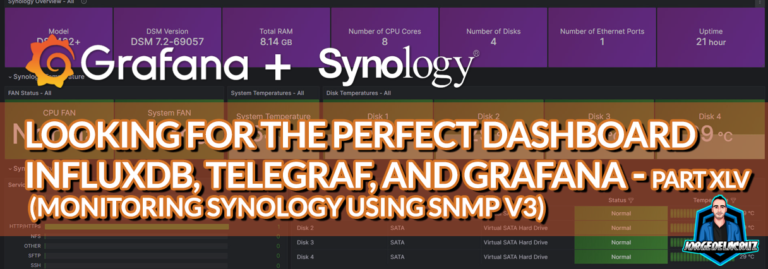
Greetings friends, what an exciting blog I have the honour to start 2024 with. After the very successful dashboard for QNAP, using SNMP v3, I got tons of emails and feedback asking for the same but for Synology. Unfortunately I do not have any Synology Hardware, so I have user Virtual DSM to achieve this dashboard. We are going to use our
VMware: Unlocking ESXi Overprovisioning Insights, A Quick, Cost-Effective Solution with Grafana, InfluxDB, and Telegraf on VMware
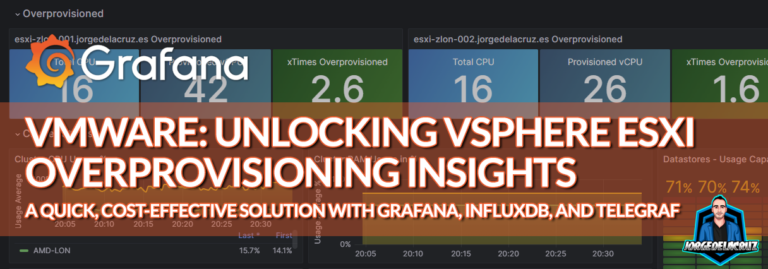
Greetings friends, one of the common questions I get is how we can get how many times an ESXi is overprovisioned. A few months ago I already covered how to get this data, in the case you are already using Veeam ONE: Veeam: Safeguarding vSphere Clusters with Veeam ONE - Overcommitment Report for Optimal Health But I am aware that not
Looking for the Perfect Dashboard: InfluxDB, Telegraf, and Grafana – Part XLIII (Monitoring QNAP using SNMP v3)
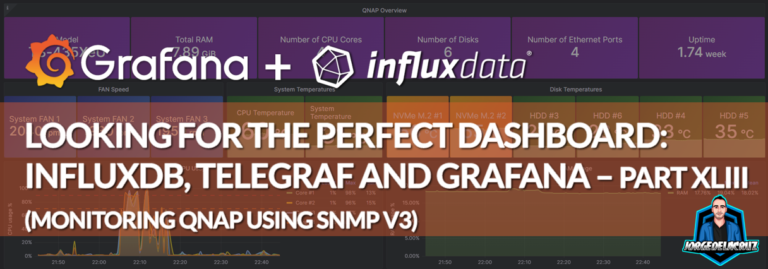
Greetings friends, what an exciting entry I bring you today. For years I have been receiving the request to do a SNMP Grafana dashboard. Honestly I always found SNMP quite complex for what it should be, I understand there are MIBs, and it is an standard, but it is just too complex to build upon it. Luckily telegraf comes to the rescue and the
Looking for the Perfect Dashboard: InfluxDB, Telegraf, and Grafana – Part XLII (Veeam ONE v12 Audit Events)
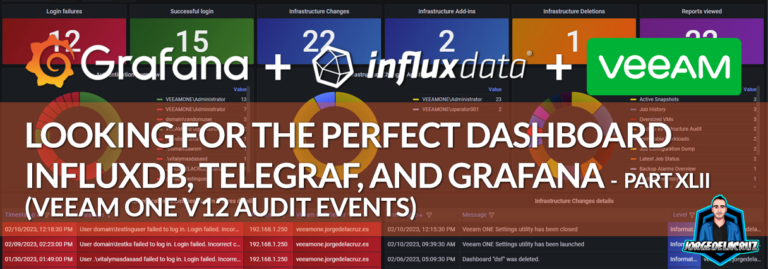
Greetings friends, Veeam ONE v12 has been launched, there are tons of improvements which we will cover on this blog shortly. But before I jump into native great features, I wanted to show you the art of the possible once again. Veeam ONE v12 comes with a new Audit funcionality that stores in the Windows Events Logs absolutely everything that