
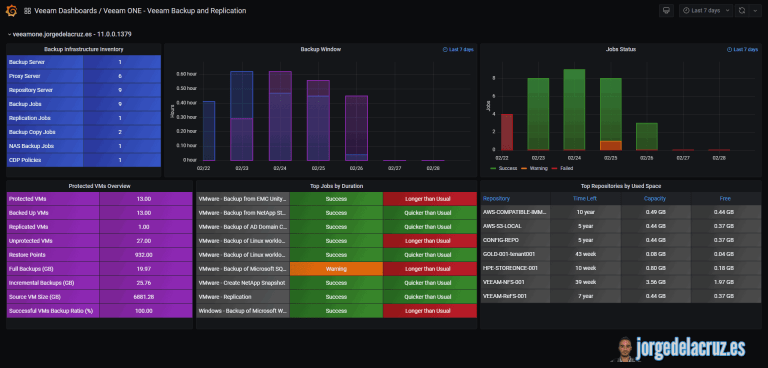
Greetings friends, today I bring you a new post about Grafana, today's post is also one of the most special that I have written, since it is an experimental version, and we do not know if this will come to some port, or will be changed in the future. I am talking about nothing more and nothing less than a Grafana Dashboard for Veeam ONE! Yes,
opensource
Looking for the Perfect Dashboard: InfluxDB, Telegraf, and Grafana – Part XXXI (Monitoring Unifi Protect)
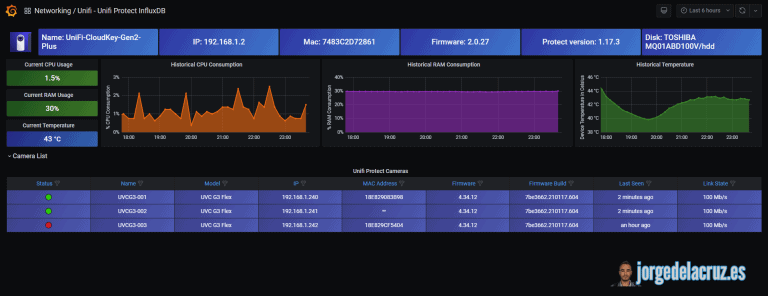
Greetings friends, today I bring you a new entry about Grafana and Unifi, that I am sure you will like and that I hope you will put in your collection. Yes, I know there is a version called Unifi Poller, which does more or less what I explain here, but the complexity of adding it to my already running environment, and that for now, I do not need so
Looking for the Perfect Dashboard: InfluxDB, Telegraf, and Grafana – Part XXIX (Monitoring Pi-hole)
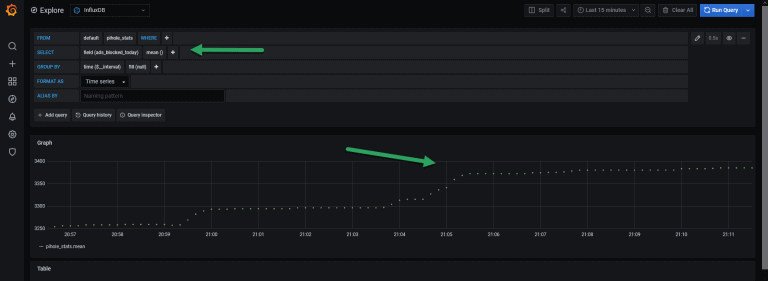
Greetings friends, it has been a while since I expanded the series of In Search of the Perfect Dashboard, but it has taken time to continue. Today I bring you a very interesting entry, which I really wanted to add to the series, it's about how to collect Pi-hole statistics. Once we finish all the steps, you should have a result similar to the
VMware: How to extract Temperature information from ESXi for ARM, send it to InfluxDB, and display it with Grafana
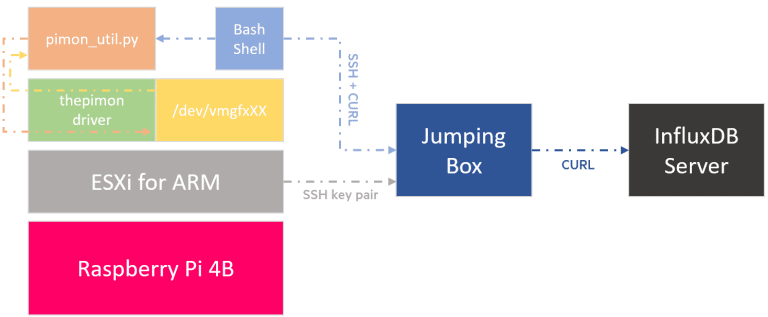
Greetings friends, I told you a few weeks ago what VMware had just launched, and that it was going to revolutionize the world of virtualization and make it, even more, accessible in many new use cases with the new ESXi for ARM. Well, one of the things that worried me the most, I think I mentioned it in the video, was being able to control the
Looking for the Perfect Dashboard: InfluxDB, Telegraf and Grafana – Part XXVIII (Monitoring HPE StoreOnce)
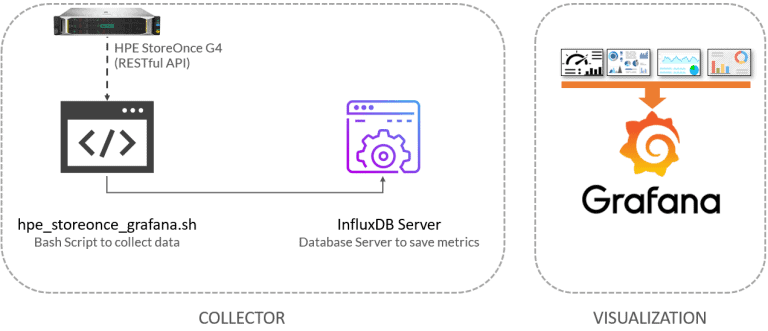
Greetings friends, a new week is a week with a new dashboard, this is so, I would like to be able to offer you many more use cases, with many other technologies, but time is very limited and I only have some nights to prepare this. Today we are going to see a very interesting topic, I was talking about HPE StoreOnce in previous posts, so as you