
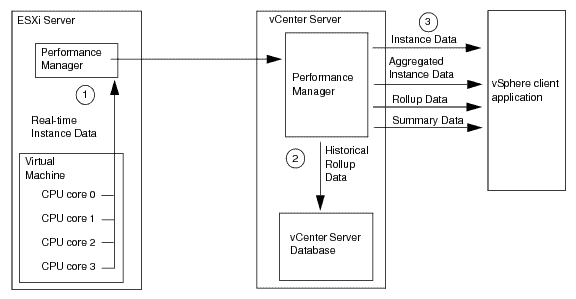
Greetings friends, I have told you in the past how to monitor your VMware environment using InfluxDB, Telegraf, and Grafana, and according to Grafana's dashboard, you are using it with about 4300 people in your Datacenters. All this is great, and I thank you very much for all the support and that so many people have the solution deployed. Now, I
opensource
Looking for the Perfect Dashboard: InfluxDB, Telegraf and Grafana – Part XIX (Monitoring Veeam with Enterprise Manager) Shell Script
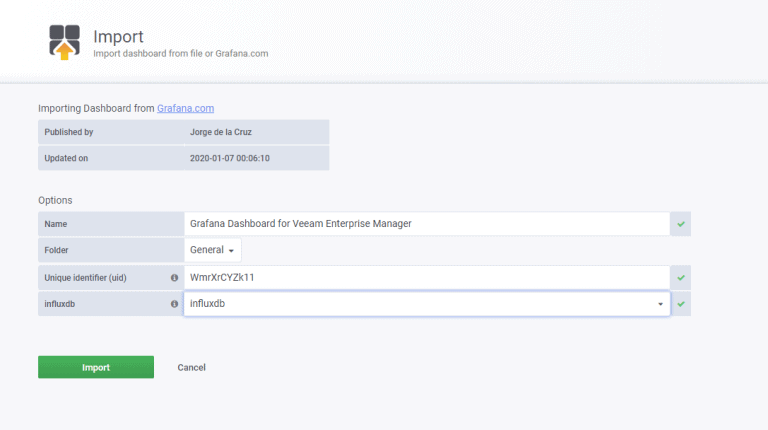
Greetings friends, I bring you a new entry about Grafana and Veeam, which I'm sure you'll like and put in your labs. Back in 2017 I told you how they monitor Veeam using the PowerShell CMDlets and also how to do it using PowerShell and Enterprise Manager RESTful API. These entries have had tens of thousands of hits, but they were more of a proof of
Veeam: Veeam Backup Beta for Microsoft Office 365 v4 – Configuration of Veeam Backup Repository Object Storage connected to FreeNAS (MinIO)
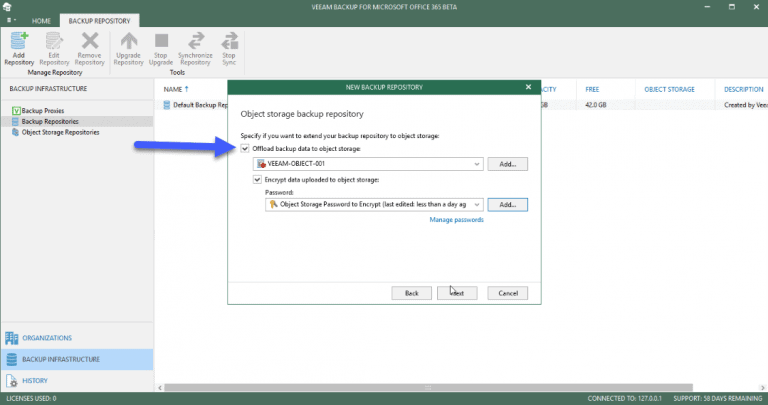
Greetings friends, a few months ago I told you how we could deploy an Object Storage on-prem in a simple way and with just a few clicks. With the release of Veeam Backup for Microsoft Office 365 v4 Beta, this is perfect for us. Veeam Backup for Microsoft Office 365 v4 Beta Veeam has announced its Veeam Backup for Microsoft Office 365 v4 Beta, we
Grafana: Using Microsoft Office 365 for our email notifications
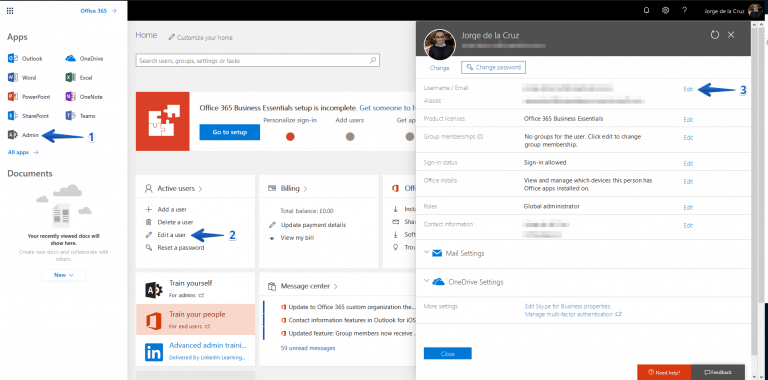
Greetings friends, after so many years counting all the possibilities Grafana, InfluxDB and Telegraf, I have come to realize that we have never dealt with the subject of notifications, so that Grafana alerts us when a value exceeds a certain threshold. Grafana has several methods of sending notifications, Email, Slack and many others that you
FreeNAS: Configure Veeam Backup Repository Object Storage connected to FreeNAS (MinIO) and launch Capacity Tier
Greetings friends, I have been showing you in this series of blogs about FreeNAS, how to deploy it on VMware vSphere in a very comfortable way, how to add an SSL certificate with Let's Encrypt to publish FreeNAS services securely, and how to configure the Object Storage service of FreeNAS (based on MinIO) with just a few clicks. To conclude the