Greetings friends, I have told you in the past how to monitor your VMware environment using InfluxDB, Telegraf, and Grafana, and according to Grafana's dashboard, you are using it with about 4300 people in your Datacenters. All this is great, and I thank you very much for all the support and that so many people have the solution deployed. Now, I
vmware
VMware: How to solve the error with Telegraf and vSphere “Task Name: Remote View Manager, Status: The request refers to an unexpected or unknown type”
Greetings everyone, if you have followed this blog for quite some time, I am sure you have stopped by the blog entry about How to Monitor a vSphere Environment using Grafana, InfluxDB and telegraf. That blog post has tons of comments, and feedback from all of you around the Globe, which is great. Lately I've started receiving some comments about a
VMware: Attend for free to the first North East VMUG of 2019 – Thursday 7th February
Greetings friends, 2019 it is here, and not only that, all the Community events start now to kicking off another season which will be much better than previous years in terms of content and of course new products and integrations. The best option to be on top of all the information out there, presented and delivered by great speakers whom are
VMware: How to configure VCSA 6.7 HA in vSphere Client HTML5, the New High Availability of vCenter Server Appliance
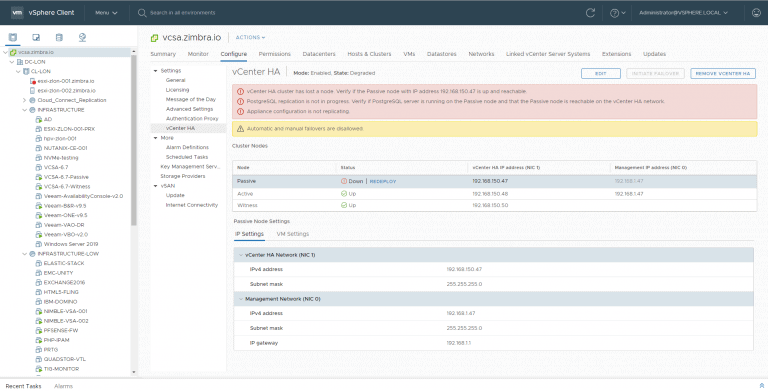
Greetings friends, I told you exactly a year ago about the new HA that VMware had included in vSphere 6.5 for vCenter, you can browse the article here if you continue in vSphere 6.5. Today I bring you the updated article for vSphere 6.7 Update 1 and later, since now everything is done from the HTML 5 Client, aka vSphere Client. What is vCenter
VMworld: How to Download all VMworld 2018 Europe Breakout sessions in.mp4 format
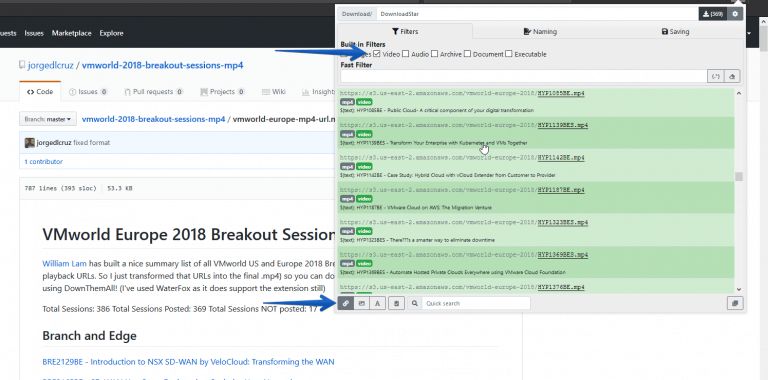
Greetings friends, VMworld 2018 in its version of Europe has already finished, and although I still write about the announcements and news announced or presented, today I bring you how to download all Breakout sessions of this VMworld 2018 Europe as I told you how to do it for the sessions of VMworld 2018 US. GitHub project with all sessions As


