
Greetings friends, during the AWS Re:Invent, Veeam announced its free version for workload protection in AWS, Veeam Backup for AWS, now available in the AWS Marketplace. What is Veeam Backup for AWS Free Edition? Veeam Backup for AWS Free Edition is a native AWS EC2 workload protection solution. This means that Veeam performs snapshots of the EBS
Looking for the Perfect Dashboard: InfluxDB, Telegraf and Grafana – Part XIII – Veeam Backup for Microsoft Office 365
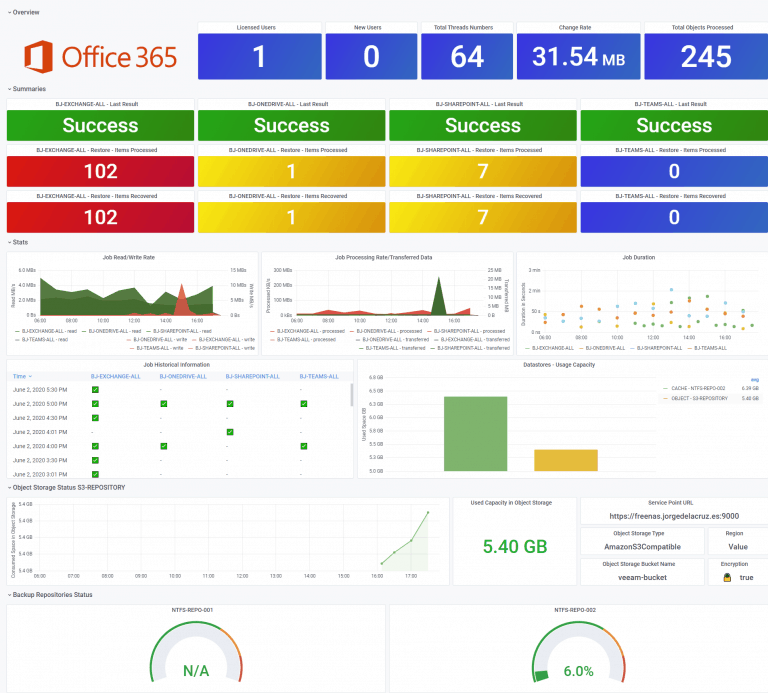
Greetings friends, almost a year ago I launched the Dashboard for Veeam Backup for Microsoft Office 365, in that case, it was the Dashboard for the product v3. With the arrival of the new version of Veeam Backup for Microsoft Office 365 v4, the time has come to update the Dashboard too. I have told you on numerous occasions all the advantages that
Veeam: Six outstanding new functionalities in Veeam Backup for Microsoft Office 365 v4 – Beta
Greetings friends, a few days ago I told you that Veeam Backup for Microsoft Office 365 v4 was in public beta, besides showing you how we could use FreeNAS with Object Storage enabled to launch our copies directly to Object Storage. So far so good, I have received very good feedback on this post, but today I wanted to show you all the news
Veeam: Using Microsoft Teams for our Veeam ONE notifications when alerts are being generated
Greetings friends, after so many years counting all the possibilities of Veeam ONE, I have come to realize that more and more companies are using Microsoft Teams, and that is why today I come to tell you how to configure the notifications of Veeam ONE to Microsoft Teams. How to create and configure the Microsoft Teams Webhook To be able to
Veeam: Deep Overview of What’s New in the RESTful API of Veeam Backup for Microsoft Office 365 v4 – Beta
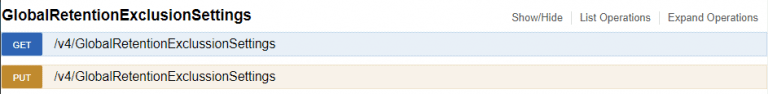
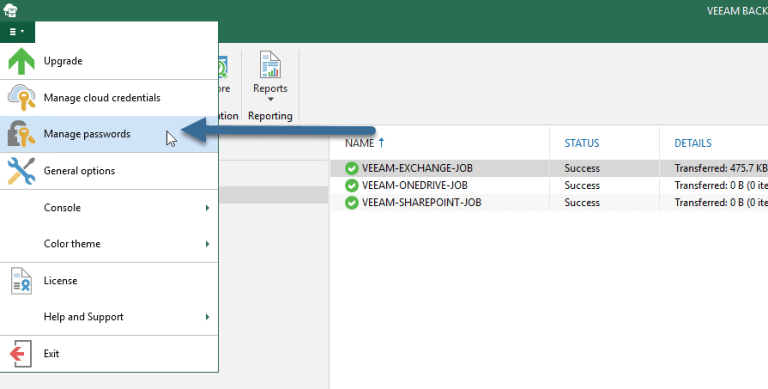
Greetings friends, a few weeks ago I showed you that Veeam had released its Veeam Beta Backup for Microsoft Office 365 v4, and if you are testing it and want to give it a little deeper through API, I think you will like this post. Enable RestAPI in Veeam Backup for Microsoft Office 365 We'll have to run several steps before we start downloading