

Greetings friends, over the years, I have been creating all sort of scripts, dashboards, or tiny applications to solve Customers problems, or Community requests. A few weeks ago I got an interesting use-case. When you are running thousands of workloads in AWS and you want to audit, or submit to compliance the task can become a bit manual, going
Veeam: End of Support for Veeam ONE v11 – Upgrading time to Veeam ONE v12.1

Greetings friends, it is February 2024, and that means that several Veeam products have reached End of Support. In case you do not remember the difference between End of Support, and End of Fix, here is a quick table directly from the official website: End of Fix When a product version reaches this stage, no further Updates, Patches or
Veeam ONE: Unlocking the Holy Grail of Data – Looking inside SQL and Stored Procedures *unsupported*

Greetings friends, for years you know I have been a big advocate of REST API, that is the way to go always, it is modern, it is secure, and it is supported on most cases. Accessing the data through REST API (SUPPORTED & RECOMMENDED) Veeam ONE has a very particular feature-rich API available, that can offer tons of information regarding Data
Microsoft: Quick overview to Microsoft 365 Backup, in Preview currently
Greetings friends, last year Microsoft announced that similar to what they introduced for native Azure, Microsoft 365 would have a native Backup offering. The technology that allows this, and so many other capabilities, is called Syntex, but the specific part for backups it is going to be called Microsoft Backup Storage. And it is finally available
Looking for the Perfect Dashboard: InfluxDB, Telegraf, and Grafana – Part XLV (Monitoring Synology using SNMP v3)
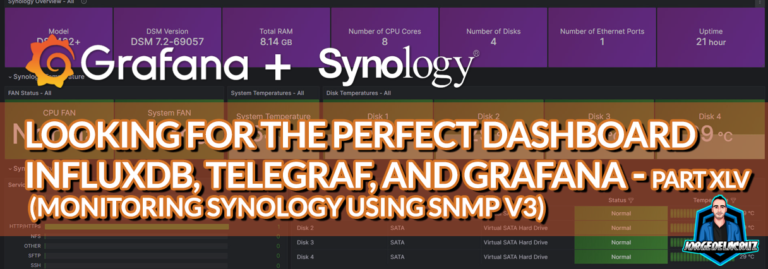
Greetings friends, what an exciting blog I have the honour to start 2024 with. After the very successful dashboard for QNAP, using SNMP v3, I got tons of emails and feedback asking for the same but for Synology. Unfortunately I do not have any Synology Hardware, so I have user Virtual DSM to achieve this dashboard. We are going to use our