• Skip to main content
  • Skip to secondary menu
  • Skip to primary sidebar
The Blog of Jorge de la Cruz

The Blog of Jorge de la Cruz

Everything about VMware, Veeam, InfluxData, Grafana, Zimbra, etc.

  • Home
  • VMWARE
  • VEEAM
    • Veeam Content Recap 2021
    • Veeam v11a
      • Veeam Backup and Replication v11a
    • Veeam Backup for AWS
      • Veeam Backup for AWS v4
    • Veeam Backup for Azure
      • Veeam Backup for Azure v3
    • VeeamON 2021
      • Veeam Announces Support for Red Hat Enterprise Virtualization (RHEV/KVM)
      • Veeam announces enhancements for new versions of Veeam Backup for AWS v4/Azure v3/GVP v2
      • VBO v6 – Self-Service Portal and Native Integration with Azure Archive and AWS S3 Glacier
  • Grafana
    • Part I (Installing InfluxDB, Telegraf and Grafana on Ubuntu 20.04 LTS)
    • Part VIII (Monitoring Veeam using Veeam Enterprise Manager)
    • Part XII (Native Telegraf Plugin for vSphere)
    • Part XIII – Veeam Backup for Microsoft Office 365 v4
    • Part XIV – Veeam Availability Console
    • Part XV – IPMI Monitoring of our ESXi Hosts
    • Part XVI – Performance and Advanced Security of Veeam Backup for Microsoft Office 365
    • Part XVII – Showing Dashboards on Two Monitors Using Raspberry Pi 4
    • Part XIX (Monitoring Veeam with Enterprise Manager) Shell Script
    • Part XXII (Monitoring Cloudflare, include beautiful Maps)
    • Part XXIII (Monitoring WordPress with Jetpack RESTful API)
    • Part XXIV (Monitoring Veeam Backup for Microsoft Azure)
    • Part XXV (Monitoring Power Consumption)
    • Part XXVI (Monitoring Veeam Backup for Nutanix)
    • Part XXVII (Monitoring ReFS and XFS (block-cloning and reflink)
    • Part XXVIII (Monitoring HPE StoreOnce)
    • Part XXIX (Monitoring Pi-hole)
    • Part XXXI (Monitoring Unifi Protect)
    • Part XXXII (Monitoring Veeam ONE – experimental)
    • Part XXXIII (Monitoring NetApp ONTAP)
    • Part XXXIV (Monitoring Runecast)
  • Nutanix
  • ZIMBRA
  • PRTG
  • LINUX
  • MICROSOFT

grafana

Looking for the Perfect Dashboard: InfluxDB, Telegraf and Grafana – Part XV – IPMI Monitoring of our ESXi Hosts

12th June 2019 - Written in: opensource

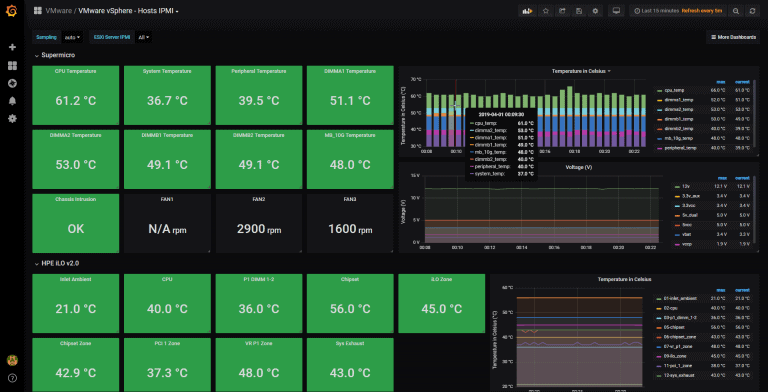
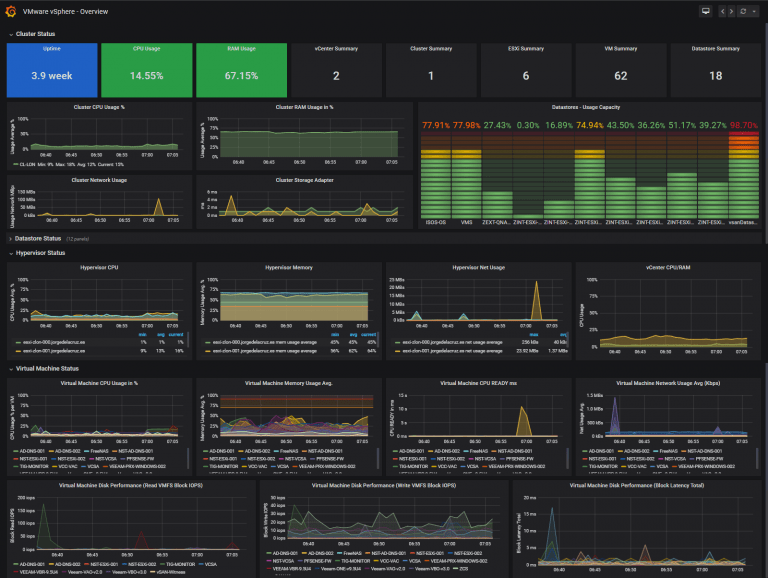
Greetings friends, we have spoken on numerous occasions about the power of InfluxDB, Telegraf and Grafana, if you remember not long ago I left you this fantastic post on how to monitor your vSphere for free and in less than 5 minutes: Looking for the Perfect Dashboard: InfluxDB, Telegraf and Grafana – Part XII (Native Telegraf Plugin for

Continue Reading

Looking for the Perfect Dashboard: InfluxDB, Telegraf and Grafana – Part XIV – Veeam Availability Console

18th January 2019 - Written in: veeam

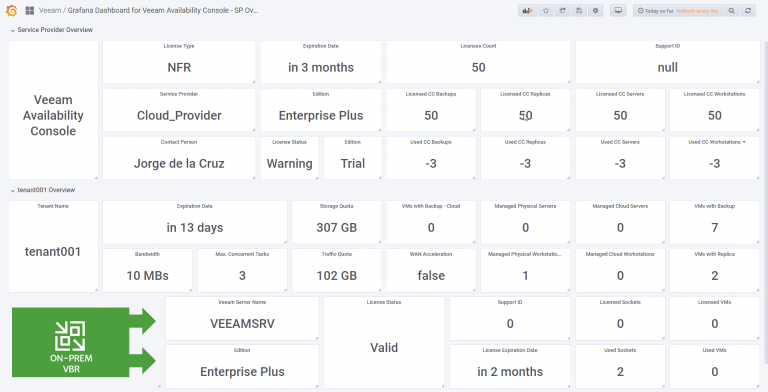
Greetings friends, I have already mentioned all the advantages that a monitoring and dashboarding system has. In fact, you can find all the entries about InfluxDB, Telegraf and Grafana here. Today I bring you a new entry focused on Service Providers of Veeam using Veeam Cloud Connect, in this case it’s a Dashboard that will increase the visibility

Continue Reading

Looking for the Perfect Dashboard: InfluxDB, Telegraf and Grafana – Part XIII – Veeam Backup for Microsoft Office 365

17th December 2018 - Written in: veeam

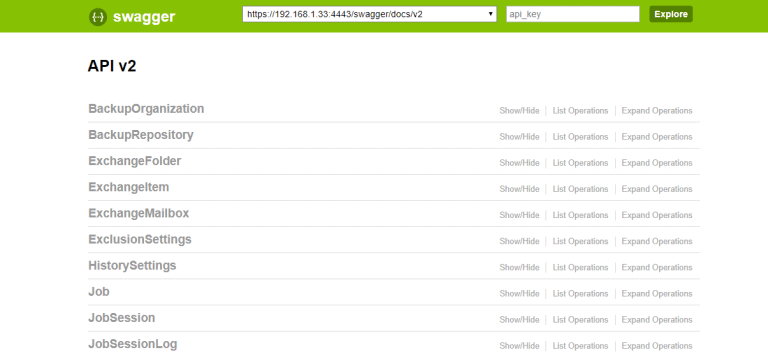
Greetings friends, I have told you on numerous occasions all the advantages that a monitoring and dashboarding system has. In fact, you can find all the entries about InfluxDB, Telegraf and Grafana here. Today I bring you a new entry, in this case it's a Dashboard that will come to you in luxury for your Veeam Backup for Microsoft Office 365 v2.0.

Continue Reading

Looking for the Perfect Dashboard: InfluxDB, Telegraf and Grafana – Part XII (Native Telegraf Plugin for vSphere)

1st October 2018 - Written in: linux, vmware

Greetings friends, today I bring you another one of those hidden gems that you like so much. In addition to being free and being able to display it in a few minutes, it has a potential that many commercial tools would like. Today we are about to create four fresh Grafana Dashboards within minutes, at the end of the blog, we can have some

Continue Reading

Looking for the Perfect Dashboard: InfluxDB, Telegraf and Grafana – Part VIII (Monitoring Veeam using Veeam Enterprise Manager)

26th July 2017 - Written in: veeam

Hello everyone, in February of this year I wrote a script to monitor a Veeam Environment using the VeeamPSSnapIn, you can check it out on the Github page here. This post was a tremendous success, at even I had the chance to explain a bit more to the VeeamON participants, celebrated in New Orleans. But it has a minor shortcoming, it might run

Continue Reading

  • « Go to Previous Page
  • Page 1
  • Page 2
  • Page 3
  • Page 4

Primary Sidebar

  • E-mail
  • GitHub
  • LinkedIn
  • RSS
  • Twitter
  • YouTube

Posts Calendar

May 2025
M T W T F S S
 1234
567891011
12131415161718
19202122232425
262728293031  
« Mar    

Disclaimer

All opinions expressed on this site are my own and do not represent the opinions of any company I have worked with, am working with, or will be working with.

Copyright © 2025 · The Blog of Jorge de la Cruz