• Skip to main content
  • Skip to secondary menu
  • Skip to primary sidebar
The Blog of Jorge de la Cruz

The Blog of Jorge de la Cruz

Everything about VMware, Veeam, InfluxData, Grafana, Zimbra, etc.

  • Home
  • VMWARE
  • VEEAM
    • Veeam Content Recap 2021
    • Veeam v11a
      • Veeam Backup and Replication v11a
    • Veeam Backup for AWS
      • Veeam Backup for AWS v4
    • Veeam Backup for Azure
      • Veeam Backup for Azure v3
    • VeeamON 2021
      • Veeam Announces Support for Red Hat Enterprise Virtualization (RHEV/KVM)
      • Veeam announces enhancements for new versions of Veeam Backup for AWS v4/Azure v3/GVP v2
      • VBO v6 – Self-Service Portal and Native Integration with Azure Archive and AWS S3 Glacier
  • Grafana
    • Part I (Installing InfluxDB, Telegraf and Grafana on Ubuntu 20.04 LTS)
    • Part VIII (Monitoring Veeam using Veeam Enterprise Manager)
    • Part XII (Native Telegraf Plugin for vSphere)
    • Part XIII – Veeam Backup for Microsoft Office 365 v4
    • Part XIV – Veeam Availability Console
    • Part XV – IPMI Monitoring of our ESXi Hosts
    • Part XVI – Performance and Advanced Security of Veeam Backup for Microsoft Office 365
    • Part XVII – Showing Dashboards on Two Monitors Using Raspberry Pi 4
    • Part XIX (Monitoring Veeam with Enterprise Manager) Shell Script
    • Part XXII (Monitoring Cloudflare, include beautiful Maps)
    • Part XXIII (Monitoring WordPress with Jetpack RESTful API)
    • Part XXIV (Monitoring Veeam Backup for Microsoft Azure)
    • Part XXV (Monitoring Power Consumption)
    • Part XXVI (Monitoring Veeam Backup for Nutanix)
    • Part XXVII (Monitoring ReFS and XFS (block-cloning and reflink)
    • Part XXVIII (Monitoring HPE StoreOnce)
    • Part XXIX (Monitoring Pi-hole)
    • Part XXXI (Monitoring Unifi Protect)
    • Part XXXII (Monitoring Veeam ONE – experimental)
    • Part XXXIII (Monitoring NetApp ONTAP)
    • Part XXXIV (Monitoring Runecast)
  • Nutanix
  • ZIMBRA
  • PRTG
  • LINUX
  • MICROSOFT

veeam monitoring

Looking for the Perfect Dashboard: InfluxDB, Telegraf and Grafana – Part XXIV (Monitoring Veeam Backup for Microsoft Azure)

30th April 2020 - Written in: veeam

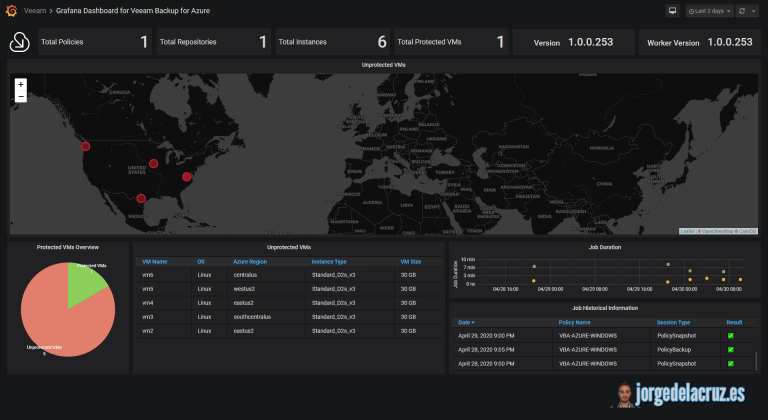
Greetings friends, I bring you a new entry about Grafana and Veeam, which I'm sure you'll like and put in your labs. Veeam has recently announced Veeam Backup for Microsoft Azure. Along the ton of functionalities that the product includes, one is a public RESTFul API, and I thought it could be a good idea to create a Dashboard for this

Continue Reading

Looking for the Perfect Dashboard: Veeam ONE – Part IX – Chargeback to create cost reports of our Infrastructure

21st February 2020 - Written in: veeam

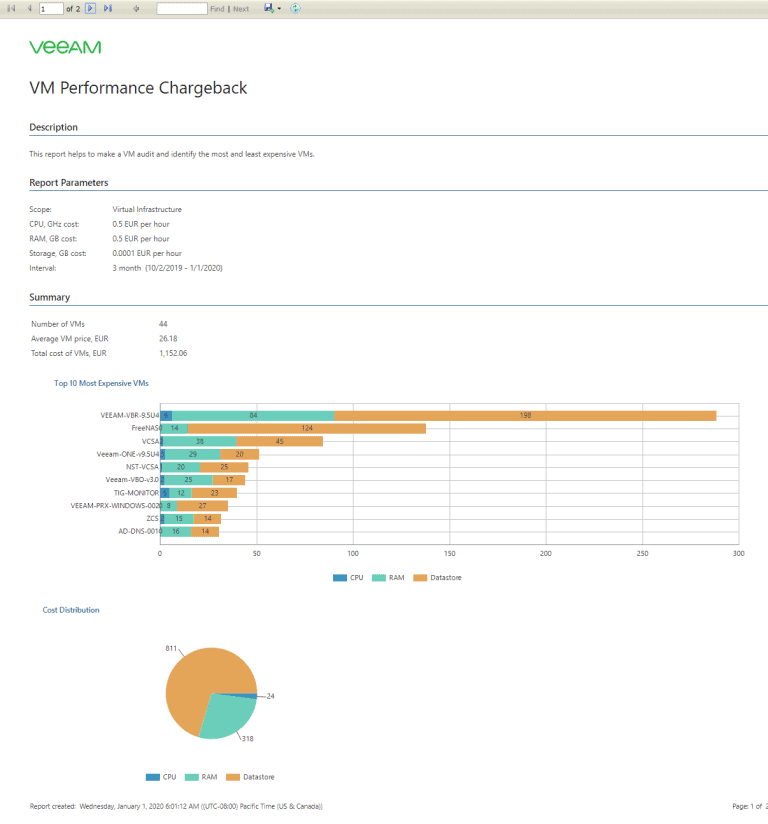
Greetings friends, we arrive at the last entry about In Search of the perfect Dashboard using Veeam ONE, we have seen in-depth many features that surely you had overlooked, or even maybe you didn't know if so I feel happy to have written it. Today we are going to see how to use the Chargeback reports in Veeam ONE. When we talk about Chargeback,

Continue Reading

Looking for the Perfect Dashboard: Veeam ONE – Part VIII – In-depth look at Reports in Veeam ONE Reporter

20th February 2020 - Written in: veeam

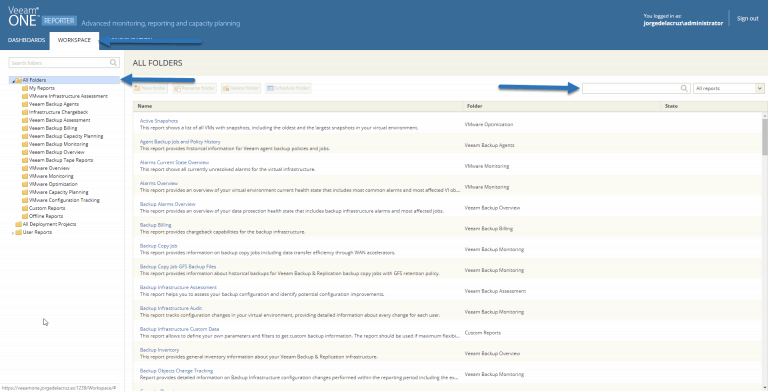
Greetings friends, during the past entries of this series, we have seen Veeam ONE in-depth, and many of its components and features, today we will see one that is especially important to have everything under control and be able to create weekly utility reports, or automated for the departments that need it most. Veeam ONE Reporter - Detailed

Continue Reading

Looking for the Perfect Dashboard: Veeam ONE – Part VII – Dashboards at a Glance in the Veeam ONE Reporter

19th February 2020 - Written in: veeam

Greetings friends, today we are going to see in detail, how the Backup Infrastructure Administrators do not get their fingers caught in the resources, and how to create reports that help them understand which environment is busiest. Veeam ONE Reporter - Dashboards give you a deep insight into your environment You know that I have a certain

Continue Reading

Looking for the Perfect Dashboard: Veeam ONE – Part VI – Troubleshooting Veeam Backup and Replication using Veeam ONE Monitor

18th February 2020 - Written in: veeam

Greetings friends, today we are going to see in detail, how the Backup Infrastructure Administrators do not get their fingers caught in the resources, and how to create reports that help them understand which environment is busiest. Veeam ONE Heatmap - A quick look at how busy our environment is One of the best bird's eye views we have is the one

Continue Reading

  • Page 1
  • Page 2
  • Page 3
  • Page 4
  • Go to Next Page »

Primary Sidebar

  • E-mail
  • GitHub
  • LinkedIn
  • RSS
  • Twitter
  • YouTube

Posts Calendar

May 2025
M T W T F S S
 1234
567891011
12131415161718
19202122232425
262728293031  
« Mar    

Disclaimer

All opinions expressed on this site are my own and do not represent the opinions of any company I have worked with, am working with, or will be working with.

Copyright © 2025 · The Blog of Jorge de la Cruz