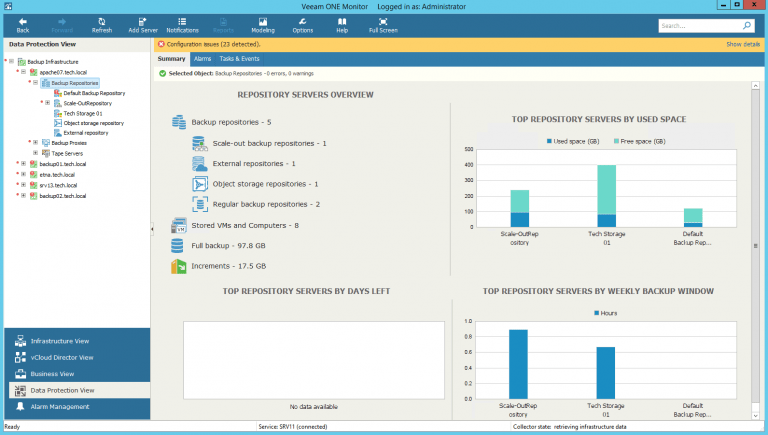
Greetings friends, today we start another series on monitoring vSphere and Veeam environments, in this case, we will use a corporate tool such as Veeam ONE. In this series, we are going to see from less to more, covering from the basics, to the most advanced, with scenarios that we can find day by day. I hope you like the series, you have the
veeam monitoring
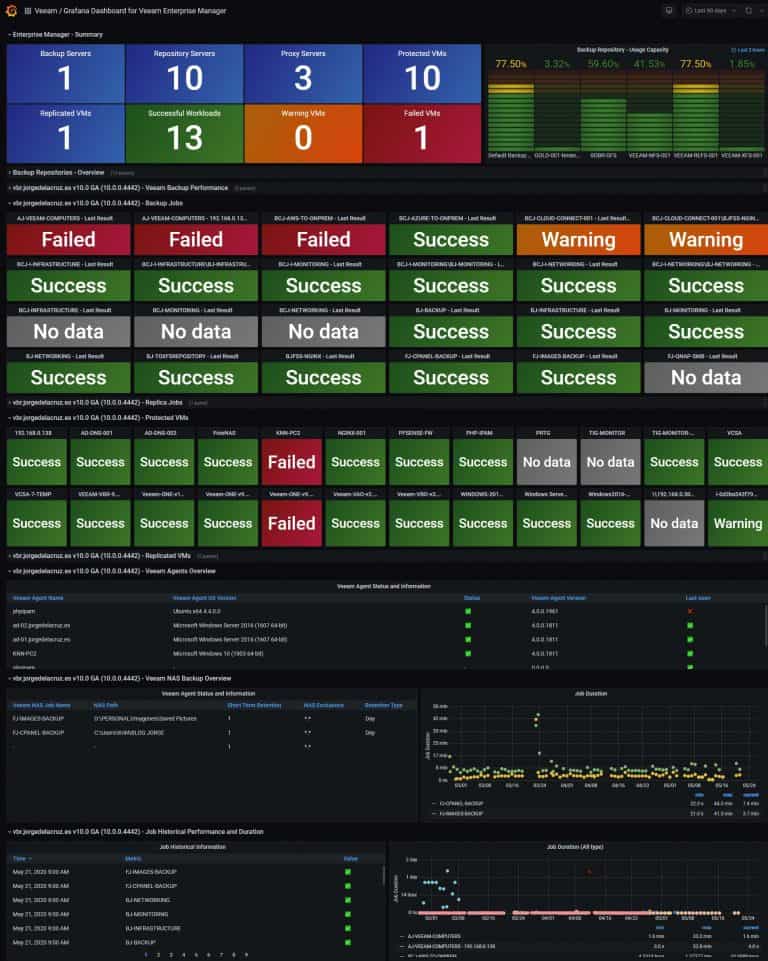
Looking for the Perfect Dashboard: InfluxDB, Telegraf and Grafana – Part XIX (Monitoring Veeam with Enterprise Manager) Shell Script
Greetings friends, I bring you a new entry about Grafana and Veeam, which I'm sure you'll like and put in your labs. Back in 2017 I told you how they monitor Veeam using the PowerShell CMDlets and also how to do it using PowerShell and Enterprise Manager RESTful API. These entries have had tens of thousands of hits, but they were more of a proof of
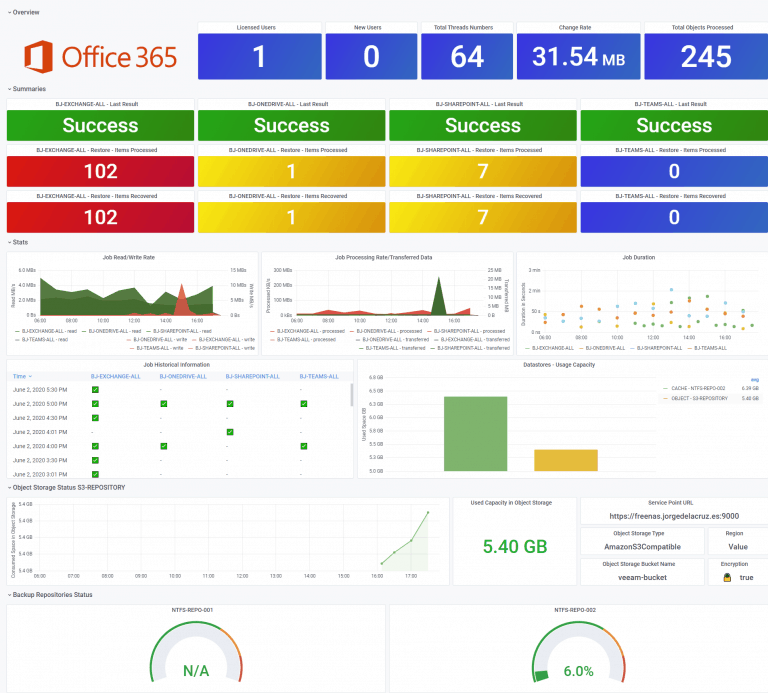
Looking for the Perfect Dashboard: InfluxDB, Telegraf and Grafana – Part XIII – Veeam Backup for Microsoft Office 365
Greetings friends, almost a year ago I launched the Dashboard for Veeam Backup for Microsoft Office 365, in that case, it was the Dashboard for the product v3. With the arrival of the new version of Veeam Backup for Microsoft Office 365 v4, the time has come to update the Dashboard too. I have told you on numerous occasions all the advantages that
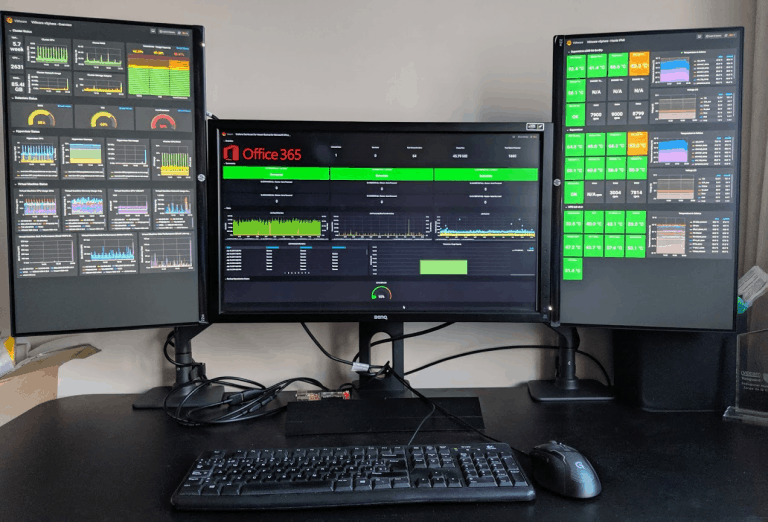
Looking for the Perfect Dashboard: InfluxDB, Telegraf and Grafana – Part XVII – Showing Dashboards on Two Monitors Using Raspberry Pi 4
Greetings friends, I have been telling you throughout the series on Grafana many things, from how to monitor Linux, Windows, Veeam, VMware, and also the Server temperature using IPMI. Today I thought it convenient to show you the step by step to be able to visualize our Dashboards, if we have followed all the series will be already about 16
Looking for Perfect Dashboard: InfluxDB, Telegraf and Grafana – Part XVI – Performance and Advanced Security of Veeam Backup for Microsoft Office 365
Greetings friends, I come to the sixteenth post on InfluxDB, Telegraf and Grafana, you can find all the posts on InfluxDB, Telegraf and Grafana here. Today I bring you a new entry, in this case it is a Dashboard focused on advanced security when we use Veeam Backup for Microsoft Office 365. Veeam Backup for Microsoft Office 365 is in charge of


