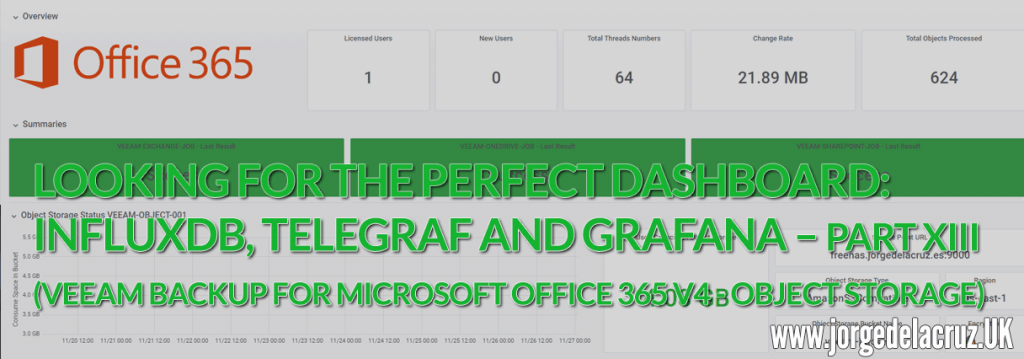
 Greetings friends, almost a year ago I launched the Dashboard for Veeam Backup for Microsoft Office 365, in that case, it was the Dashboard for the product v3. With the arrival of the new version of Veeam Backup for Microsoft Office 365 v4, the time has come to update the Dashboard too. I have told you on numerous occasions all the advantages that a monitoring and dashboarding system has.
In fact, you can find all the entries about InfluxDB, Telegraf, and Grafana here. Remember that there is a Community Edition with up to 10 free users, without paying anything).Veeam Backup for Microsoft Office 365 Dashboard
Grafana Dashboard for Veeam Backup for Microsoft 365
What’s new in this new Dashboard for Veeam Backup for Microsoft 365
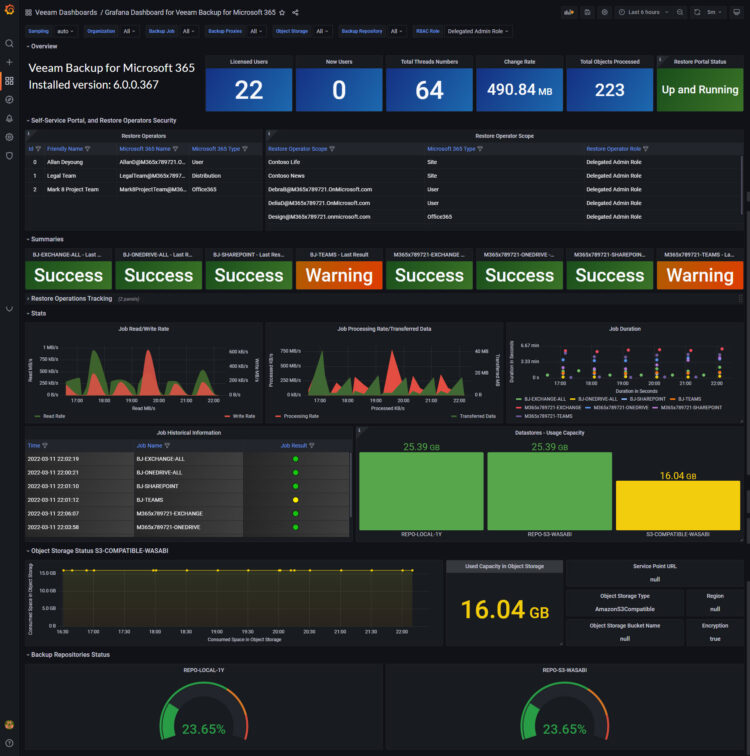
I already told you that among the great new functionalities we found Object Storage and at-rest encryption of what we stored in this Object Storage, which is why the new Dashboard shows us the local repositories, vs Object Storage: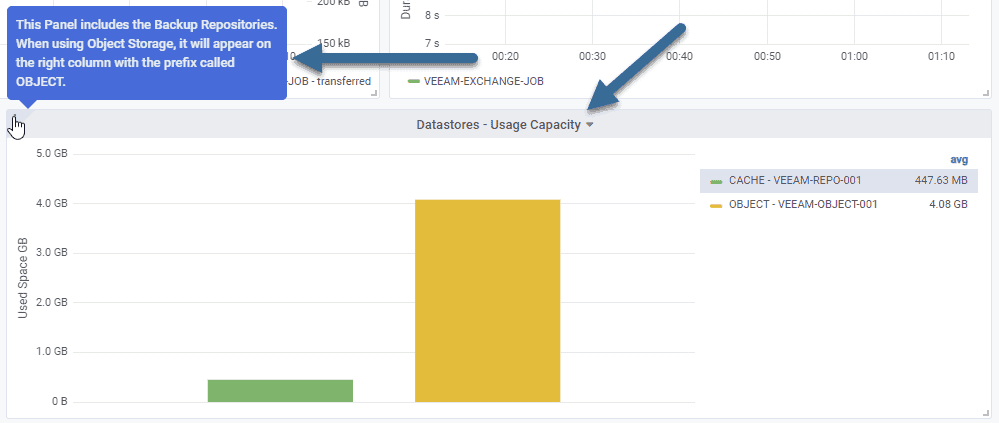
Besides showing us the detail of each object storage repository, such as the size over time, name, service point, and whether or not it has encryption: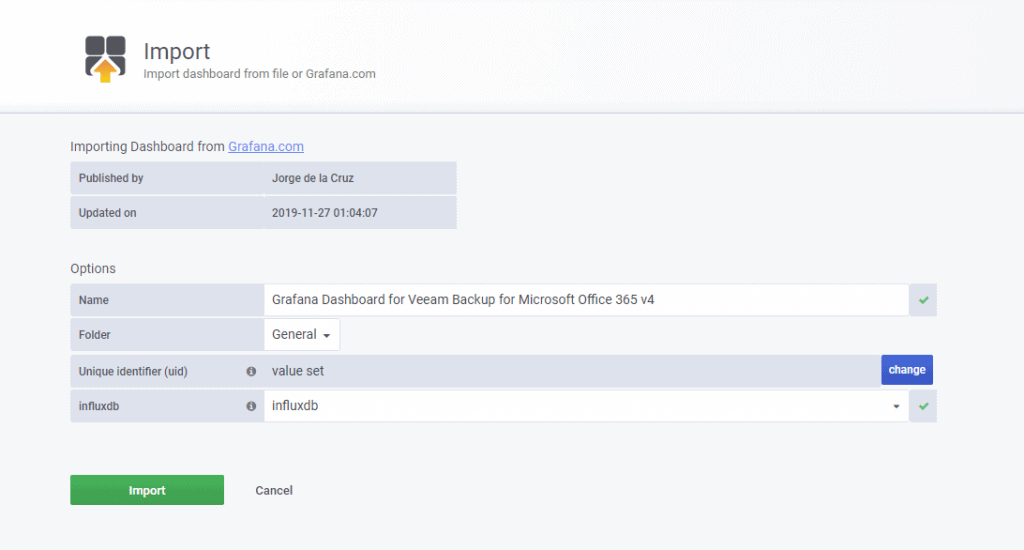
These are very subtle improvements but I hope you like them.
How to Enable the RestAPI in Veeam Backup for Microsoft 365
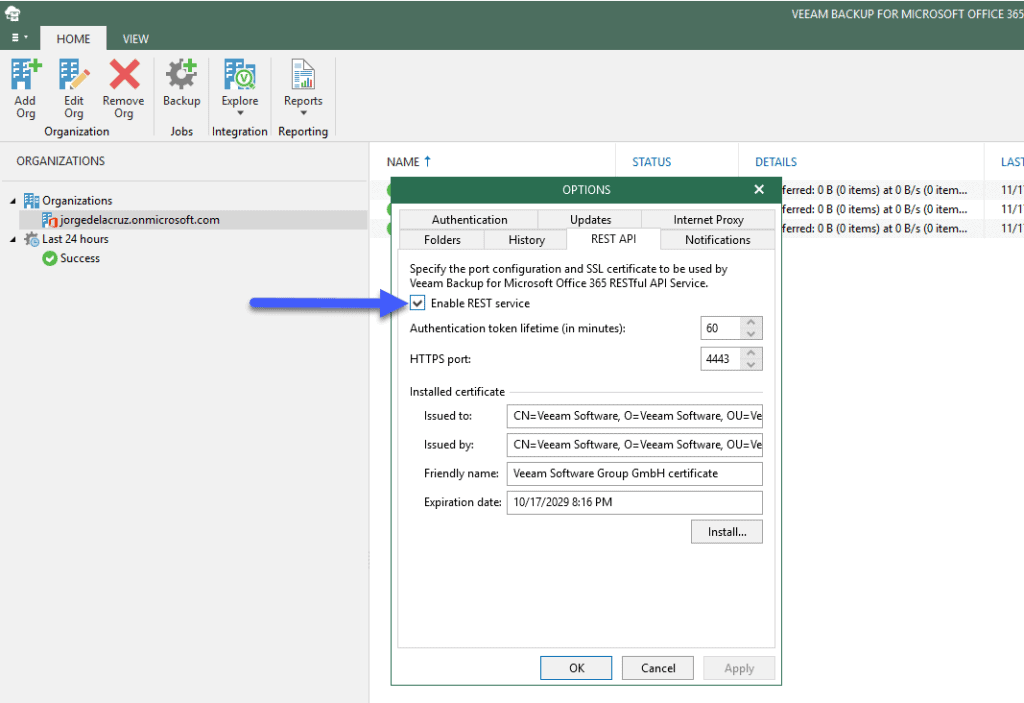
We’ll have to run several steps before we start downloading anything, or even touching Grafana, from our Veeam Backup for Microsoft Office 365, we’ll go in the Console to the menu icon, and then General options: 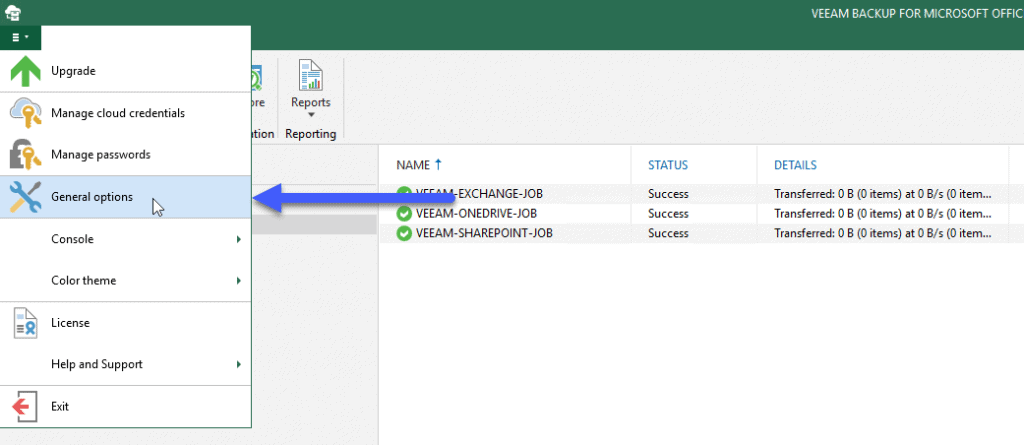 We will go to the sub-menu called REST API and enable the REST service, also here we could install our own SSL, and change the timeout of the tokens and the port of SSL, in my case I have not changed anything:
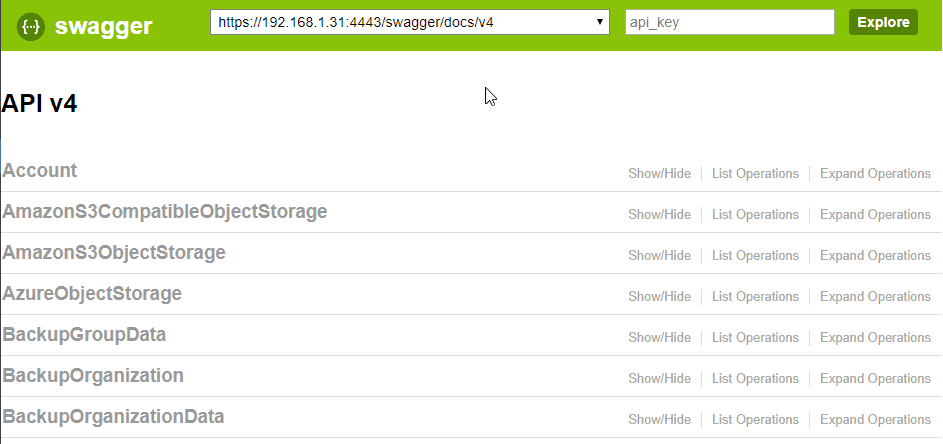
  With this, we can go to our browser and explore the SWAGGER that Veeam Backup for Microsoft Office 365 brings as standard, we will find it at https://VBOURL:4443/swagger and must look like this:
 Now with this we are ready to continue towards the Perfect Dashboard for Veeam Backup for Microsoft Office 365 v4.
Veeam Backup for Microsoft 365 RestAPI Script
The script that can be downloaded directly from GitHub requires a brief configuration with certain parameters of our environments, but before we see this configuration, let’s see what this script gathers from RestAPI:
- Number of Licensed Users
- Number of new Users recently added to VBO
- Total number of threads of the Proxies
- Total number of objects processed in the backups
- Summary of the latest Backup status – by job
- Summary of the latest restoration – by job and by component
- Statistics on reading and writing in MB/s – per job
- Statistics on information processed in MB/s and data written in MB – per job
- Statistics on the time it has taken each Backup – per job
- Summary table with the status of each Backup – by job
- Summary table with the consumption of each Backup Repository
- Summary table with the consumption of each Object Storage
- Disk Capacity Meter for each Backup Repository
- Disk Capacity Meter for each Object Storage
We will make sure we have jq installed, an apt-get install jq or yum install jq if we use CentOS:
sudo apt-get install jq
Once we download the script to our InfluxDB server, we’ll edit it and change the following:
# Endpoint URL for InfluxDB
veeamInfluxDBURL="http://YOURINFLUXSERVERIP" #Your InfluxDB Server, http://FQDN or https://FQDN if using SSL
veeamInfluxDBPort="8086" #Default Port
veeamInfluxDBBucket="veeam" # InfluxDB bucket name (not ID)
veeamInfluxDBToken="TOKEN" # InfluxDB access token with read/write privileges for the bucket
veeamInfluxDBOrg="ORG NAME" # InfluxDB organisation name (not ID)

# Endpoint URL for login action
veeamUsername="YOURVBOUSER"
veeamPassword="YOURVBOPASSWORD"
veeamRestServer="https://YOURVBOSERVERIP"
veeamRestPort="4443" #Default Port
Once we edit these parameters, make the script executable:
chmod +x veeam_microsoft365.sh
We will be able to execute it manually if we want to see what it does, we would have to observe an output like the next one repeated many times:
HTTP/1.1 204 No Content
Content-Type: application/json
Request-Id: c1c18f61-10b2-11ea-909a-000000000000
X-Influxdb-Build: OSS
X-Influxdb-Version: 1.6.3
X-Request-Id: c1c18f61-10b2-11ea-909a-000000000000
Date: Wed, 27 Nov 2019 01:10:52 GMT
This is fine, and that’s what has to come out, now we have to program our script to launch automatically as often as we want, in my case every 30 minutes, we will use crontab -e to add it to cron, use your own path:
*/30 * * * * * /home/oper/veeam_office365.sh >> /var/log/veeamvbo.log 2>&1
Verifying that we are ingesting information with Chronograf
The normal thing at this point, if we have done all the steps well, is that we are already sending information compiled by the script to InfluxDB, if we do a search using the wonderful Chronograf, we can see that we have information: 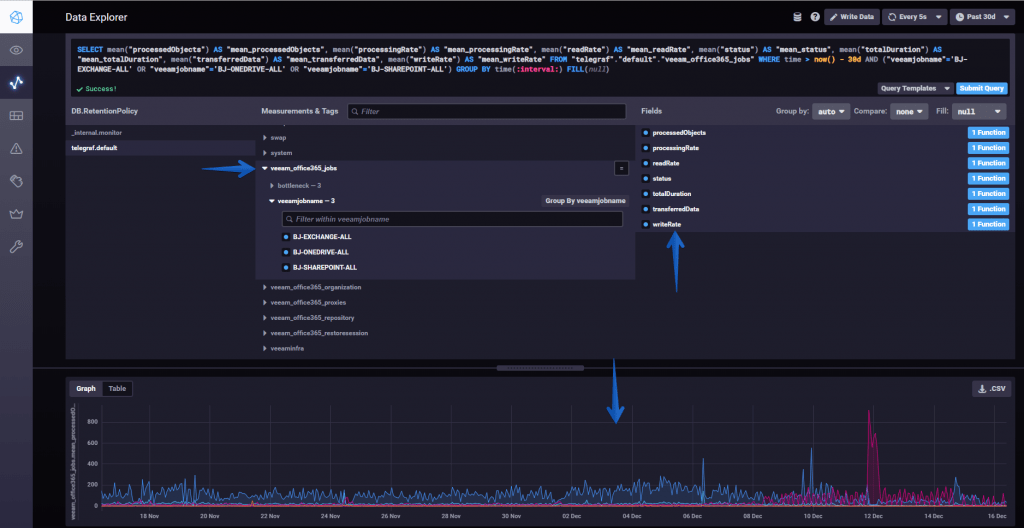 All the variables of this new Veeam script for VBO are stored in veeam_office365_* so it is really easy to find them.
Grafana Dashboards
I have created a Dashboard from scratch selecting the best requests to the database, finishing off colors, thinking what graphic and how to show it, and everything is automated so that it fits our environment without any problem and without having to edit anything manually. You can find the Dashboard here, once imported, you can use the top dropdown menus to select between organizations, backups, repositories, and proxies:
How to Import easily the Grafana Dashboard
So that you don’t have to waste hours configuring a new Dashboard, and ingesting and debugging queries, I’ve already created a wonderful Dashboard with everything you need to monitor our environment in a very simple way, it will look like the image I showed you above.
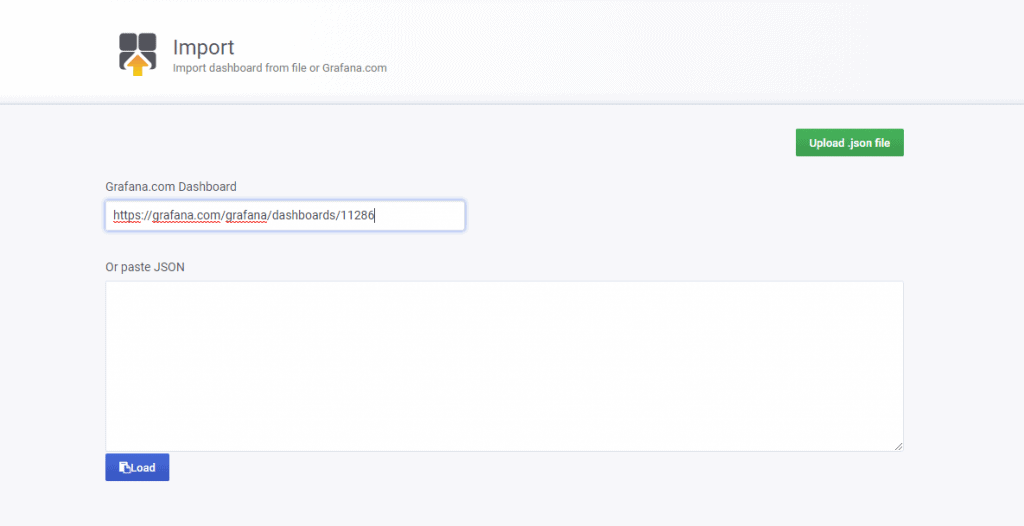
Select Create Dashboard – Import
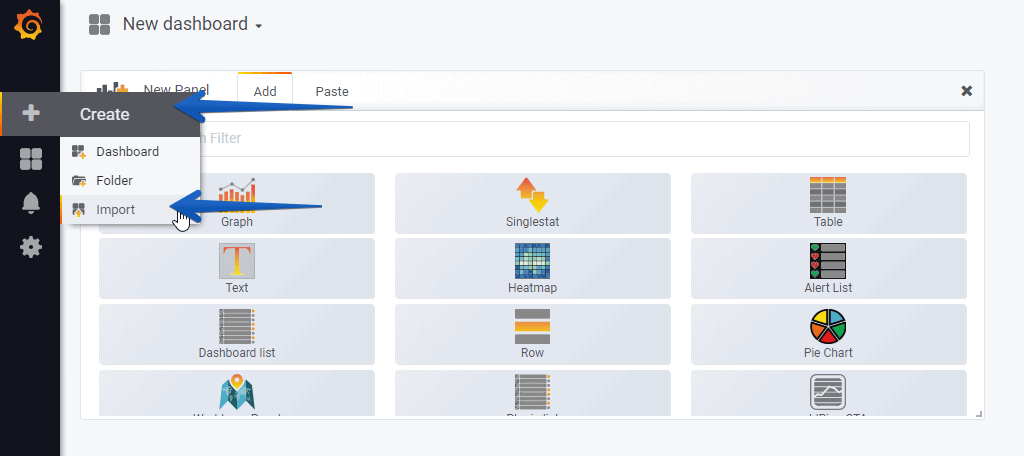 Select the name you want and enter the ID: 11286, which is the unique ID of the Dashboard, or the URL:
 With the menus above you can deploy and adjust the Dashboard to your organization, backup jobs, object storage, and so on:
 Please leave your feedback in the comments, or in GitHub. If you want to see them working without installing anything, here is the link to my environment:
I hope you like it, and I would like to leave you the complete series here, so you can start playing with the plugins that I have been telling you about all these years:
- Looking for the Perfect Dashboard: InfluxDB, Telegraf, and Grafana – Part I (Installing InfluxDB, Telegraf, and Grafana on Ubuntu 20.04 LTS)
- En busca del Dashboard perfecto: InfluxDB, Telegraf y Grafana – Parte II (Instalar agente Telegraf en Nodos remotos Linux)
- En busca del Dashboard perfecto: InfluxDB, Telegraf y Grafana – Parte III Integración con PRTG
- En busca del Dashboard perfecto: InfluxDB, Telegraf y Grafana – Parte IV (Instalar agente Telegraf en Nodos remotos Windows)
- En busca del Dashboard perfecto: InfluxDB, Telegraf y Grafana – Parte V (Activar inputs específicos, Red, MySQL/MariaDB, Nginx)
- En busca del Dashboard perfecto: InfluxDB, Telegraf y Grafana – Parte VI (Monitorizando Veeam)
- En busca del Dashboard perfecto: InfluxDB, Telegraf y Grafana – Parte VII (Monitorizar vSphere)
- En busca del Dashboard perfecto: InfluxDB, Telegraf y Grafana – Parte VIII (Monitorizando Veeam con Enterprise Manager)
- En busca del Dashboard perfecto: InfluxDB, Telegraf y Grafana – Parte IX (Monitorizando Zimbra Collaboration)
- En busca del Dashboard perfecto: InfluxDB, Telegraf y Grafana – Parte X (Grafana Plugins)
- En busca del Dashboard perfecto: InfluxDB, Telegraf y Grafana – Parte XI – (Monitorizando URL e IPS con Telegraf y Ping)
- Looking for the Perfect Dashboard: InfluxDB, Telegraf, and Grafana – Part XII (Native Telegraf Plugin for vSphere)
- Looking for the Perfect Dashboard: InfluxDB, Telegraf, and Grafana – Part XIII (Veeam Backup for Microsoft Office 365 v4)
- Looking for the Perfect Dashboard: InfluxDB, Telegraf, and Grafana – Part XIV – Veeam Availability Console
- Looking for the Perfect Dashboard: InfluxDB, Telegraf, and Grafana – Part XV (IPMI Monitoring of our ESXi Hosts)
- Looking for Perfect Dashboard: InfluxDB, Telegraf, and Grafana – Part XVI (Performance and Advanced Security of Veeam Backup for Microsoft Office 365)
- Looking for the Perfect Dashboard: InfluxDB, Telegraf, and Grafana – Part XVII (Showing Dashboards on Two Monitors Using Raspberry Pi 4)
- En busca del Dashboard perfecto: InfluxDB, Telegraf y Grafana – Parte XVIII – Monitorizar temperatura y estado de Raspberry Pi 4
- Looking for the Perfect Dashboard: InfluxDB, Telegraf, and Grafana – Part XIX (Monitoring Veeam with Enterprise Manager) Shell Script
- Looking for the Perfect Dashboard: InfluxDB, Telegraf, and Grafana – Part XXIV (Monitoring Veeam Backup for Microsoft Azure)
- Looking for the Perfect Dashboard: InfluxDB, Telegraf, and Grafana – Part XXV (Monitoring Power Consumption)
- Looking for the Perfect Dashboard: InfluxDB, Telegraf, and Grafana – Part XXVI (Monitoring Veeam Backup for Nutanix)
- Looking for the Perfect Dashboard: InfluxDB, Telegraf, and Grafana – Part XXVII (Monitoring ReFS and XFS (block-cloning and reflink)
- Looking for the Perfect Dashboard: InfluxDB, Telegraf, and Grafana – Part XXVIII (Monitoring HPE StoreOnce)
- Looking for the Perfect Dashboard: InfluxDB, Telegraf, and Grafana – Part XXIX (Monitoring Pi-hole)
- Looking for the Perfect Dashboard: InfluxDB, Telegraf, and Grafana – Part XXIX (Monitoring Veeam Backup for AWS)
- Looking for the Perfect Dashboard: InfluxDB, Telegraf, and Grafana – Part XXXI (Monitoring Unifi Protect)
- Looking for the Perfect Dashboard: InfluxDB, Telegraf, and Grafana – Part XXXII (Monitoring Veeam ONE – experimental)
- Looking for the Perfect Dashboard: InfluxDB, Telegraf, and Grafana – Part XXXIII (Monitoring NetApp ONTAP)
- Looking for the Perfect Dashboard: InfluxDB, Telegraf, and Grafana – Part XXXIV (Monitoring Runecast)
- Looking for the Perfect Dashboard: InfluxDB, Telegraf, and Grafana – Part XXXV (GPU Monitoring)
- Looking for the Perfect Dashboard: InfluxDB, Telegraf, and Grafana – Part XXXVI (Monitoring Goldshell Miners – JSONv2)
- Looking for the Perfect Dashboard: InfluxDB, Telegraf, and Grafana – Part XXXVII (Monitoring Veeam Backup for Google Cloud Platform)
- En Busca del Dashboard perfecto: InfluxDB, Telegraf y Grafana – Parte XXXVIII (Monitorizando Temperatura y Humedad con Xiaomi Mijia)
- Looking for the Perfect Dashboard: InfluxDB, Telegraf, and Grafana – Part XL (Veeam Backup for Microsoft 365 – Restore Audit)
- Looking for the Perfect Dashboard: InfluxDB, Telegraf, and Grafana – Part XLI (Veeam Backup for Salesforce)
- Looking for the Perfect Dashboard: InfluxDB, Telegraf, and Grafana – Part XLII (Veeam ONE v12 Audit Events)
- Looking for the Perfect Dashboard: InfluxDB, Telegraf, and Grafana – Part XLIII (Monitoring QNAP using SNMP v3)
- Looking for the Perfect Dashboard: InfluxDB, Telegraf, and Grafana – Part XLIV (Monitoring Veeam Backup & Replication API)
- Looking for the Perfect Dashboard: InfluxDB, Telegraf, and Grafana – Part XLV (Monitoring Synology using SNMP v3)
- Looking for the Perfect Dashboard: InfluxDB, Telegraf, and Grafana – Part XLVI (Monitoring NVIDIA Jetson Nano)
- Looking for the Perfect Dashboard: InfluxDB, Telegraf, and Grafana – Part XLVII (Monitoring Open WebUI)
- Looking for the Perfect Dashboard: InfluxDB, Telegraf, and Grafana – Part XLVIII (Monitoring Veeam Data Platform Advanced)
- Looking for the Perfect Dashboard: InfluxDB, Telegraf, and Grafana – Part XLIX (Monitoring Unofficial Veeam ONE Node Exporter)

Hello Jorge
I have built a Ubuntu Server and installed Telegraf, Influxdb and Grafana
I have modified your script as per above with login details.
I am getting an error when the script runs
HTTP/1.1 400 Bad Request
Content-Type: application/json
Request-Id: 129ecc4d-1cf0-11ea-8984-00505681dd93
X-Influxdb-Build: OSS
X-Influxdb-Error: unable to parse ‘veeam_office365_objectstorage,objectname=null,type=null,bucketname=null,servicePoint=null,customRegi
onId=null,location=null,region=null,objectStorageEncryptionEnabled=null usedSpaceGB=null’: invalid number
X-Influxdb-Version: 1.7.9
X-Request-Id: 129ecc4d-1cf0-11ea-8984-00505681dd93
Date: Thu, 12 Dec 2019 15:00:01 GMT
Content-Length: 235
This occurs twice and then the script completesOK
It shows in Grafana OK
Many thanks
Best regards
Clive
Hello,
Are you using Object Storage? Maybe not, so I will add a condition to check if you do not have it to save just it as 0.
Thanks for the feedback
I am replying to an older post so hopefully it gets to you. We have followed the directions for our Veeam environment (we are a VCSP) but aren’t Linux proficient and are trying to determine how to insert your script into InfluxDB to make the Dashboard work in Grafana. We have Grafana installed on our main Veeam VBR and Office 365 backup server and InfluxDB is setup, but no data coming into the Dashboard as the script isn’t installed. Any help would be appreciated. Thank you.
Hello Matt,
I always read all the comments. That is odd, send me an email to jorge.delacruzATveeamDOTcom so we can keep the conversation there, or if you have Teams, then add me 🙂
Jorge, I’m using Ubuntu/Docker with Influxdb/Telegraf/grafana and when I run chmod +x veeam-office365.sh the output is nothing. Just runs. When I run the .sh I get:./veeam-office365.sh: line 35: jq: command not found
./veeam-office365.sh: line 44: jq: command not found
./veeam-office365.sh: line 141: jq: command not found
./veeam-office365.sh: line 180: jq: command not found
./veeam-office365.sh: line 197: jq: command not found
./veeam-office365.sh: line 248: jq: command not found
Could really use some help here.
Hello Jason,
You need to install jq, just with apt-get install jq or yum install jq
Hello Jorge
I have created a new setup to go live and get the following error running the grafana script (veeam_office365.sh)
jq: error (at :3): Cannot index string with string “id”
jq: error (at :3): Cannot index string with string “id”
jq: error (at :3): Cannot index string with string “id”
jq: error (at :3): Cannot index string with string “id”
jq: error (at :3): Cannot iterate over null (null)
Any ideas?
Thanks
Clive
Hello Clive,
Might be something to do with your user/pass, also RESTFul API enabled?
Jorge
You were right
It was to do with the password.
On the demo network it was in a Workgroup but in “live” it is on a Domain and needed Domain\Username
Many Thanks for your prompt response
Best Regards
Clive
Glad you have it working! Let me know ideas and feedback, please.
Hello Jorge – nothing to get excited about but the cron job didn’t work due to permissions for /var/log. I have changed directory path and all is well
🙂
Ohh, okay, awesome to hear, thanks so much !
Hi Jorge,
first of all thank you for this big work!
Second, I had to change your script in order to collect correctly jobs info (added uppercase letter on JobSessions at raw 202 , veeamVBOUrl=”$veeamRestServer:$veeamRestPort/v4/Jobs/$idJob/JobSessions”).
Third..is it possible to use the single influxdb data source to create multiple dashboards in a multitenant scenario?
Thanks!
Marco S.
hi,
i need to add some influx tags for this, usally i do this in telegraf.conf. Example
backupenviroment = “VBO”
This is just run with a cronjob not with telegraf. can i put in this kind of tags?
regards
Hello,
This specific dashboard leverages the RESTful API, but I guess you can add that tag somewhere, yes, what is the use case? We can take the Proxy Repo Name from the API, why you want to split per VBO? For your different Tenants?
Thanks for the impresive respons time 🙂
the use case is that we have a influx db centrelized and i have got one DB for backup team. so we have metric for VBR, i have to use same db and want to split the metric depending backupenviroment/platform.
regards
When I run the script I get nothing…
Is there a way to let you debug it?
USER@HOSTNAME:~$ ./veeam*.sh
It just sits there… 🙁
Hello,
Had you enabled the RESTful API service? No output at all? Have you installed jq as well?
Hi Jorge,
I plan to implement this cool setup. Is this meant to be running in DMZ and to be expozed for externa access? If so is there a way to setup MFA?
Hello Tomas,


At the moment there is no simple way to do that, but as you just need HTTPS from the InfluxDB to retrieve all the info from the Swagger, you can protect all very good, you have 2 options:
Either you put WSL on the Veeam Office 365 server, and you let everything local, and the WSL Pushes the info to a DMZ InfluxDB/Grafana:
Or, on the same private network, you put a Linux VM, and again, you keep everything local, and the only thing you send out, to the InfluxDB and Grafana which is on the DMZ, is the metrics, over HTTPS 8086:
Let me know
Hi,
I’m stuck at the following part
How to Enable the RestAPI in Veeam Backup for Microsoft Office 365
what is the access url https://www.office.com ?
because I don’t have “general option”
Thanks
Hello Christophe,
This scripts assumes you are using Veeam Backup for Microsoft Office 365, and you have as well an InfluxDB server to save all the metrics extracted from the VBO API?
Do you have all of that?
Hi,
any ideas on this error?
sh veeam_office365.sh
: not founde365.sh: 15:
: not founde365.sh: 19:
: not founde365.sh: 29:
: not founde365.sh: 36:
: not founde365.sh: 42:
veeam_office365.sh: 43: declare: not found
veeam_office365.sh: 44: Syntax error: word unexpected (expecting “do”)
Hello,
That is strange, maybe you need jq to be installed, I never ran it with sh, but with ./veeam_office365.sh
Let me know
Hi – I realise this is an old post but I’m getting a “401 Unauthorized” error when running ./veeam_office365.sh which seems to be coming from my VBO365 server – is there any configuration changes i need to make on there to allow it to authenticate?
(I’ve double checked the username/password within the script and it all looks ok)
$ ./veeam_office365.sh
HTTP/1.1 401 Unauthorized
Content-Type: application/json; charset=utf-8
X-Platform-Error-Code: unauthorized
Date: Wed, 04 Aug 2021 13:02:05 GMT
Content-Length: 48
{“code”:”unauthorized”,”message”:”Unauthorized”}HTTP/1.1 401 Unauthorized
Content-Type: application/json; charset=utf-8
X-Platform-Error-Code: unauthorized
Date: Wed, 04 Aug 2021 13:02:05 GMT
Content-Length: 48
{“code”:”unauthorized”,”message”:”Unauthorized”}HTTP/1.1 401 Unauthorized
Content-Type: application/json; charset=utf-8
X-Platform-Error-Code: unauthorized
Date: Wed, 04 Aug 2021 13:02:05 GMT
Content-Length: 48
Hello Dan,
Even being a bit old, the scripts and all keep working on VBO v5, and above. So, if you go to https://VBOIP:4443 and try that user and pass under Auth, it gives you a proper Bearer token and all?
Wow – thanks for the quick response!!
I’m just running VBO365 on a test 2016 server i spun up to see if i could get it working before deploying in production.
I’m terrible with Linux so maybe i have misconfigured something on there – I can telnet across on port 4443 so assuming networking is not the issue
If I go to Swagger UI and request a token from Auth/v5/Token with the same username/password i have in the script it gives me a 200 response so assume that is ok?
Response Body
{
“access_token”: “AQAAANCMnd8BFdERjHoAwE_Cl-********
“token_type”: “bearer”,
“expires_in”: 3600,
“.issued”: “Wed, 04 Aug 2021 13:47:31 GMT”,
“.expires”: “Wed, 04 Aug 2021 14:47:31 GMT”
}
Response Code
200
I see, is it your user like administrator, or domain\administrator, or [email protected], what format you using on the script?
Best regards
So far I’ve tried:
MACHINE-NAME\administrator
IP-ADDRESS\administrator
administrator
The machine i’m using is just in a workgroup so I haven’t tried the UPN format
It should work with any of them really, does the password has a ” by any chance that is making the code exit, not sure really, code is working just fine.
No it doesn’t have a quote mark in the password – it must be something to do with authentication on my test VBO 365 server.
Thanks for the responses though, i’ll try and figure out what the problem is!
On the linux box, try the command like this:
curl -X POST --header "Content-Type: application/x-www-form-urlencoded" --header "Accept: application/json" -d "grant_type=password&username=PUTHEREYOURUSERNAME&password=PUTHEREYOURPASSWORD&refresh_token=%27%27" "https://PUTHEREYOURVBOIP:4443/v5/token" -k --silentTell me if that works or not
Best regards
That command seems to work fine as it issues me a token OK. I’m starting to wonder if the problem may be around licensing as I’m using an NFR license on the test VBO365 server i’m running?!
Just to make sure, you are using this latest script, right?
https://raw.githubusercontent.com/VeeamHub/grafana/master/veeam-backup-for-office365-grafana/veeam_office365.sh
All working nice on my side, what happens if you paste this on the shell directly, with your user/pass:
veeamUsername="YOURVBOUSER"veeamPassword="YOURVBOPASSWORD"
veeamRestServer="https://YOURVBOSERVERIP"
veeamRestPort="4443" #Default Port
veeamBearer=$(curl -X POST --header "Content-Type: application/x-www-form-urlencoded" --header "Accept: application/json" -d "grant_type=password&username=$veeamUsername&password=$veeamPassword&refresh_token=%27%27" "$veeamRestServer:$veeamRestPort/v5/token" -k --silent | jq -r '.access_token')
then you do a simple:
echo $veeamBearerWhat does it tell you?
It’s so strange – it works fine when i run it manually from the shell – it outputs the access token when running “echo $veeamBearer”:
$ echo $veeamBearer
AQAAANCMnd8BFdERjHoAwE_Cl-sBAAAAw190xRmoIEOZYoIHwVsMQAAAAAACAAAAAAAQZgAAAAEAACAAAAC67ceEbkb159gpWOropsCratBZtvsDr-Qlfii9Zd-digAAAAAOgAAAAAIAACAAAACiqgyqhPrNn1sRBjfaNmbwki3CQjPj-8j_q7T3JIfVDrAAAAAOnXKf4I_U9TzlmyMXM1D5Q4TjfliWdgiTSHiw2mBqZsYx0boUtsvhaaDcUKfWRCcZ2cL_ear6HFN5XIWLjHSwvJtxObWWz1nblibEfqadV0WMwTNzpQXvQ8rHu6Pkoyb9c7cAySiQq93XA0UJH6amZBojDoFVYPmlcrYC04-tulnaOsS11x0PHDgQSwk5X0LgEmVFmxnyE6ZBzY7pxLnbcxT84Ae9tLnadWsi332-7EAAAACTw4i2hFkWmQHnhBEMuvPmiPyjW7Do1JzuES3z6zb0L8LpPS08qjggKvgTiycSC6QxlfaEF4IH1FzYRz5WTgdW
It also allows me to run commands from the script manually once i have the access token – e.g. getting the organizations:
veeamVBOUrl=”$veeamRestServer:$veeamRestPort/v5/Organizations”
veeamOrgUrl=$(curl -X GET –header “Accept:application/json” –header “Authorization:Bearer $veeamBearer ” “$veeamVBOUrl” 2>&1 -k –silent)
$ echo $veeamOrgUrl
]_actions”: {}://192.168.1.26:4443/v5/organizations/e5e1859b-7f2d-4b1a-aefc-422cd36adc5b/usedRepositories”
However, when i run ./veeam_office365.sh using the exact same credentials I just get the 401 unauthorized errors?!
Hello,
Really strange, try to remove some of the secions, as you can see try first with the organizations only, etc. Maybe something is wrong.
I’ve run all of the commands manually and it seems it’s actually failing writing the data to the InfluxDB rather than requesting it from the VBO API!
I’ve installed v2.0 of Influx – does the script only work for v1.8?
Yes, it is meant for v1.8
Hi Jorge,
We get an 400 error’
veeam_office365_version,veeamVersion=,veeamServer=https://172.17.12.56 v=1
HTTP/1.1 400 Bad Request
Content-Type: application/json; charset=utf-8
X-Influxdb-Build: OSS
X-Influxdb-Version: v2.5.1
X-Platform-Error-Code: invalid
Date: Mon, 12 Dec 2022 11:11:20 GMT
Content-Length: 142
{“code”:”invalid”,”message”:”unable to parse ‘veeam_office365_version,veeamVersion=,veeamServer=https://172.17.12.56 v=1’: missing tag value”}HTTP/1.1 400 Bad Request
Content-Type: application/json; charset=utf-8
X-Influxdb-Build: OSS
X-Influxdb-Version: v2.5.1
X-Platform-Error-Code: invalid
Date: Mon, 12 Dec 2022 11:11:20 GMT
Content-Length: 153
{“code”:”invalid”,”message”:”unable to parse ‘veeam_office365_restoreportal,organization=,restorePortalAppId= restorePortalEnabled=’: missing tag value”}
Could you please advice?
We are using InfluxDB2 as target ; is this what’s going wrong?
Thanks in advance!
Sebastian
p.s. keep up the amazing work!
Hi, thanks for the script and tutorial! I’m using containers for Grafana and InfluxDB (in Portainer). Here is what is returned after finishing. There’s some errors and some successful messages. Is this normal?
https://github.com/bdpasp123/errors/blob/main/Veeam%20Backup%20-%20Grafana
Not sure if I pasted the link to the return message
Hello, what VB365 version are you using? I think you have something below 6, and this script, latest release at least, is aimed to work with VB365 v6, for other versions, on GitHub you will find the version for your environment, with the Grafana dashboard as well 🙂
Let me know!
Hello,
Are you using the latest version of the script? I have removed the veeam_office365_restoresession from there 🙂
Let me know
Hi! I am using versions:
Microsoft Office 365 v5.0 – Using RestAPI to InfluxDB Script
Veeam Backup: 6.0.0.385
Hello,
That is the issue; you would need to go to GitHub and grab the correct version:
https://github.com/jorgedlcruz/veeam-backup-for-microsoft365-grafana/tree/master/v5.0
Both files should work just fine.
Hi, I am already using version 5:
## .Notes
## NAME: veeam_office365.sh
## ORIGINAL NAME: veeam_office365.sh
## LASTEDIT: 08/03/2022
## VERSION: 5.0
## KEYWORDS: Veeam, InfluxDB, Grafana
HI jorgeuk,
awesome work, but unfortunately I have some issues with the script and the Veeam REST API:
Do you have any idea where these errors are:
veeam_microsoft365.sh ( Version V7)
Writing veeam_office365_version to InfluxDB
Error: failed to write data: 400 Bad Request: unable to parse ‘veeam_office365_version,veeamVersion=,veeamServer=https://SYSTEMIP v=1’: missing tag value
Writing veeam_office365_restoreportal to InfluxDB
Error: failed to write data: 400 Bad Request: unable to parse ‘veeam_office365_restoreportal,veeamServer=https://SYSTEMIP ,restorePortalAppId= restorePortalEnabled=’: missing tag value
Hello, it is working on my lab, what version of the script are you using? Do you mind adding the first part of the comments? Also, do you have RESTAPI Enabled? can you access the swagger?
Cheers
HI jorgeuk,
yes the RESTAPI is Enabled and i can access the swagger.
The Script is the latest from your GIT
## NAME: veeam_microsoft365.sh
## ORIGINAL veeam_microsoft365.sh
## LASTEDIT: 02/03/2023
## VERSION: 7.0
## KEYWORDS: Veeam, InfluxDB, Grafana
The Veeam Backup for MS365 is the version 7.0.0.3604
in the meantime i have testet some issues and i can say that the restapi dosn’t reply properly
i don’t get an Bearer Token, if i explore the data through the swagger everythin works and i get the data but with the script it dosn’t work.
Thanks for your help
Hello,
Probably needs to do with the auth:
# Endpoint URL for login action
veeamUsername=”YOURVBOUSER”
veeamPassword=”YOURVBOPASSWORD”
Are you using user\domain ? or [email protected]
HI jorgeuk,
i use domain\user but also only user because its an standalone server without domain.
But now i have further information it seems that the SSL is not working properly.
curl: (35) OpenSSL SSL_connect: Connection reset by peer in connection to veeamRestServer:4443
So now i have to look first why the SSL is not working and then i can look further for the script.
Oh, that is bizarre, as all my scripts are built to omit the SSL check of course. how does it look the veeamRestServer? This is my script:
veeamUsername="administrator"veeamPassword="MYPASS"
veeamRestServer="https://192.168.1.32"
veeamRestPort="4443" #Default Port
Maybe you need to add the https://
HI jorgeuk,
sorry for the late feedback, I haven’t had much time to deal with the problem lately,
here are my settings in the script
veeamUsername=”Administrator”
veeamPassword=”MYPASS”
veeamRestServer=”https://SYSTEMIP”
veeamRestPort=”4443″ #Default Port
according to the settings in the script everything should be set correctly