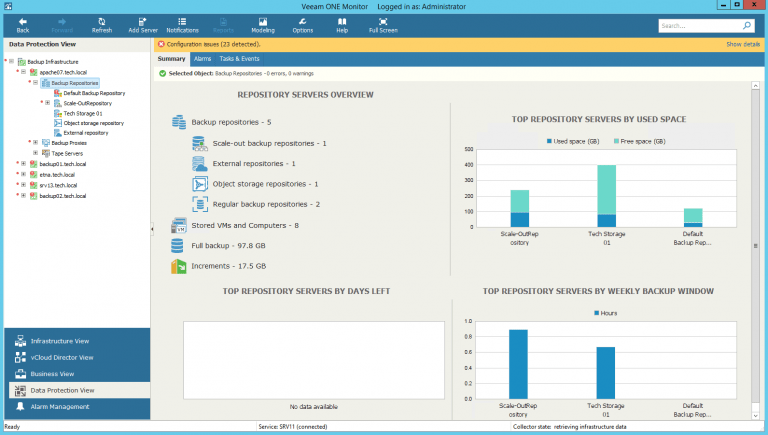
Greetings friends, today we start another series on monitoring vSphere and Veeam environments, in this case, we will use a corporate tool such as Veeam ONE. In this series, we are going to see from less to more, covering from the basics, to the most advanced, with scenarios that we can find day by day. I hope you like the series, you have the
Archives for January 2020
VMware: How to achieve a perfect metric collection interval with Telegraf, InfluxDB and Grafana
Greetings friends, I have told you in the past how to monitor your VMware environment using InfluxDB, Telegraf, and Grafana, and according to Grafana's dashboard, you are using it with about 4300 people in your Datacenters. All this is great, and I thank you very much for all the support and that so many people have the solution deployed. Now, I
Veeam: Whiteboard Veeam Live Recording Backup strategies: Pros and cons
Greetings friends, a few weeks back I had the pleasure to co-present another Whiteboarding live-session with Alex Fraser (Senior Systems Engineer UKI). The session which you can watch for free, and without any registration, if you do a little scrolling, covers how having a data backup and recovery plan is important to the overall success of your
Looking for the Perfect Dashboard: InfluxDB, Telegraf and Grafana – Part XIX (Monitoring Veeam with Enterprise Manager) Shell Script
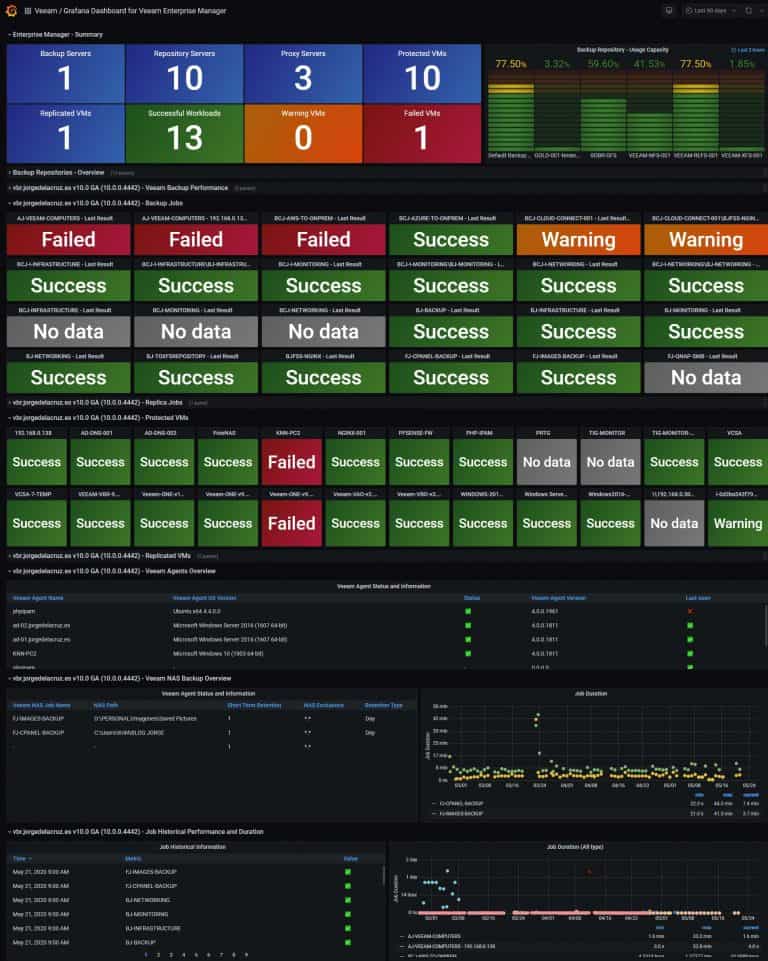
Greetings friends, I bring you a new entry about Grafana and Veeam, which I'm sure you'll like and put in your labs. Back in 2017 I told you how they monitor Veeam using the PowerShell CMDlets and also how to do it using PowerShell and Enterprise Manager RESTful API. These entries have had tens of thousands of hits, but they were more of a proof of


