
 Greetings friends, I have told you in the past how to monitor your VMware environment using InfluxDB, Telegraf, and Grafana, and according to Grafana’s dashboard, you are using it with about 4300 people in your Datacenters. All this is great, and I thank you very much for all the support and that so many people have the solution deployed.
Now, I have read for a long time that in some cases you were having incidents when monitoring the datastores in a correct way, which generated that the Dashboard will not display correctly, creating a lot of frustration, but this entry will ensure you have everything configured correctly.
vSphere vCenter – real-time metrics
VMware collects information every 20 seconds from the ESXi and stores this information in vCenter RAM. This makes it really easy and fast to access this information by telegraph or any other information collector. All this information is stored only for one hour in the vCenter, in the diagram we would be number 3, accessing directly to the Performance Manager: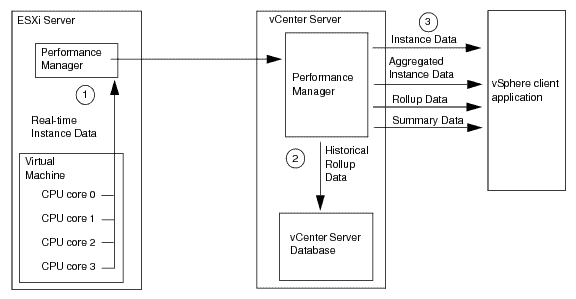
This information is limited however to the resources we can obtain from the ESXi hosts and the VMs, which are the following:
## Hosts
  host_metric_include = [
    "cpu.coreUtilization.average",
    "cpu.costop.summation",
    "cpu.demand.average",
    "cpu.idle.summation",
    "cpu.latency.average",
    "cpu.readiness.average",
    "cpu.ready.summation",
    "cpu.swapwait.summation",
    "cpu.usage.average",
    "cpu.usagemhz.average",
    "cpu.used.summation",
    "cpu.utilization.average",
    "cpu.wait.summation",
    "disk.deviceReadLatency.average",
    "disk.deviceWriteLatency.average",
    "disk.kernelReadLatency.average",
    "disk.kernelWriteLatency.average",
    "disk.numberReadAveraged.average",
    "disk.numberWriteAveraged.average",
    "disk.read.average",
    "disk.totalReadLatency.average",
    "disk.totalWriteLatency.average",
    "disk.write.average",
    "mem.active.average",
    "mem.latency.average",
    "mem.state.latest",
    "mem.swapin.average",
    "mem.swapinRate.average",
    "mem.swapout.average",
    "mem.swapoutRate.average",
    "mem.totalCapacity.average",
    "mem.usage.average",
    "mem.vmmemctl.average",
    "net.bytesRx.average",
    "net.bytesTx.average",
    "net.droppedRx.summation",
    "net.droppedTx.summation",
    "net.errorsRx.summation",
    "net.errorsTx.summation",
    "net.usage.average",
    "power.power.average",
    "storageAdapter.numberReadAveraged.average",
    "storageAdapter.numberWriteAveraged.average",
    "storageAdapter.read.average",
    "storageAdapter.write.average",
    "sys.uptime.latest",
  ]
## VMs
  ## Typical VM metrics (if omitted or empty, all metrics are collected)
  # vm_include = [ "/*/vm/**"] # Inventory path to VMs to collect (by default all are collected)
  vm_metric_include = [
    "cpu.demand.average",
    "cpu.idle.summation",
    "cpu.latency.average",
    "cpu.readiness.average",
    "cpu.ready.summation",
    "cpu.run.summation",
    "cpu.usagemhz.average",
    "cpu.used.summation",
    "cpu.wait.summation",
    "mem.active.average",
    "mem.granted.average",
    "mem.latency.average",
    "mem.swapin.average",
    "mem.swapinRate.average",
    "mem.swapout.average",
    "mem.swapoutRate.average",
    "mem.usage.average",
    "mem.vmmemctl.average",
    "net.bytesRx.average",
    "net.bytesTx.average",
    "net.droppedRx.summation",
    "net.droppedTx.summation",
    "net.usage.average",
    "power.power.average",
    "virtualDisk.numberReadAveraged.average",
    "virtualDisk.numberWriteAveraged.average",
    "virtualDisk.read.average",
    "virtualDisk.readOIO.latest",
    "virtualDisk.throughput.usage.average",
    "virtualDisk.totalReadLatency.average",
    "virtualDisk.totalWriteLatency.average",
    "virtualDisk.write.average",
    "virtualDisk.writeOIO.latest",
    "sys.uptime.latest",
  ]
  # vm_metric_exclude = [] ## Nothing is excluded by default
  # vm_instances = true ## true by default
Knowing this information now, InfluxDB Engineers have managed to achieve metrics of up to 7000VMs in about 20 seconds, so I am sure you will be able to deploy this solution in your environments without any problems.
vSphere vCenter – historical metrics
These metrics are stored in the VMware vCenter Database and are much heavier and more expensive to perform, as well as taking longer to return the response, etc. These metrics are stored in 5 minutes, 30 minutes, 2 hours, and 24-hour intervals. But we will use the range of every 5 minutes to have updated information. In the diagram, what we want here is to access the information in number 2:
This information is limited to the metrics we can get from the Clusters, Datacenter and Datastores. As we can see, if we don’t modify the telegraph configuration, we won’t be able to monitor as we should these two intervals that are different and limited to different resources.
Recommended telegraph configuration for your VMware vSphere environments
Having seen the theory, and knowing how the different elements to monitor, I recommend as always not to touch the telegraf.conf, better to create a file in the telegraf path, something like this – /etc/telegraf/telegraf.d/vsphere-monitor.conf and inside the following:
## Monitorizacion en tiempo real, ESXi y VMs
[[inputs.vsphere]]
## List of vCenter URLs to be monitored. These three lines must be uncommented
## and edited for the plugin to work.
  interval = "20s"
  vcenters = [ "https://someaddress/sdk" ]
  username = "[email protected]"
  password = "secret"

  vm_metric_include = []
  host_metric_include = []
  datastore_metric_exclude = ["*"]

  max_query_metrics = 256
  timeout = "60s"
  insecure_skip_verify = true

## Monitorizacion historica, Datacenter, Cluster y Datastore
[[inputs.vsphere]]
interval = "300s"
  vcenters = [ "https://someaddress/sdk" ]
  username = "[email protected]"
  password = "secret"

  datastore_metric_include = [ "disk.capacity.latest", "disk.used.latest", "disk.provisioned.latest" ]
  cluster_metric_include = []
  datacenter_metric_include = []
  insecure_skip_verify = true
  force_discover_on_init = true
  host_metric_exclude = ["*"] # Exclude realtime metrics
  vm_metric_exclude = ["*"] # Exclude realtime metrics

  max_query_metrics = 256
  collect_concurrency = 3
If we look at the configuration, of the first interval, shorter, we will have information in groups of 20 seconds about VMs and Hosts, and we exclude everything else like Datacenters, Datastores, and Cluster.
In the second part, what we do is to exclude elements such as VMs and Hosts, and monitor the elements with the statistics in the database, as well as upload the collection tasks to three to speed up the process.
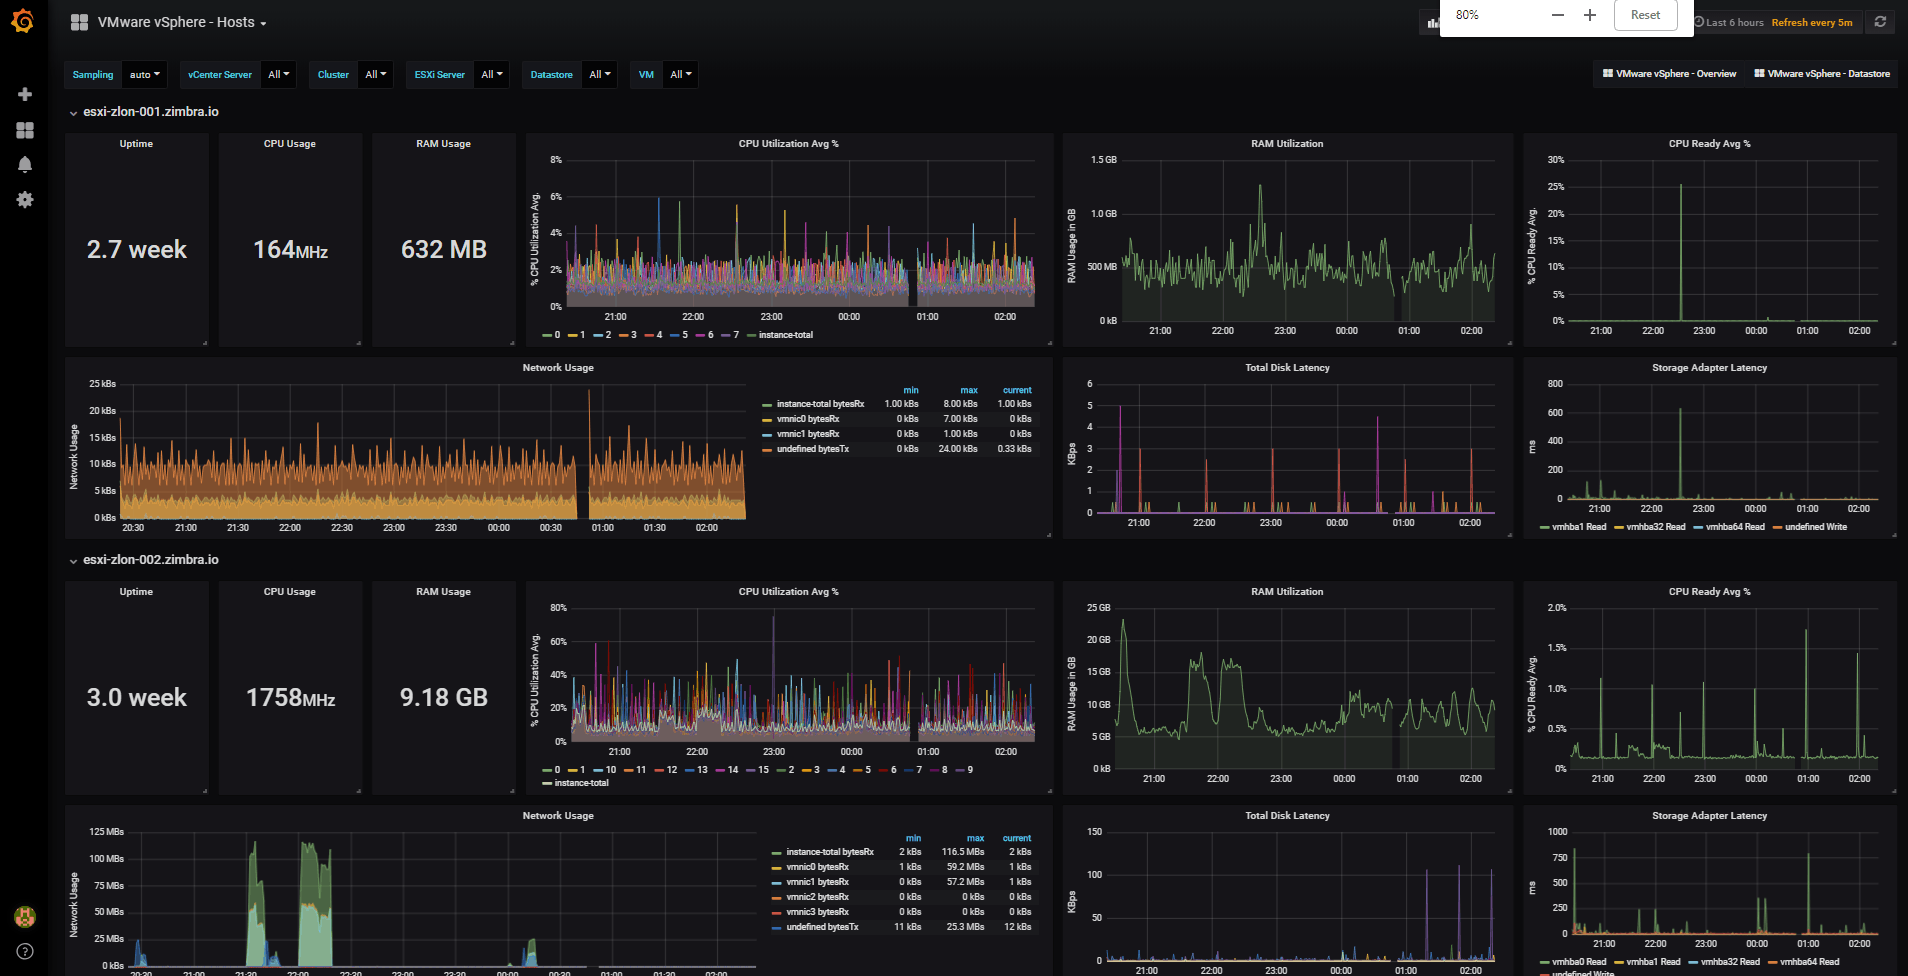
Final result
The final result since a few weeks is that I do not stop receiving information about the Datastores, or other elements of my VMware when I monitor them with Telegraf, and the result can be seen here:
vSphere Overview Dashboard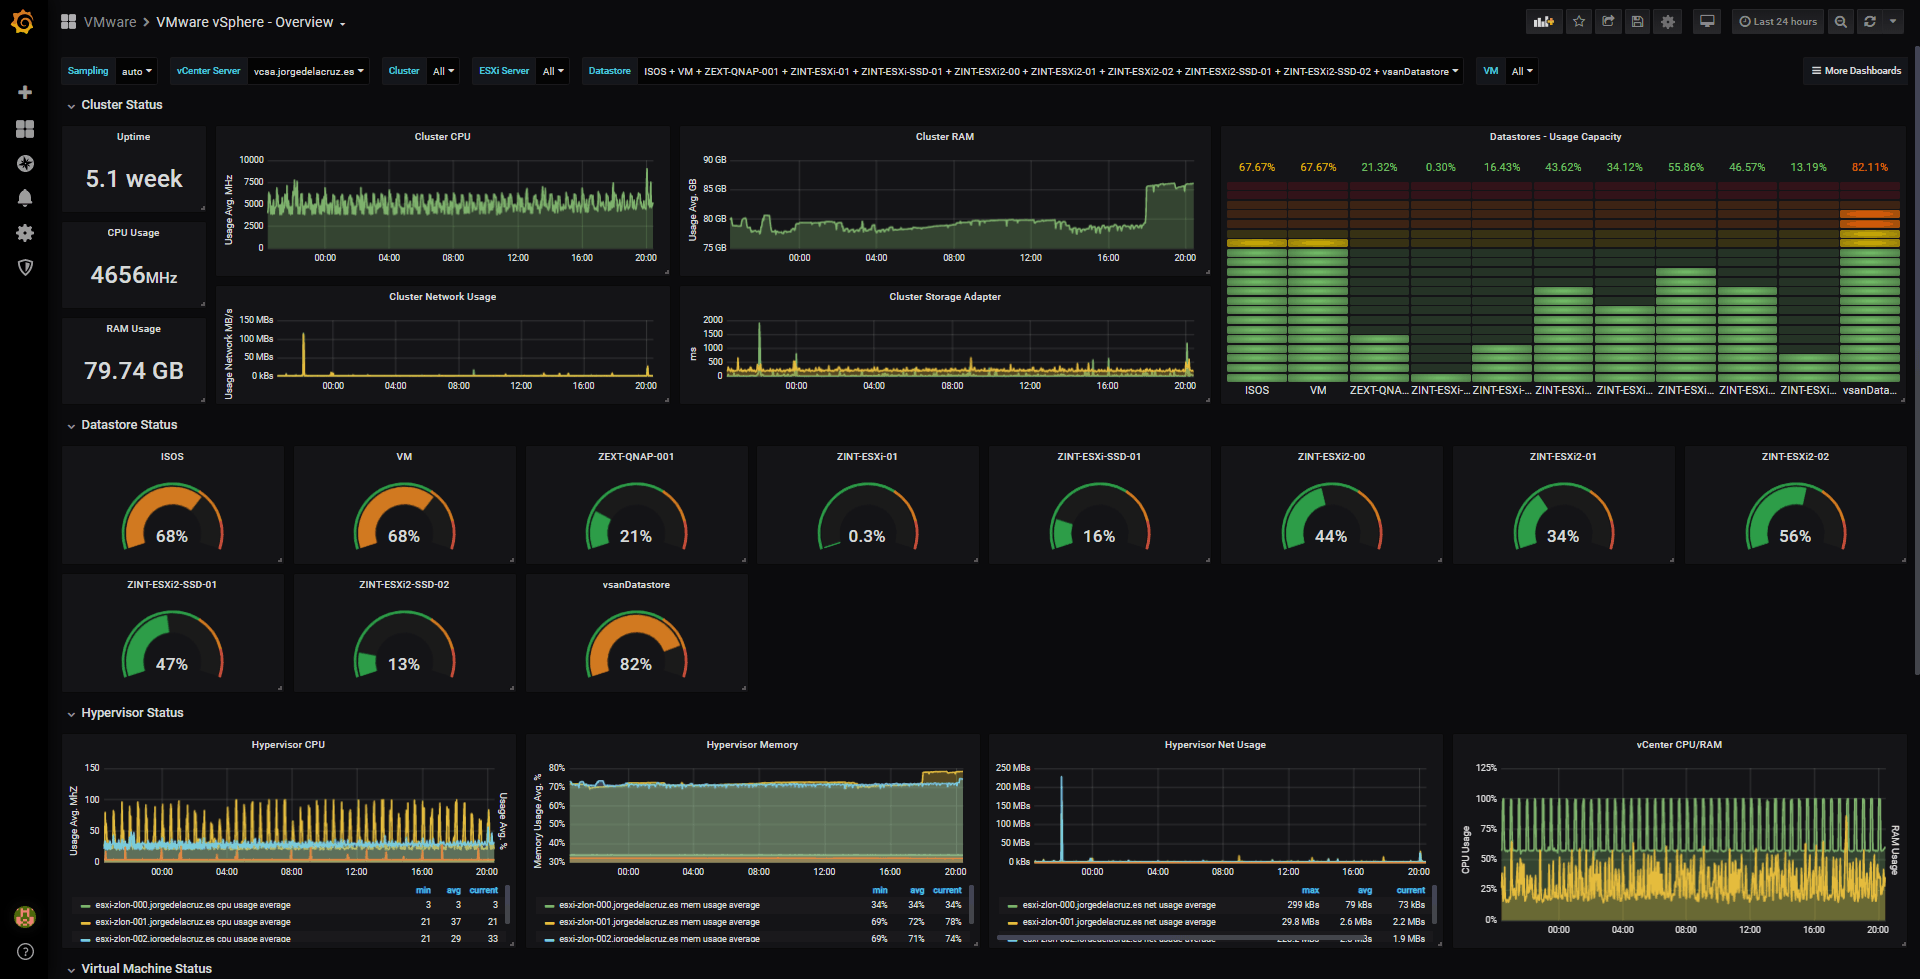
vSphere Hosts Overview Dashboard
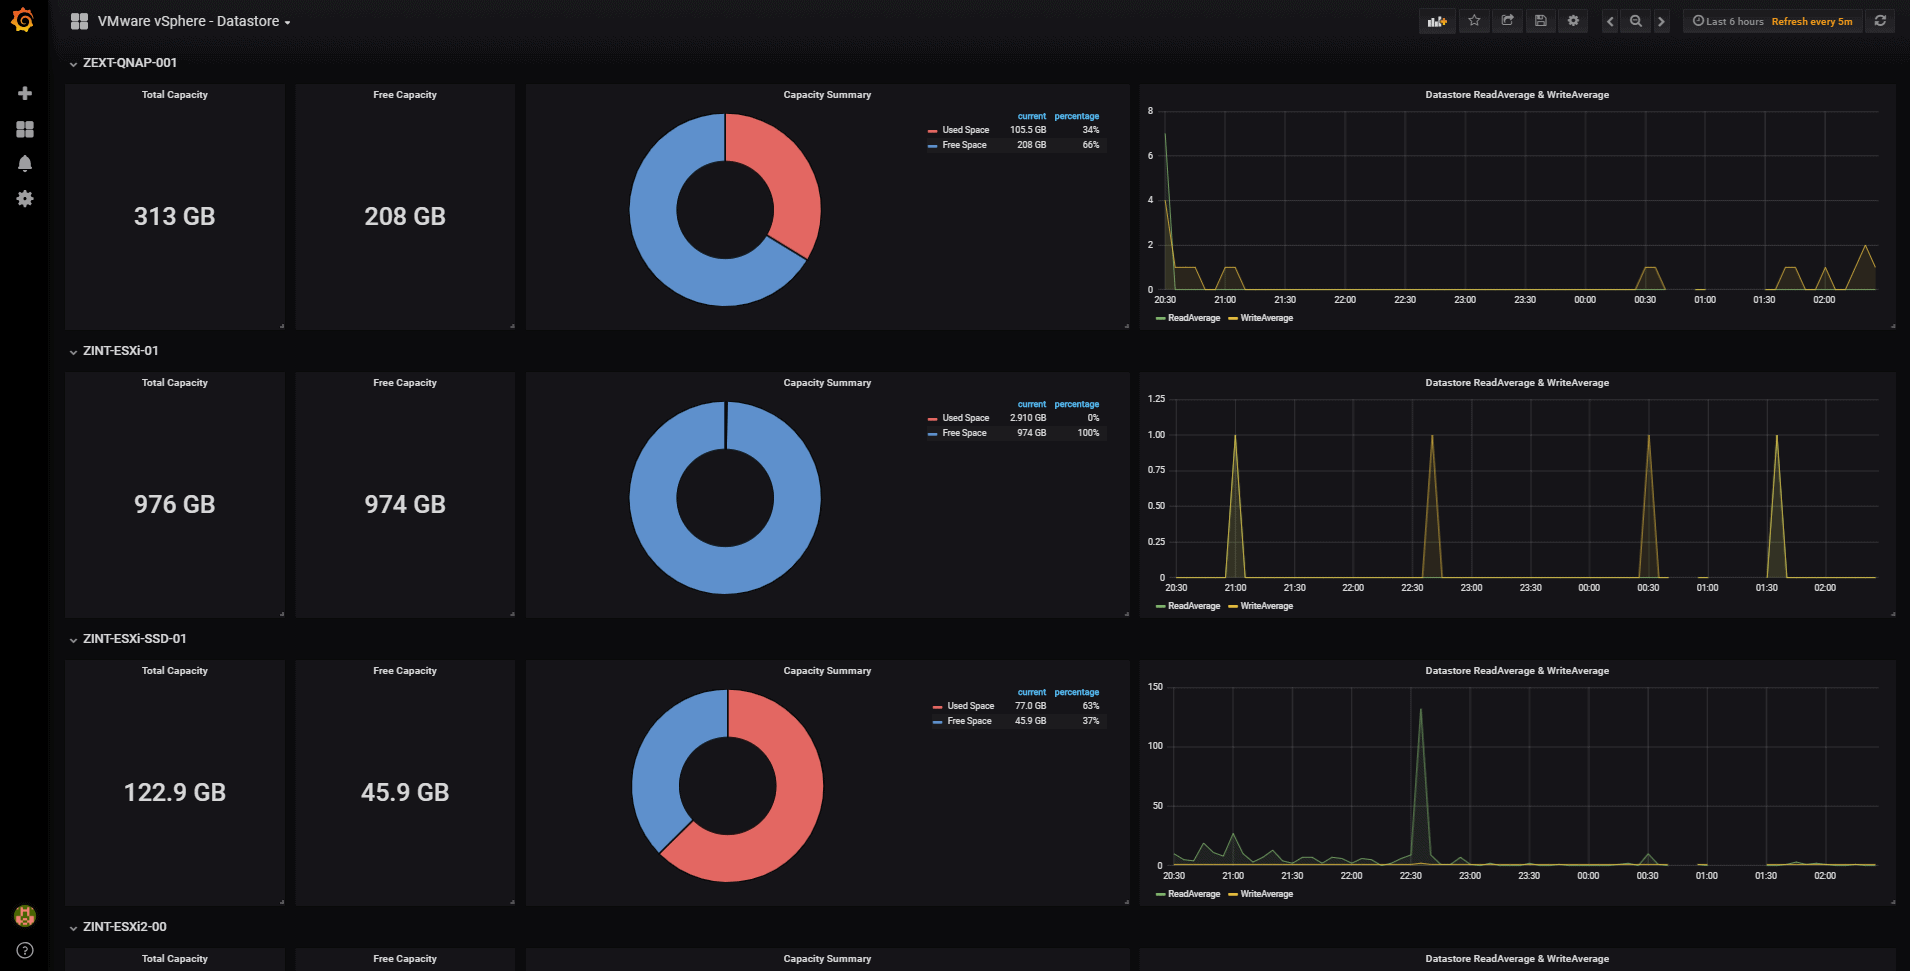
vSphere Datastore Overview
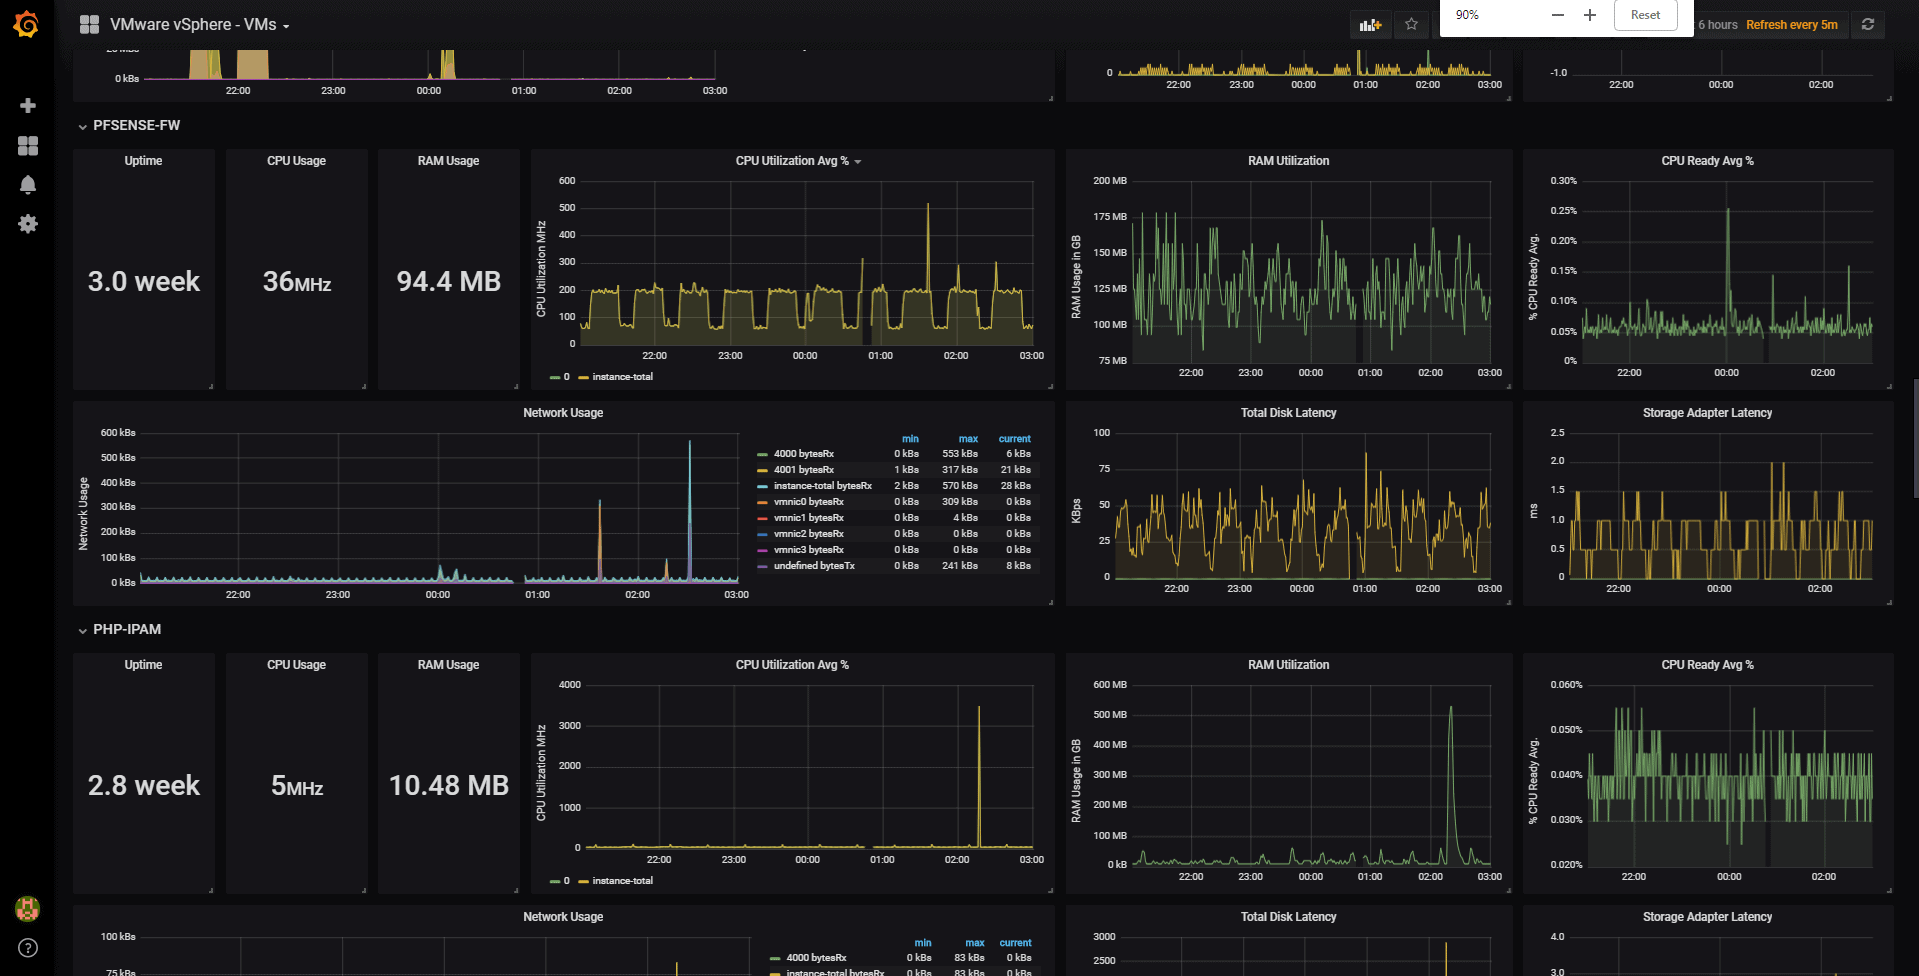
vSphere VM Overview
That’s all folks, if you want to follow the full Blog series about Grafana, InfluxDB, Telegraf, please click on the next links:
- En busca del Dashboard perfecto: InfluxDB, Telegraf y Grafana – Parte I (Instalando InfluxDB, Telegraf y Grafana)
- En busca del Dashboard perfecto: InfluxDB, Telegraf y Grafana – Parte II (Instalar agente Telegraf en Nodos remotos Linux)
- En busca del Dashboard perfecto: InfluxDB, Telegraf y Grafana – Parte III Integración con PRTG
- En busca del Dashboard perfecto: InfluxDB, Telegraf y Grafana – Parte IV (Instalar agente Telegraf en Nodos remotos Windows)
- En busca del Dashboard perfecto: InfluxDB, Telegraf y Grafana – Parte V (Activar inputs específicos, Red, MySQL/MariaDB, Nginx)
- En busca del Dashboard perfecto: InfluxDB, Telegraf y Grafana – Parte VI (Monitorizando Veeam)
- En busca del Dashboard perfecto: InfluxDB, Telegraf y Grafana – Parte VII (Monitorizar vSphere)
- En busca del Dashboard perfecto: InfluxDB, Telegraf y Grafana – Parte VIII (Monitorizando Veeam con Enterprise Manager)
- En busca del Dashboard perfecto: InfluxDB, Telegraf y Grafana – Parte IX (Monitorizando Zimbra Collaboration)
- En busca del Dashboard perfecto: InfluxDB, Telegraf y Grafana – Parte X (Grafana Plugins)
- En busca del Dashboard perfecto: InfluxDB, Telegraf y Grafana – Parte XI
- Looking for the Perfect Dashboard: InfluxDB, Telegraf and Grafana – Part XII (Native Telegraf Plugin for vSphere)
- Looking for the Perfect Dashboard: InfluxDB, Telegraf and Grafana – Part XIII (Veeam Backup for Microsoft Office 365 v4)
- Looking for the Perfect Dashboard: InfluxDB, Telegraf and Grafana – Part XIV – Veeam Availability Console
- Looking for the Perfect Dashboard: InfluxDB, Telegraf and Grafana – Part XV (IPMI Monitoring of our ESXi Hosts)
- Looking for Perfect Dashboard: InfluxDB, Telegraf and Grafana – Part XVI (Performance and Advanced Security of Veeam Backup for Microsoft Office 365)
- Looking for the Perfect Dashboard: InfluxDB, Telegraf and Grafana – Part XVII (Showing Dashboards on Two Monitors Using Raspberry Pi 4)
- En busca del Dashboard perfecto: InfluxDB, Telegraf y Grafana – Parte XVIII – Monitorizar temperatura y estado de Raspberry Pi 4
- Looking for the Perfect Dashboard: InfluxDB, Telegraf and Grafana – Part XIX (Monitoring Veeam with Enterprise Manager) Shell Script
Note: If facing the error “Task Name: Remote View Manager, Status: The request refers to an unexpected or unknown type” please read the next Blog entry.
Any way to get stats on to MySQL instead of InfluxDB?
None really, MySQL will not be able to handle the billion of metrics you pull and save from vCenter, for that reason VMware just saves a short period of them before flush them.
Very nice post, thanks. Can you be more specific about the vCenter statistics config level for the 5 min interval duration please (staying at level 1 or level 2) ?
It collects only only the local esx datastore. Shared like 3par datastores are reflected any idea on that?
Hello,
This specific article is for VMware Datastores, yes, whatever it is behind, like 3par, Netapp, etc, that does not matter, as VMware sees it.
🙂
Hi, we implemented the dashboard. But the values on cluster level are different than in Vsphere. It shows 100% CPU in the dashboard, but in VMware the value is below 100%