
 Greetings friends, during these last years we have seen how to monitor all kinds of services with Grafana, InfluxDB, and Telegraf, such as VMware vSphere, Linux, Windows, Veeam and more. Today I bring you one of these entries that are extremely useful and simple at the same time.
I’m talking about how to monitor your SSL certificates, yours or any manufacturer’s, URLs, etc. So that we can avoid failure like the one Microsoft had just a few days ago when an SSL certificate expired due to being a leap year.
Telegraf, InfluxDB and Grafana topology monitoring SSL
Although I have already shown you some times the diagram of how would be the monitoring using Telegraf, Grafana, and InfluxDB, I leave you again the diagram, this time monitoring SSL: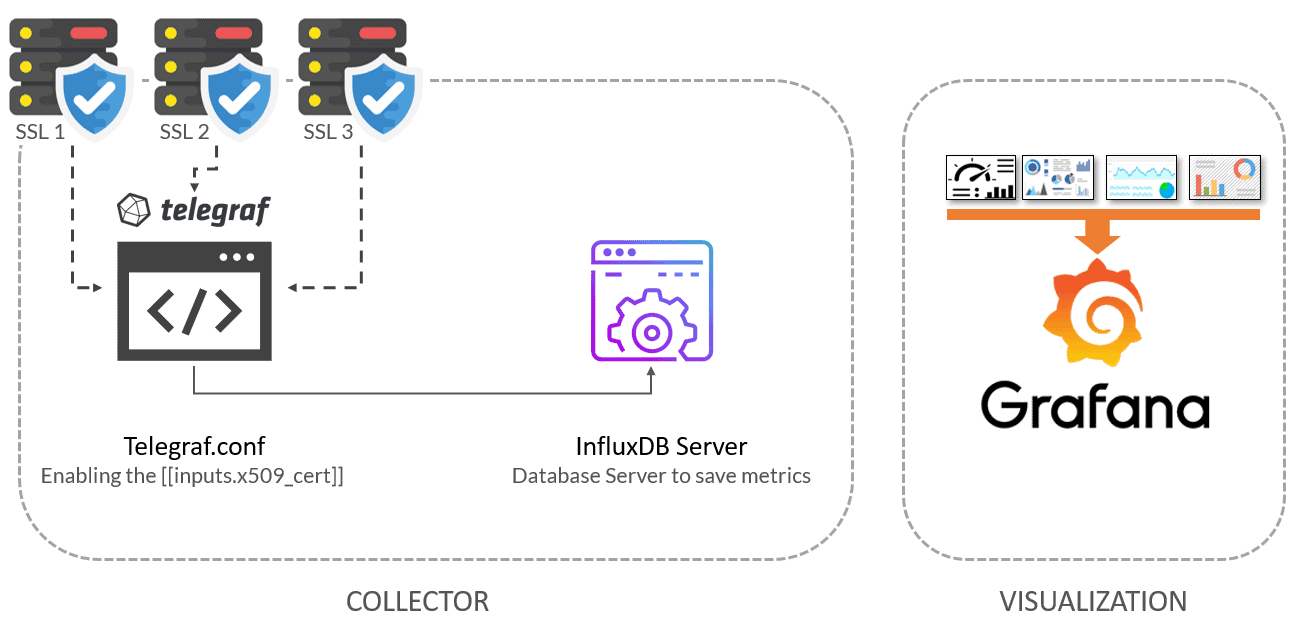
How to activate Telegraf’s native input to monitor SSL Certificates x.509
Luckily for us, Telegraf already brings natively an input (plugin) to monitor the status of SSL x.509 certificates, we will be able to monitor the following, which is certainly more than complete for our purpose:
x509_cert
- tags:
- source – source of the certificate
- organization
- organizational_unit
- country
- province
- locality
- verification
- serial_number
- signature_algorithm
- public_key_algorithm
- issuer_common_name
- issuer_serial_number
- san
- fields:
- verification_code (int)
- verification_error (string)
- expiry (int, seconds)
- age (int, seconds)
- startdate (int, seconds)
- enddate (int, seconds)
To activate it, it will be as simple as editing the telegraf.conf, or better, creating a new file in /etc/telegraf/telegraf.d/ssl.conf, and inside we will introduce the following:
[[inputs.x509_cert]]
sources = ["https://TUURL1:443/", "https://TUURL2:443/", "TUURL3:8443/", "tcp://TUAPPQUEESCUCHAPORTCP:8086/"]
insecure_skip_verify = true
Once we have all the URLs added, we will restart the telegraph service:
telegraf service restart
Checking that we are ingesting information with Chronograf
The normal thing at this point, if we have done all the steps well, is that we are already sending information collected by the script to InfluxDB, if we perform a search using the wonderful Chronograf, we can check that we have information: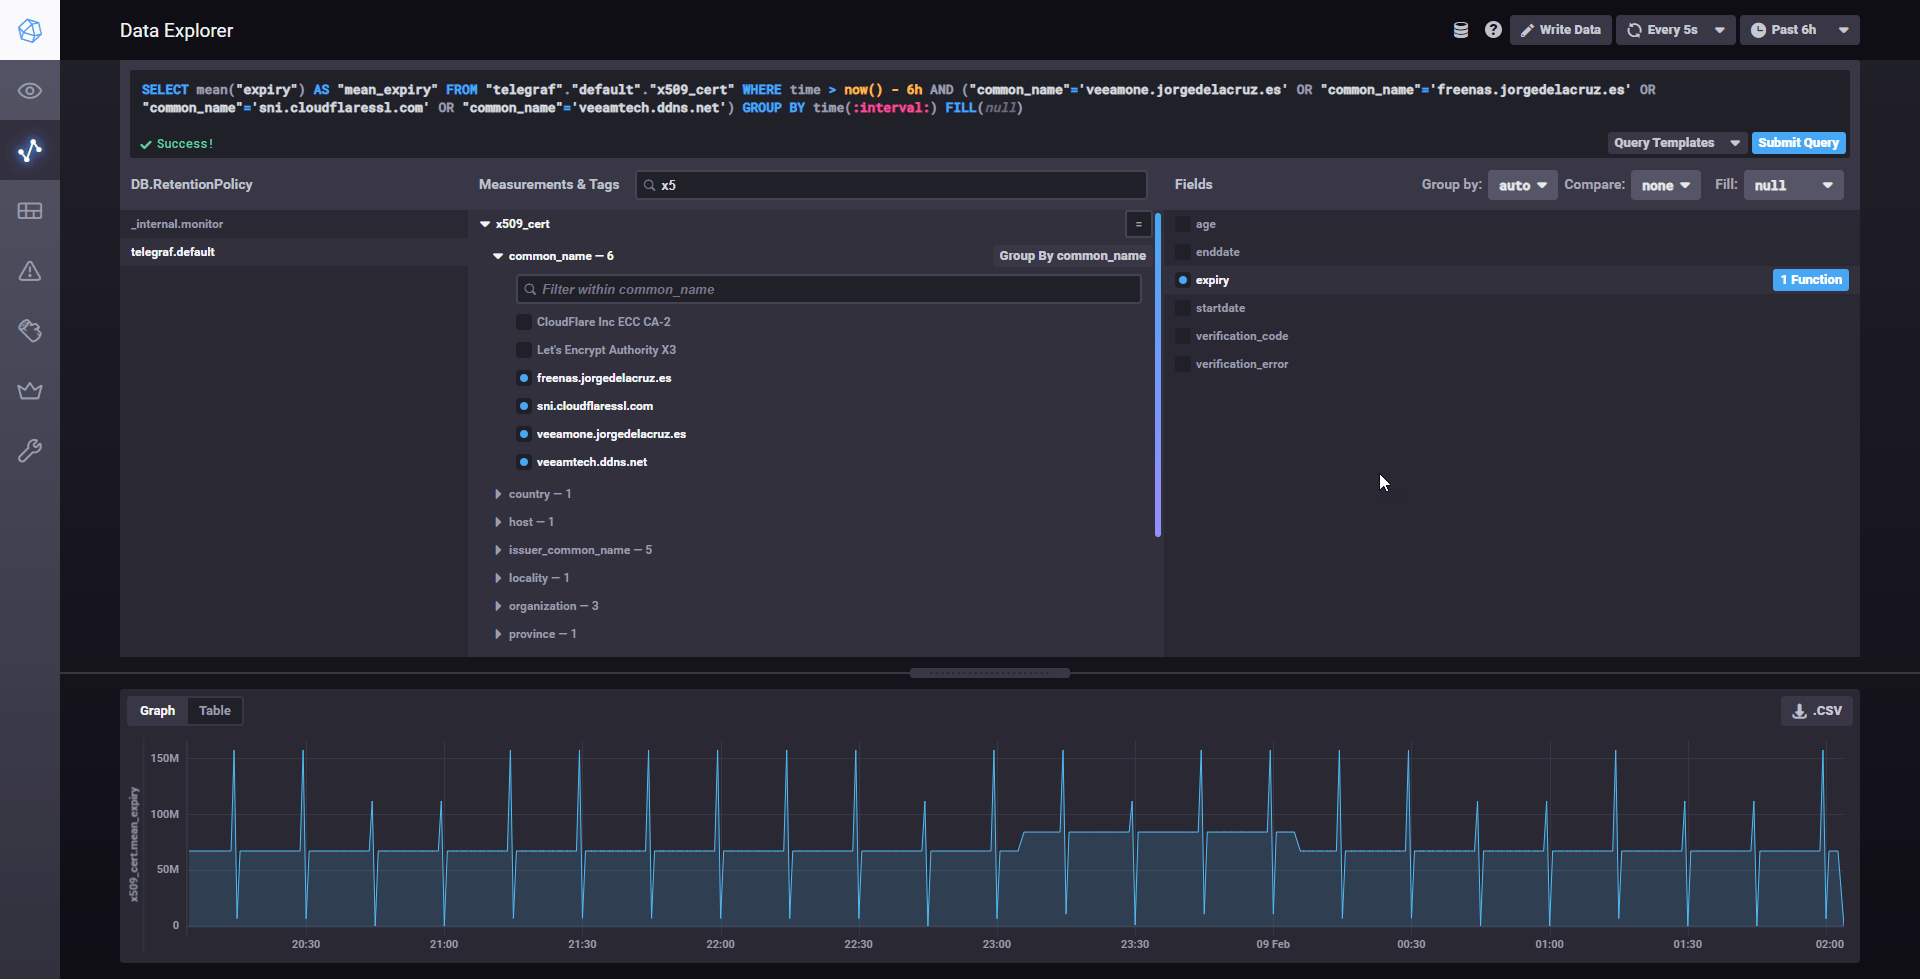
All the variables of this input to monitor SSL are stored in x509_* so it is really easy to find them.
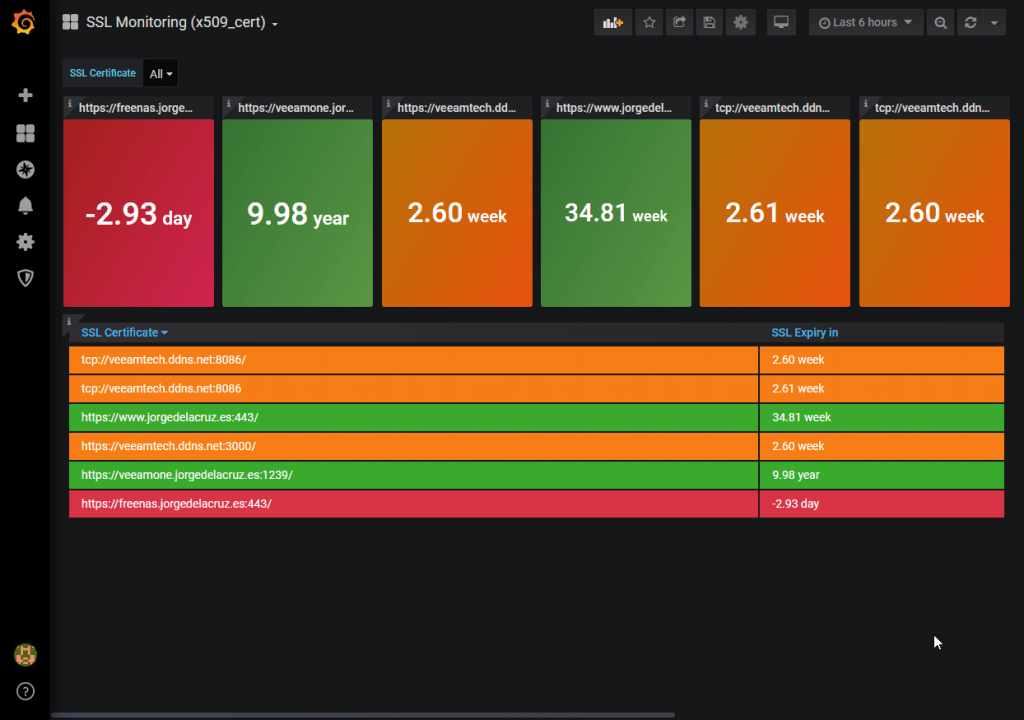
Grafana Dashboard
I created a Dashboard from scratch by selecting the best requests to the database, finishing off colors, thinking about graphics and how to display them, and everything is automated so that it fits our environment without any problem and without having to edit anything manually. The Dashboard can be found here, once imported, you can use the top drop-down menus to select between SSL:
Import Grafana Dashboards easily
So that you don’t have to waste hours configuring a new dashboard, and ingesting and debugging you want, I’ve already created four wonderful dashboards with everything you need to monitor our environment in a very simple way, it will look like the image I showed you above.
From our Graph, we will make Create – Import
Select the name you want and enter the ID: 11707, which is the unique ID of the Dashboard, or the URL:
Please leave your feedback in the comments.
If you want to see them working without installing anything, here is the link to my environment.
Just friends, I hope you like it, and I’d like to leave the whole series here:
That’s all folks, if you want to follow the full Blog series about Grafana, InfluxDB, Telegraf, please click on the next links:
- En busca del Dashboard perfecto: InfluxDB, Telegraf y Grafana – Parte I (Instalando InfluxDB, Telegraf y Grafana)
- En busca del Dashboard perfecto: InfluxDB, Telegraf y Grafana – Parte II (Instalar agente Telegraf en Nodos remotos Linux)
- En busca del Dashboard perfecto: InfluxDB, Telegraf y Grafana – Parte III Integración con PRTG
- En busca del Dashboard perfecto: InfluxDB, Telegraf y Grafana – Parte IV (Instalar agente Telegraf en Nodos remotos Windows)
- En busca del Dashboard perfecto: InfluxDB, Telegraf y Grafana – Parte V (Activar inputs específicos, Red, MySQL/MariaDB, Nginx)
- En busca del Dashboard perfecto: InfluxDB, Telegraf y Grafana – Parte VI (Monitorizando Veeam)
- En busca del Dashboard perfecto: InfluxDB, Telegraf y Grafana – Parte VII (Monitorizar vSphere)
- En busca del Dashboard perfecto: InfluxDB, Telegraf y Grafana – Parte VIII (Monitorizando Veeam con Enterprise Manager)
- En busca del Dashboard perfecto: InfluxDB, Telegraf y Grafana – Parte IX (Monitorizando Zimbra Collaboration)
- En busca del Dashboard perfecto: InfluxDB, Telegraf y Grafana – Parte X (Grafana Plugins)
- En busca del Dashboard perfecto: InfluxDB, Telegraf y Grafana – Parte XI
- Looking for the Perfect Dashboard: InfluxDB, Telegraf and Grafana – Part XII (Native Telegraf Plugin for vSphere)
- Looking for the Perfect Dashboard: InfluxDB, Telegraf and Grafana – Part XIII (Veeam Backup for Microsoft Office 365 v4)
- Looking for the Perfect Dashboard: InfluxDB, Telegraf and Grafana – Part XIV – Veeam Availability Console
- Looking for the Perfect Dashboard: InfluxDB, Telegraf and Grafana – Part XV (IPMI Monitoring of our ESXi Hosts)
- Looking for Perfect Dashboard: InfluxDB, Telegraf and Grafana – Part XVI (Performance and Advanced Security of Veeam Backup for Microsoft Office 365)
- Looking for the Perfect Dashboard: InfluxDB, Telegraf and Grafana – Part XVII (Showing Dashboards on Two Monitors Using Raspberry Pi 4)
- En busca del Dashboard perfecto: InfluxDB, Telegraf y Grafana – Parte XVIII – Monitorizar temperatura y estado de Raspberry Pi 4
- Looking for the Perfect Dashboard: InfluxDB, Telegraf and Grafana – Part XIX (Monitoring Veeam with Enterprise Manager) Shell Script
Hi, thanks for another great guide!
I have one question, I managed to get it running with a couple of URL’s but when I remove some of them from the ssl.conf and restart telegraf it doesn’t seem to remove it from the dashboard. They just show up as N/A now.
How can I remove them from there?
Regards
Carl
Hello Carl, you will need to delete the data from Influxdb, as they are SSL, you can delete the whole measurement I would say.
Hola muchas gracias muy buena guiá y data.
Tienen algún ejemplo para monitorear varios dominios.
No pude dar con la información correcta de como agregar mas dominios. gracias.
Saludos Jeronimo, si claro, solo pon los diferentes dominios en el fichero de configuracion, debe funcionar bien. O te refieres a un SSL con multidominio?
Is it possible to monitor each services in zmcontrol?
Hi,
After implementing, it worked but after page reload the expiry date values changes…becomes inconsistent and outright wrong in most cases, is anyone experiencing same?
I experiment the same issue as Peter Bond. The metric keeps jumping between what looks like the correct measurement, 1354 and 1004 days. These weird 1354 and 1004 values are the same for all domains. This is an issue from Telegraf but I’m not sure where to start.
That’s a hack, but I was able to “fix” my issue with weird values by adding `AND expiry / 60 / 60 / 24 < 1000` to the queries in Grafana. I still don’t understand why these appear and I haven’t found anything online.
Hi Jorge,
great work thank you for this wonderful dashboard.
I have found some issue after configuring the source url under telegraf [[inputs.x509_cert]]. On the dashboard not all domains are shown which I configured under inputs. After searching the dashbaord query & changed the default query for field SAN to common_name. Dashboard is showing all domains.
question is there any special reason why you r quering the field SAN?
Default query:
from(bucket: v.defaultBucket)
|> range(start: v.timeRangeStart, stop: v.timeRangeStop)
|> filter(fn: (r) => r[“_measurement”] == “x509_cert”)
|> filter(fn: (r) => r[“san”] != “”)
|> keep(columns: [“san”])
|> distinct(column: “san”)
|> group()
changed to
from(bucket: v.defaultBucket)
|> range(start: v.timeRangeStart, stop: v.timeRangeStop)
|> filter(fn: (r) => r[“_measurement”] == “x509_cert”)
|> filter(fn: (r) => r[“common_name”] != “”)
|> keep(columns: [“common_name”])
|> distinct(column: “common_name”)
|> group()
Regards
Sino