
 Greetings friends, a new week is a week with a new dashboard, this is so, I would like to be able to offer you many more use cases, with many other technologies, but time is very limited and I only have some nights to prepare this.
Today we are going to see a topic that I have heard for at least 5 years, I mean to know and to know the amount of disk that we are using and saving, when we make use of technologies like ReFS, or XFS, together with Veeam Backup & Replication.
Once you have finished this tutorial, you will have something similar to this, it is better to give it several days or weeks to see the full potential: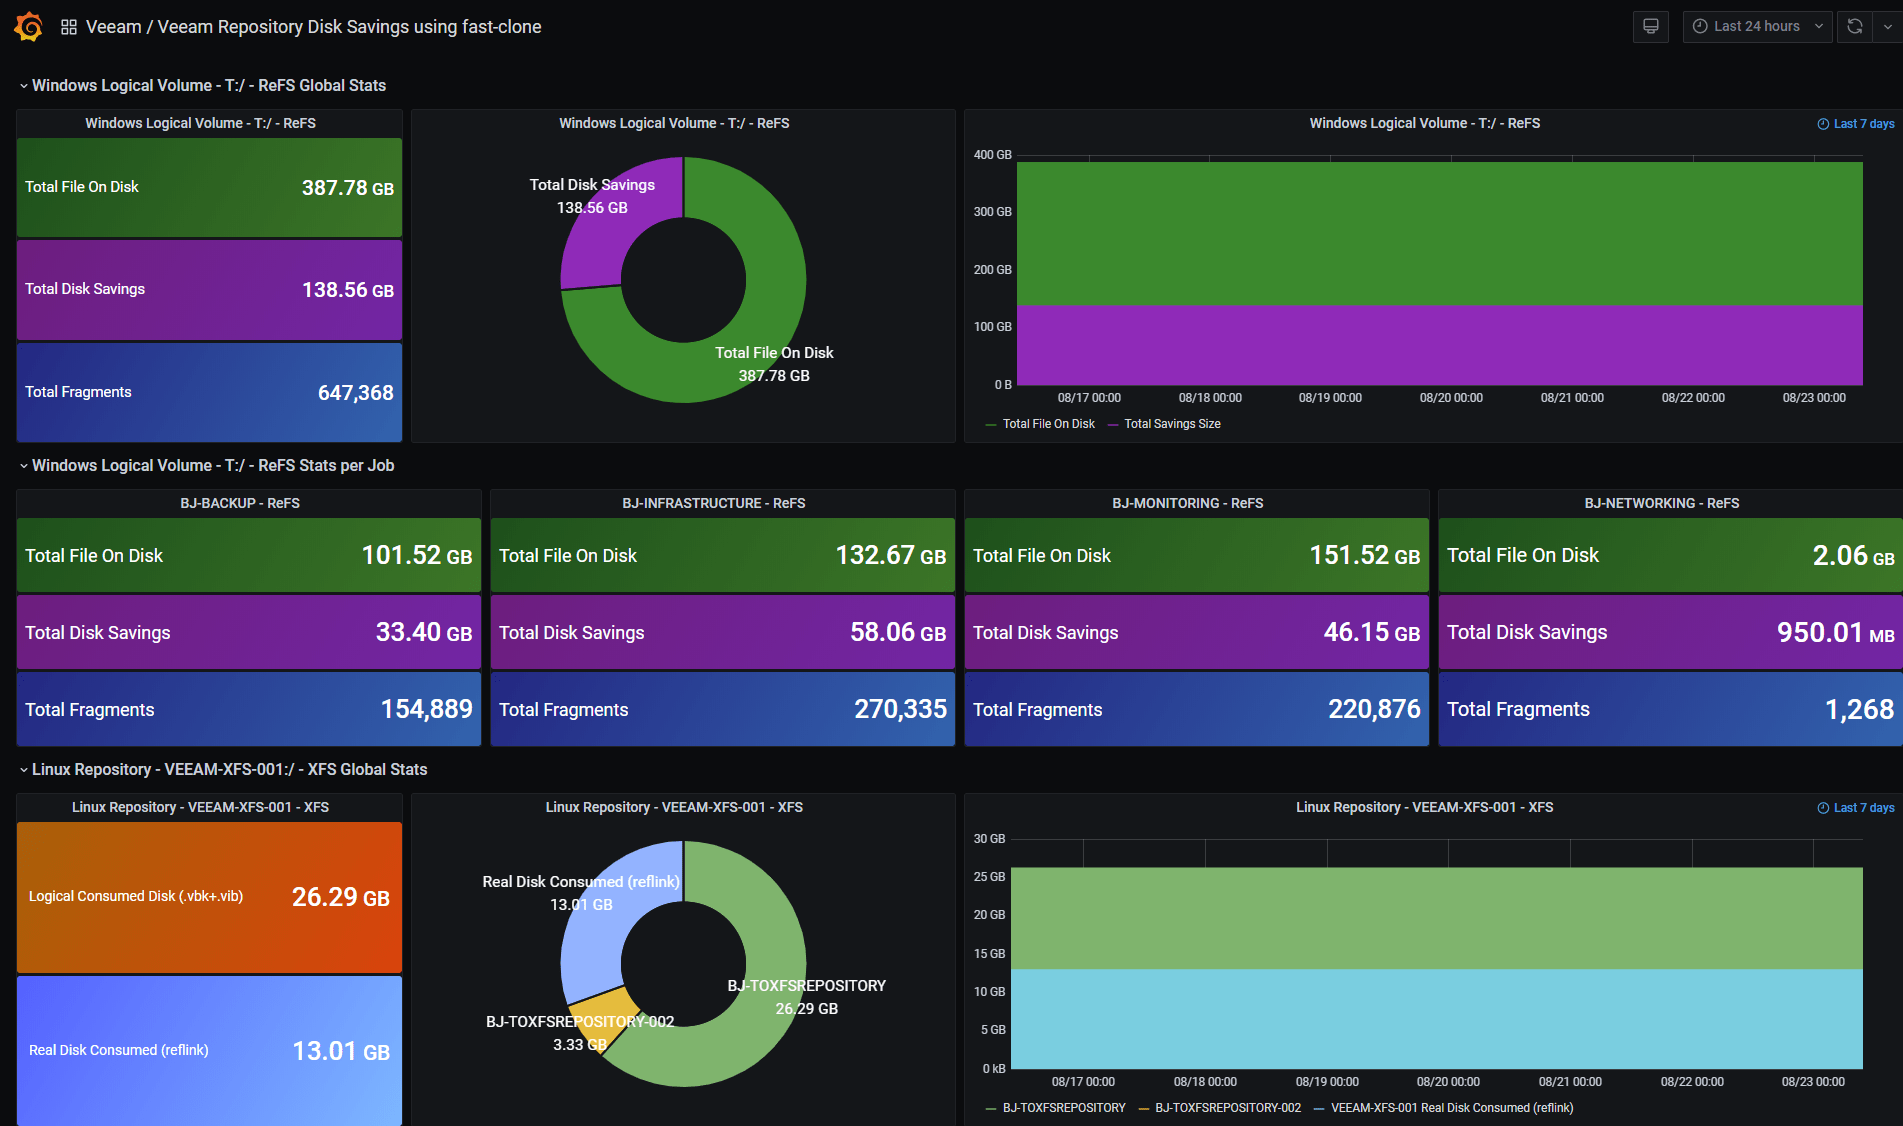
A brief reminder about ReFS and XFS with Veeam Backup & Replication
I know you all read me when I publish, but just in case you missed one of these two entries, they are necessary for this Dashboard to work of course. We will have to have backups, with synthetic backups activated, going to a ReFS or XFS repository, I leave you the step by step here:
- Veeam: Repositorios de Backup usando el nuevo Microsoft ReFS que viene incluido en Microsoft Windows Server 2016
- Veeam: What’s New in Veeam Backup & Replication v10 – XFS (Reflink) and Fast Clone Repositories in Veeam
Diagram of REFS/XFS, InfluxDB and Grafana monitoring disk usage in Veeam Backup Repositories
Although I have already shown you in some occasions the diagram of how would be the monitoring using Grafana and InfluxDB, I leave you again the diagram, this time monitoring the backups in ReFS/XFS repositories: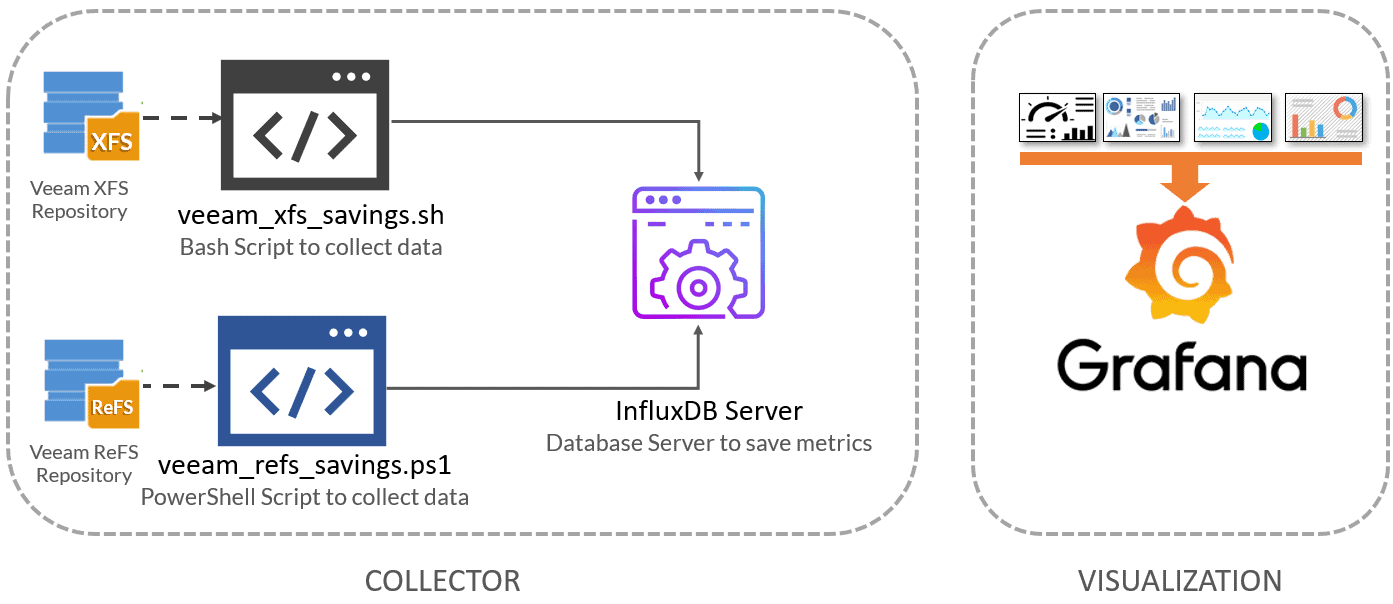
Download, and configure the veeam_refs_savings.ps1 script
First of all, we will have to download the magnificent blockstat.exe by Timothy Dewin, once downloaded, we put it in a folder and mark it as safe.
We will download the script that will make all this work in Microsoft Windows ReFS environments, we will download the latest version from the Github repository:
This PowerShell script has to be run from the Veeam Backup Repository where ReFS is enabled. We’ll have to edit the configuration parameters:
##
# Configurations
##
# Logical Volume with ReFS enabled
$dir = "T:\"
# Path to the blockstat.exe and for the output path
$exe = "C:\blockstat\blockstat.exe"
$listfilepath = "C:\blockstat\in.txt"
$outputpath = "C:\blockstat\out.xml"
$type="ReFS"

# Endpoint URL for InfluxDB
$veeamInfluxDBURL="http://YOURINFLUXSERVERIP" #Your InfluxDB Server, http://FQDN or https://FQDN if using SSL
$veeamInfluxDBPort="8086" #Default Port
$veeamInfluxDB="telegraf" #Default Database
$veeamInfluxDBUser="USER" #User for Database
$veeamInfluxDBPassword='PASSWORD' | ConvertTo-SecureString -asPlainText -Force
How to schedule the PowerShell script every 24 hours
I suppose that you want to know every day the disk consumption, as well as how much space you are saving using ReFS, etc. with what I am going to teach you how to create a programmed task every 24 hours.
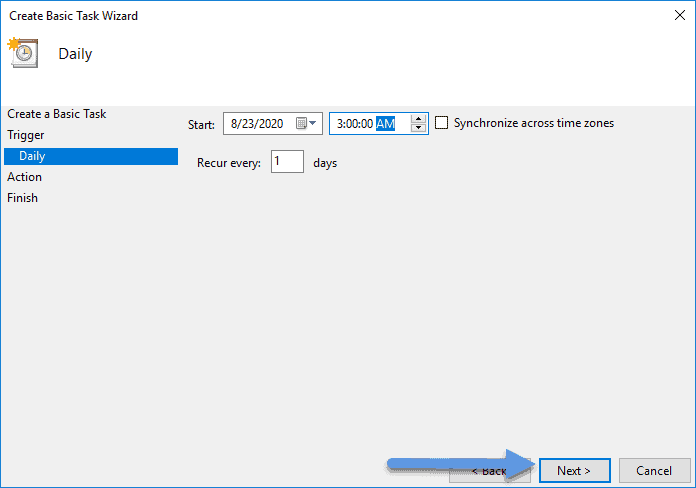
Please select a name for your scheduled task, this is the one I’ve chosen: 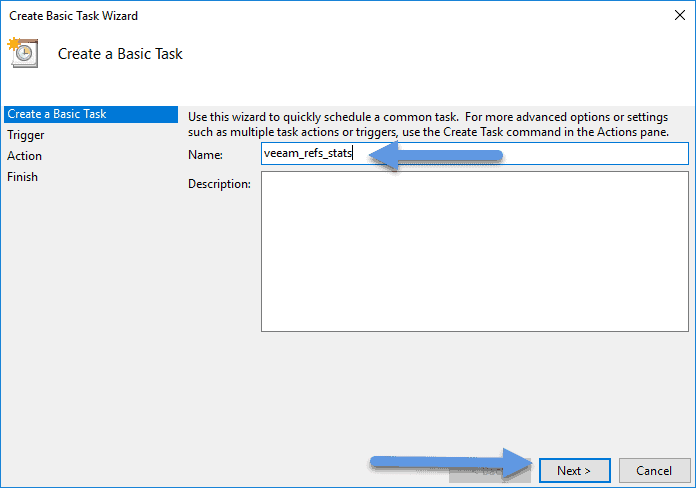 In the triggers, we’ll select that we want to run it every 24 hours:
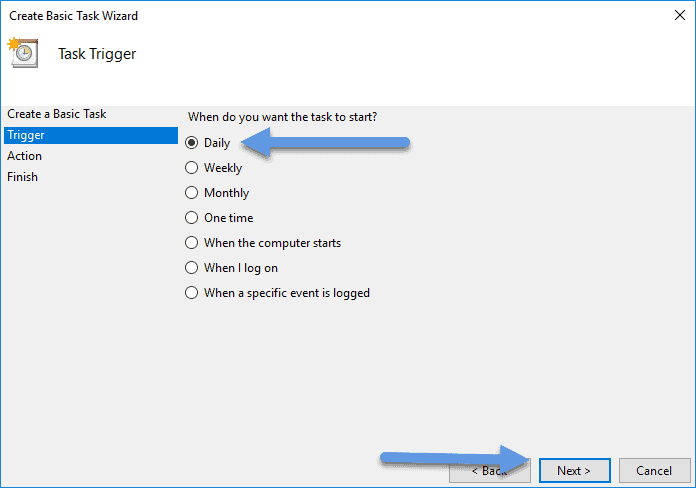
 In the actions, in program/script, we will select where we have Powershell, by default you can see the folder here, also in arguments we will select the path with the script included, and finally, in start in, we will select the folder:
  Let’s run it and see what happens:
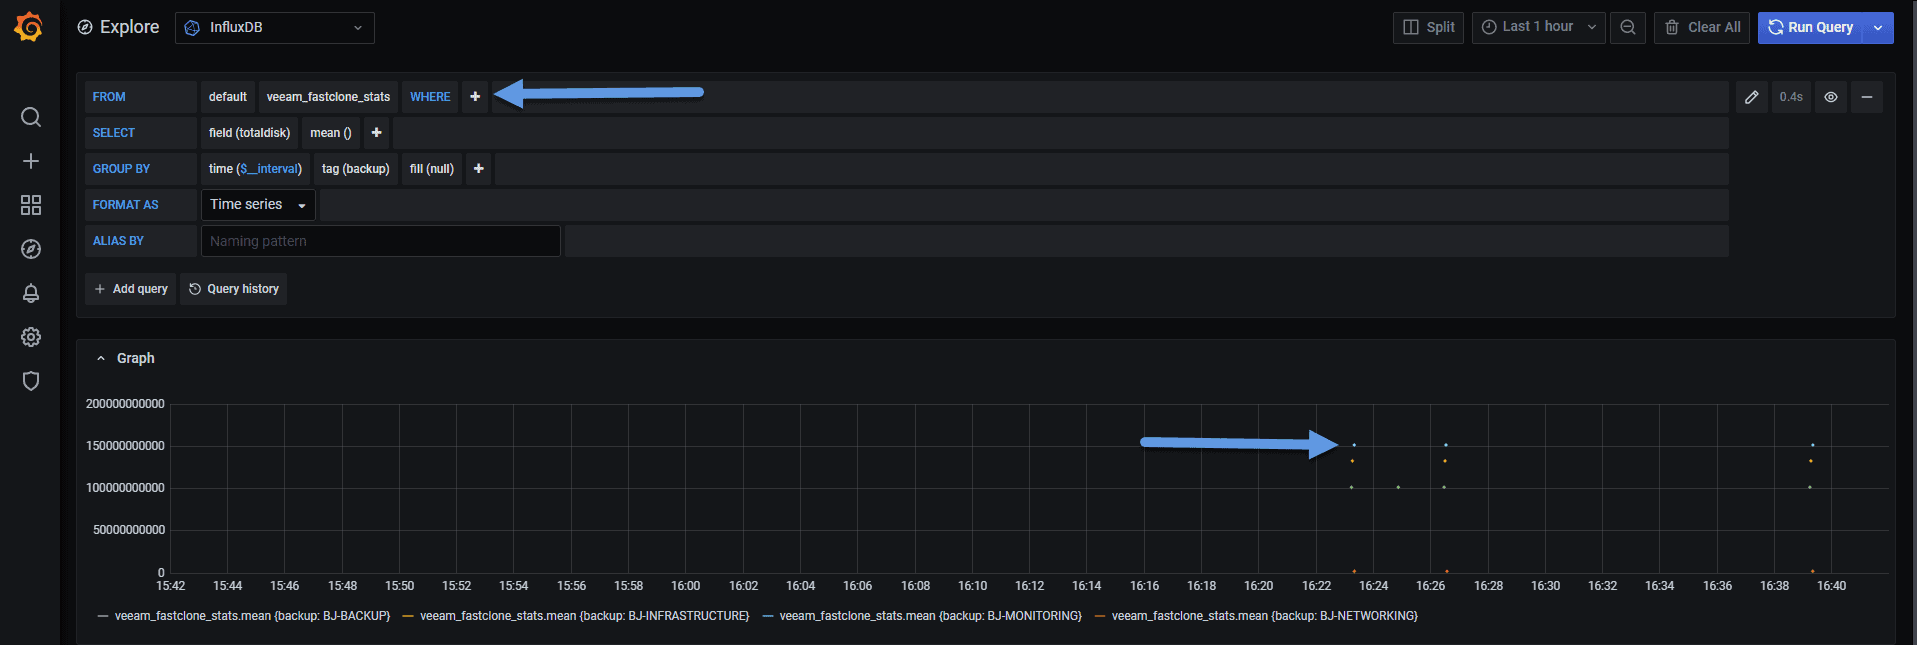
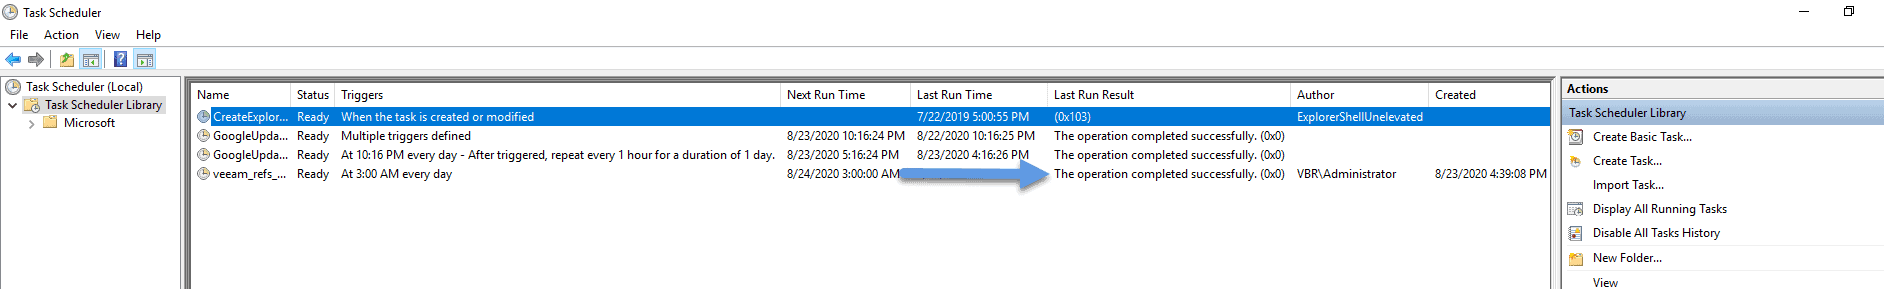 If we want to check very quickly that we already have information on InfluxDB, we can go to Grafana Explore and search within the table veeam_fastclone_stats:
Download, and configure the veeam_xfs_savings.sh script
Let’s download the script that will make all this work, we will download the latest version from the Github repository:
This shell script must be run from the server where we have the XFS volume. We will have to edit the configuration parameters:
##
# Configurations
##
# Endpoint URL for InfluxDB
veeamInfluxDBURL="http://YOURINFLUXSERVERIP" #Your InfluxDB Server, http://FQDN or https://FQDN if using SSL
veeamInfluxDBPort="8086" #Default Port
veeamInfluxDB="telegraf" #Default Database
veeamInfluxDBUser="USER" #User for Database
veeamInfluxDBPassword='PASSWORD' #Password for Database
veeamXFSMount="/backups/" #Your XFS mount point
veeamRepoName="VEEAM-XFS-001" #Your XFS Repo Name in Veeam Backup & Replication Server
type="XFS"
Let’s make the script executable:
chmod +x veeam_xfs_savings.sh
We will make sure we have jq installed, an apt-get install jq or yum install jq if we use CentOS:
sudo apt-get install jq
Let’s run it as per usual ./veeam_xfs_savings.sh if everything went alright, we will she the next output:
Writing veeam_xfs_savings to InfluxDB
HTTP/1.1 204 No Content
Content-Type: application/json
Request-Id: 98793b48-e51b-11ea-8307-dca632b112f7
X-Influxdb-Build: OSS
X-Influxdb-Version: 1.8.2
X-Request-Id: 98793b48-e51b-11ea-8307-dca632b112f7
Date: Sun, 23 Aug 2020 08:35:27 GMT

Writing veeam_xfs_savings to InfluxDB
HTTP/1.1 204 No Content
Content-Type: application/json
Request-Id: 9887b0af-e51b-11ea-8308-dca632b112f7
X-Influxdb-Build: OSS
X-Influxdb-Version: 1.8.2
X-Request-Id: 9887b0af-e51b-11ea-8308-dca632b112f7
Date: Sun, 23 Aug 2020 08:35:27 GMT
Also, it would be nice to put it in the cron to run every 24 hours:
crontab -e
0 3 * * * /home/oper/veeam_xfs_savings.sh >> /var/log/veeam_xfs_savings.log 2>&1
That’s all for now, let’s move to the next step.
Grafana Dashboards
I created a Dashboard from scratch by selecting the best requests to the database, finishing off colors, thinking about graphics, and how to display them, and everything is automated so that it fits our environment without any problem and without having to edit anything manually. The Dashboard can be found here, once imported, you can see all the graphics:
How to easily Import the Grafana Dashboard
So that you don’t have to waste hours configuring a new dashboard, and ingesting and debugging you want, I have already created four wonderful dashboards with everything necessary to monitor our environment in a very simple way, it will look like the image I showed you above. Select the name you want and enter the ID: 12881, which is the unique ID of the Dashboard, or the URL:
We’ll have everything popping up without any problem:
I hope you like it, and I would like to leave you the complete series here, so you can start playing with the plugins that I have been telling you about all these years:
- Looking for the Perfect Dashboard: InfluxDB, Telegraf, and Grafana – Part I (Installing InfluxDB, Telegraf, and Grafana on Ubuntu 20.04 LTS)
- En busca del Dashboard perfecto: InfluxDB, Telegraf y Grafana – Parte II (Instalar agente Telegraf en Nodos remotos Linux)
- En busca del Dashboard perfecto: InfluxDB, Telegraf y Grafana – Parte III Integración con PRTG
- En busca del Dashboard perfecto: InfluxDB, Telegraf y Grafana – Parte IV (Instalar agente Telegraf en Nodos remotos Windows)
- En busca del Dashboard perfecto: InfluxDB, Telegraf y Grafana – Parte V (Activar inputs específicos, Red, MySQL/MariaDB, Nginx)
- En busca del Dashboard perfecto: InfluxDB, Telegraf y Grafana – Parte VI (Monitorizando Veeam)
- En busca del Dashboard perfecto: InfluxDB, Telegraf y Grafana – Parte VII (Monitorizar vSphere)
- En busca del Dashboard perfecto: InfluxDB, Telegraf y Grafana – Parte VIII (Monitorizando Veeam con Enterprise Manager)
- En busca del Dashboard perfecto: InfluxDB, Telegraf y Grafana – Parte IX (Monitorizando Zimbra Collaboration)
- En busca del Dashboard perfecto: InfluxDB, Telegraf y Grafana – Parte X (Grafana Plugins)
- En busca del Dashboard perfecto: InfluxDB, Telegraf y Grafana – Parte XI – (Monitorizando URL e IPS con Telegraf y Ping)
- Looking for the Perfect Dashboard: InfluxDB, Telegraf, and Grafana – Part XII (Native Telegraf Plugin for vSphere)
- Looking for the Perfect Dashboard: InfluxDB, Telegraf, and Grafana – Part XIII (Veeam Backup for Microsoft Office 365 v4)
- Looking for the Perfect Dashboard: InfluxDB, Telegraf, and Grafana – Part XIV – Veeam Availability Console
- Looking for the Perfect Dashboard: InfluxDB, Telegraf, and Grafana – Part XV (IPMI Monitoring of our ESXi Hosts)
- Looking for Perfect Dashboard: InfluxDB, Telegraf, and Grafana – Part XVI (Performance and Advanced Security of Veeam Backup for Microsoft Office 365)
- Looking for the Perfect Dashboard: InfluxDB, Telegraf, and Grafana – Part XVII (Showing Dashboards on Two Monitors Using Raspberry Pi 4)
- En busca del Dashboard perfecto: InfluxDB, Telegraf y Grafana – Parte XVIII – Monitorizar temperatura y estado de Raspberry Pi 4
- Looking for the Perfect Dashboard: InfluxDB, Telegraf, and Grafana – Part XIX (Monitoring Veeam with Enterprise Manager) Shell Script
- Looking for the Perfect Dashboard: InfluxDB, Telegraf, and Grafana – Part XXIV (Monitoring Veeam Backup for Microsoft Azure)
- Looking for the Perfect Dashboard: InfluxDB, Telegraf, and Grafana – Part XXV (Monitoring Power Consumption)
- Looking for the Perfect Dashboard: InfluxDB, Telegraf, and Grafana – Part XXVI (Monitoring Veeam Backup for Nutanix)
- Looking for the Perfect Dashboard: InfluxDB, Telegraf, and Grafana – Part XXVII (Monitoring ReFS and XFS (block-cloning and reflink)
- Looking for the Perfect Dashboard: InfluxDB, Telegraf, and Grafana – Part XXVIII (Monitoring HPE StoreOnce)
- Looking for the Perfect Dashboard: InfluxDB, Telegraf, and Grafana – Part XXIX (Monitoring Pi-hole)
- Looking for the Perfect Dashboard: InfluxDB, Telegraf, and Grafana – Part XXIX (Monitoring Veeam Backup for AWS)
- Looking for the Perfect Dashboard: InfluxDB, Telegraf, and Grafana – Part XXXI (Monitoring Unifi Protect)
- Looking for the Perfect Dashboard: InfluxDB, Telegraf, and Grafana – Part XXXII (Monitoring Veeam ONE – experimental)
- Looking for the Perfect Dashboard: InfluxDB, Telegraf, and Grafana – Part XXXIII (Monitoring NetApp ONTAP)
- Looking for the Perfect Dashboard: InfluxDB, Telegraf, and Grafana – Part XXXIV (Monitoring Runecast)
- Looking for the Perfect Dashboard: InfluxDB, Telegraf, and Grafana – Part XXXV (GPU Monitoring)
- Looking for the Perfect Dashboard: InfluxDB, Telegraf, and Grafana – Part XXXVI (Monitoring Goldshell Miners – JSONv2)
- Looking for the Perfect Dashboard: InfluxDB, Telegraf, and Grafana – Part XXXVII (Monitoring Veeam Backup for Google Cloud Platform)
- En Busca del Dashboard perfecto: InfluxDB, Telegraf y Grafana – Parte XXXVIII (Monitorizando Temperatura y Humedad con Xiaomi Mijia)
- Looking for the Perfect Dashboard: InfluxDB, Telegraf, and Grafana – Part XL (Veeam Backup for Microsoft 365 – Restore Audit)
- Looking for the Perfect Dashboard: InfluxDB, Telegraf, and Grafana – Part XLI (Veeam Backup for Salesforce)
- Looking for the Perfect Dashboard: InfluxDB, Telegraf, and Grafana – Part XLII (Veeam ONE v12 Audit Events)
- Looking for the Perfect Dashboard: InfluxDB, Telegraf, and Grafana – Part XLIII (Monitoring QNAP using SNMP v3)
- Looking for the Perfect Dashboard: InfluxDB, Telegraf, and Grafana – Part XLIV (Monitoring Veeam Backup & Replication API)
- Looking for the Perfect Dashboard: InfluxDB, Telegraf, and Grafana – Part XLV (Monitoring Synology using SNMP v3)
- Looking for the Perfect Dashboard: InfluxDB, Telegraf, and Grafana – Part XLVI (Monitoring NVIDIA Jetson Nano)
- Looking for the Perfect Dashboard: InfluxDB, Telegraf, and Grafana – Part XLVII (Monitoring Open WebUI)
- Looking for the Perfect Dashboard: InfluxDB, Telegraf, and Grafana – Part XLVIII (Monitoring Veeam Data Platform Advanced)
Hi Jorge, for larger environments it would be nice to have the hostname included as well!
Thanks for this great dash!
Ohh, that is an awesome idea, let me see if I can add that quickly. How does it look for you? Any screenshot?
Cheers!