
 Greetings friends, it has been a while since I expanded the series of In Search of the Perfect Dashboard, but it has taken time to continue. Today I bring you a very interesting entry, which I really wanted to add to the series, it’s about how to collect Pi-hole statistics.
Once we finish all the steps, you should have a result similar to the following: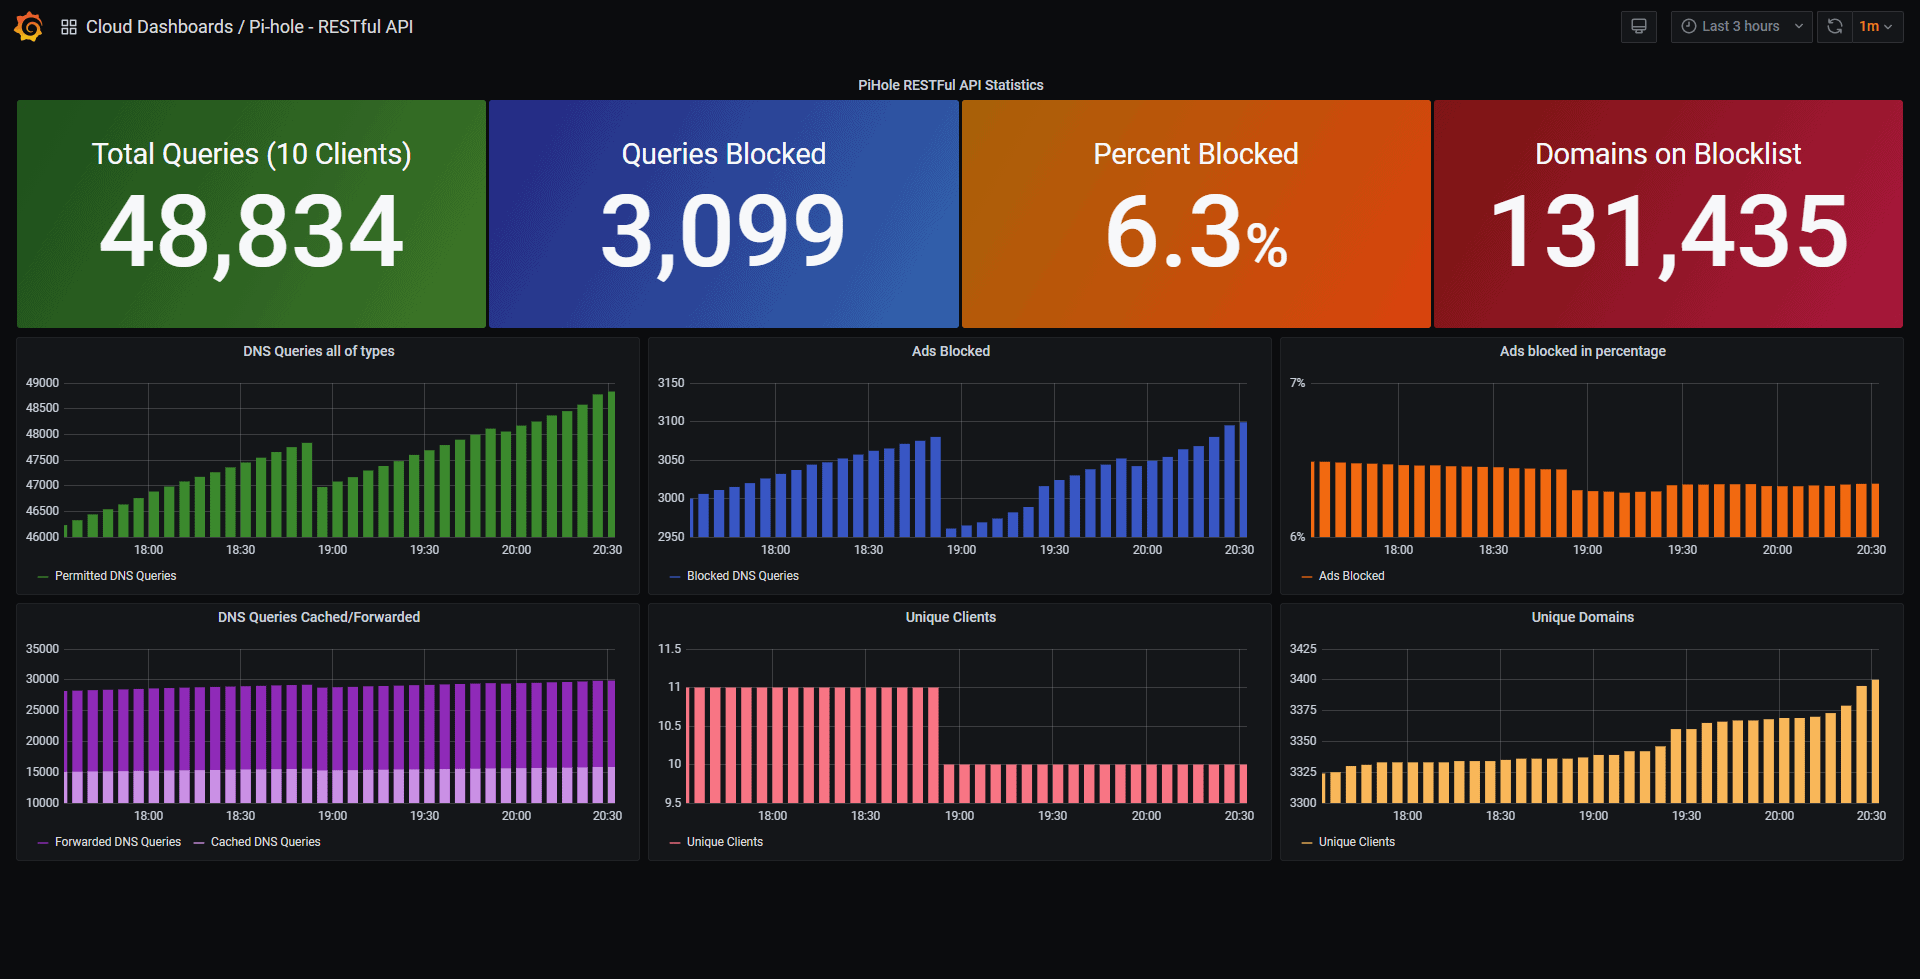 As you may know, if you use Pi-hole, the default interface of the solution is given an air.
What is Pi-hole?
Pi-Hole is an ad blocker that works at the DNS level protecting all our network. In a domestic environment, you can cut almost all the ads from all the devices in our house, without having to install an ad blocker in each one of them.
In simple terms, a DNS server is an Internet address record that helps locate the server using the domain name. When you visit any site, you make a query to the DNS server to locate the IP address (location) of the server you are connecting to. Pi-Hole is placed between our device and an upstream DNS server (maybe your Active Directory, or typical 8.8.8.8) and blocks any requests to known ad and tracking servers. Pi-Hole can accept DNS queries but depends on an upstream server to resolve the queries.
Some of the incredible features and advantages of Pi Hole:
- Free! All you need is a device to run Pi-Hole on – A Raspberry Pi, Linux Machine, or Docker.
- No client-side ad-blocking software is required.
- Over 100,000 ad service domains blocked with the default blocking lists.
- Blocks ads on any device, including smart TVs and other devices that do not allow any modification. The exception is devices with hard-coded DNS (explained below).
- It reduces bandwidth and improves overall network performance. As you can see in the image above. More than 50% of ad requests were blocked before being downloaded.
- Pi-Hole has a built-in web server that provides an easy to use web interface for administration.
We won’t see how to install it today, because it’s really only 5 minutes, but we’ll see how to monitor it, so let’s go! To get the information, I haven’t used complex scripts that require authentication, I have directly used the api.php that gives us the necessary data.
Configuring the Telegraf to scan the new .json and send it to InfluxDB
This time I will use the always versatile inputs.http, to analyze directly from the .json, the configuration couldn’t be easier, I have created a new file under /etc/telegraf/telegraf.d/pihole.conf with this inside, change only the URL to your Pi-hole:
[[inputs.http]]
#PiHole URL for data in JSON format
urls = ["http://192.168.1.3/admin/api.php"]
method = "GET"

#Overwrite measurement name from default `http` to `pihole_stats`
name_override = "pihole_stats"

#Exclude url and host items from tags
tagexclude = ["host"]

#Data from HTTP in JSON format
data_format = "json"

#JSON values to set as string fields
json_string_fields = ["url", "status"]

insecure_skip_verify = true
To test that everything works, please run the next command:
telegraf --config /etc/telegraf/telegraf.d/pihole.conf --test
The normal output of the command, if everything works as expected, might be something similar to this:
pihole_stats,ads_blocked_today=1946,ads_percentage_today=7.122987,clients_ever_seen=11,dns_queries_all_types=27320,dns_queries_today=27320,domains_being_blocked=131435,privacy_level=0,queries_cached=6864,queries_forwarded=18510,reply_CNAME=5149,reply_IP=8706,reply_NODATA=3177,reply_NXDOMAIN=2312,unique_clients=11,unique_domains=3122 gravity_last_updated_absolute=1607834043,gravity_last_updated_relative_days=1,gravity_last_updated_relative_hours=9,gravity_last_updated_relative_minutes=17,status="enabled" 1607953895000000000
Let’s go and restart the telegraf service with this simple command:
systemctl restart telegraf
If we now move to our Grafana – Explorer, we will be able to see new data:
Dashboard to see everything centrally
Now that we have all this information, we probably want to show it in a more elegant way.
Just by importing the next Dashboard using the Grafana URL, you will already have something similar to this:
At the end of the day, if everything has gone well, you will be able to see your great Pi-hole Dashboard and know how many requests you are saving, and show everyone how you have improved the quality and security of the network:
I hope you like it, and I would like to leave you the complete series here, so you can start playing with the plugins that I have been telling you about all these years:
- Looking for the Perfect Dashboard: InfluxDB, Telegraf, and Grafana – Part I (Installing InfluxDB, Telegraf, and Grafana on Ubuntu 20.04 LTS)
- En busca del Dashboard perfecto: InfluxDB, Telegraf y Grafana – Parte II (Instalar agente Telegraf en Nodos remotos Linux)
- En busca del Dashboard perfecto: InfluxDB, Telegraf y Grafana – Parte III Integración con PRTG
- En busca del Dashboard perfecto: InfluxDB, Telegraf y Grafana – Parte IV (Instalar agente Telegraf en Nodos remotos Windows)
- En busca del Dashboard perfecto: InfluxDB, Telegraf y Grafana – Parte V (Activar inputs específicos, Red, MySQL/MariaDB, Nginx)
- En busca del Dashboard perfecto: InfluxDB, Telegraf y Grafana – Parte VI (Monitorizando Veeam)
- En busca del Dashboard perfecto: InfluxDB, Telegraf y Grafana – Parte VII (Monitorizar vSphere)
- En busca del Dashboard perfecto: InfluxDB, Telegraf y Grafana – Parte VIII (Monitorizando Veeam con Enterprise Manager)
- En busca del Dashboard perfecto: InfluxDB, Telegraf y Grafana – Parte IX (Monitorizando Zimbra Collaboration)
- En busca del Dashboard perfecto: InfluxDB, Telegraf y Grafana – Parte X (Grafana Plugins)
- En busca del Dashboard perfecto: InfluxDB, Telegraf y Grafana – Parte XI – (Monitorizando URL e IPS con Telegraf y Ping)
- Looking for the Perfect Dashboard: InfluxDB, Telegraf, and Grafana – Part XII (Native Telegraf Plugin for vSphere)
- Looking for the Perfect Dashboard: InfluxDB, Telegraf, and Grafana – Part XIII (Veeam Backup for Microsoft Office 365 v4)
- Looking for the Perfect Dashboard: InfluxDB, Telegraf, and Grafana – Part XIV – Veeam Availability Console
- Looking for the Perfect Dashboard: InfluxDB, Telegraf, and Grafana – Part XV (IPMI Monitoring of our ESXi Hosts)
- Looking for Perfect Dashboard: InfluxDB, Telegraf, and Grafana – Part XVI (Performance and Advanced Security of Veeam Backup for Microsoft Office 365)
- Looking for the Perfect Dashboard: InfluxDB, Telegraf, and Grafana – Part XVII (Showing Dashboards on Two Monitors Using Raspberry Pi 4)
- En busca del Dashboard perfecto: InfluxDB, Telegraf y Grafana – Parte XVIII – Monitorizar temperatura y estado de Raspberry Pi 4
- Looking for the Perfect Dashboard: InfluxDB, Telegraf, and Grafana – Part XIX (Monitoring Veeam with Enterprise Manager) Shell Script
- Looking for the Perfect Dashboard: InfluxDB, Telegraf, and Grafana – Part XXIV (Monitoring Veeam Backup for Microsoft Azure)
- Looking for the Perfect Dashboard: InfluxDB, Telegraf, and Grafana – Part XXV (Monitoring Power Consumption)
- Looking for the Perfect Dashboard: InfluxDB, Telegraf, and Grafana – Part XXVI (Monitoring Veeam Backup for Nutanix)
- Looking for the Perfect Dashboard: InfluxDB, Telegraf, and Grafana – Part XXVII (Monitoring ReFS and XFS (block-cloning and reflink)
- Looking for the Perfect Dashboard: InfluxDB, Telegraf, and Grafana – Part XXVIII (Monitoring HPE StoreOnce)
- Looking for the Perfect Dashboard: InfluxDB, Telegraf, and Grafana – Part XXIX (Monitoring Pi-hole)
- Looking for the Perfect Dashboard: InfluxDB, Telegraf, and Grafana – Part XXIX (Monitoring Veeam Backup for AWS)
- Looking for the Perfect Dashboard: InfluxDB, Telegraf, and Grafana – Part XXXI (Monitoring Unifi Protect)
- Looking for the Perfect Dashboard: InfluxDB, Telegraf, and Grafana – Part XXXII (Monitoring Veeam ONE – experimental)
- Looking for the Perfect Dashboard: InfluxDB, Telegraf, and Grafana – Part XXXIII (Monitoring NetApp ONTAP)
- Looking for the Perfect Dashboard: InfluxDB, Telegraf, and Grafana – Part XXXIV (Monitoring Runecast)
- Looking for the Perfect Dashboard: InfluxDB, Telegraf, and Grafana – Part XXXV (GPU Monitoring)
- Looking for the Perfect Dashboard: InfluxDB, Telegraf, and Grafana – Part XXXVI (Monitoring Goldshell Miners – JSONv2)
- Looking for the Perfect Dashboard: InfluxDB, Telegraf, and Grafana – Part XXXVII (Monitoring Veeam Backup for Google Cloud Platform)
- En Busca del Dashboard perfecto: InfluxDB, Telegraf y Grafana – Parte XXXVIII (Monitorizando Temperatura y Humedad con Xiaomi Mijia)
- Looking for the Perfect Dashboard: InfluxDB, Telegraf, and Grafana – Part XL (Veeam Backup for Microsoft 365 – Restore Audit)
- Looking for the Perfect Dashboard: InfluxDB, Telegraf, and Grafana – Part XLI (Veeam Backup for Salesforce)
- Looking for the Perfect Dashboard: InfluxDB, Telegraf, and Grafana – Part XLII (Veeam ONE v12 Audit Events)
- Looking for the Perfect Dashboard: InfluxDB, Telegraf, and Grafana – Part XLIII (Monitoring QNAP using SNMP v3)
- Looking for the Perfect Dashboard: InfluxDB, Telegraf, and Grafana – Part XLIV (Monitoring Veeam Backup & Replication API)
- Looking for the Perfect Dashboard: InfluxDB, Telegraf, and Grafana – Part XLV (Monitoring Synology using SNMP v3)
- Looking for the Perfect Dashboard: InfluxDB, Telegraf, and Grafana – Part XLVI (Monitoring NVIDIA Jetson Nano)
- Looking for the Perfect Dashboard: InfluxDB, Telegraf, and Grafana – Part XLVII (Monitoring Open WebUI)
- Looking for the Perfect Dashboard: InfluxDB, Telegraf, and Grafana – Part XLVIII (Monitoring Veeam Data Platform Advanced)
- Looking for the Perfect Dashboard: InfluxDB, Telegraf, and Grafana – Part XLIX (Monitoring Unofficial Veeam ONE Node Exporter)
Thanks for the post. I have been thinking about adding custom feeds to Telegraf/InfluxDB and your JSON example is very helpful. I’m building a section of my dashboard for important backyard chickens metrics like temperature, humidity, and whether the water heater turned on or not 🙂
Hey Jorge, thanks for the awesome dashboard. Is there any way to configure it to display the actual top domains/queries such as in this example? https://grafana.com/grafana/dashboards/10176