
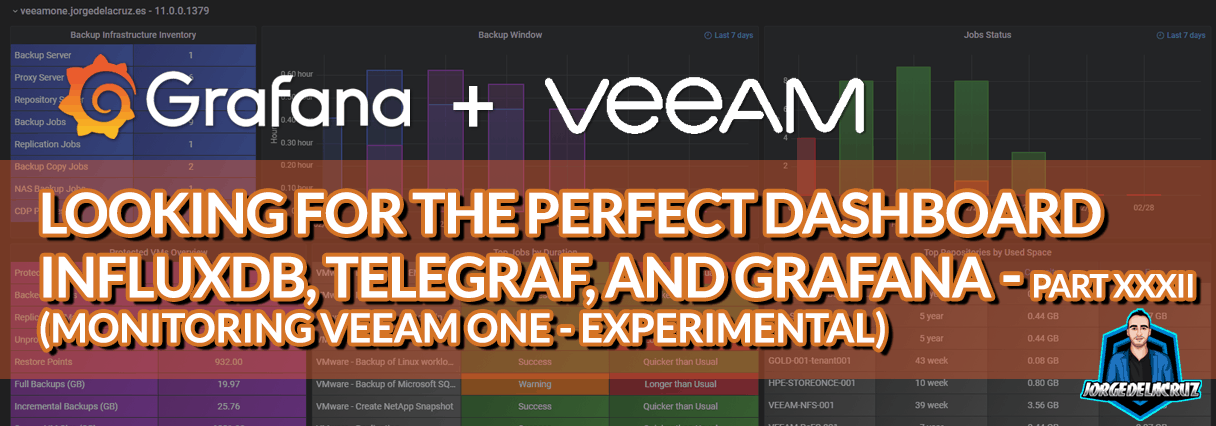
 Greetings friends, today I bring you a new post about Grafana, today’s post is also one of the most special that I have written, since it is an experimental version, and we do not know if this will come to some port, or will be changed in the future.
I am talking about nothing more and nothing less than a Grafana Dashboard for Veeam ONE! Yes, imagine combining all the potential that Veeam ONE has, which already analyzes VMware, Veeam, gives us recommendations, consumption, capacity planning, etc. And put all that data in a beautiful Grafana Dashboard, well that’s what we are going to do today.
Before we start, and in case the experimental is not enough, I want to remind you that this RESTful API of Veeam ONE is considered internal, so its use is not supported by Veeam, use this Dashboard at your own risk.
Veeam ONE Dashboard (experimental)
When we finish the entry we will have something similar to that Dashboard that will allow you to visualize: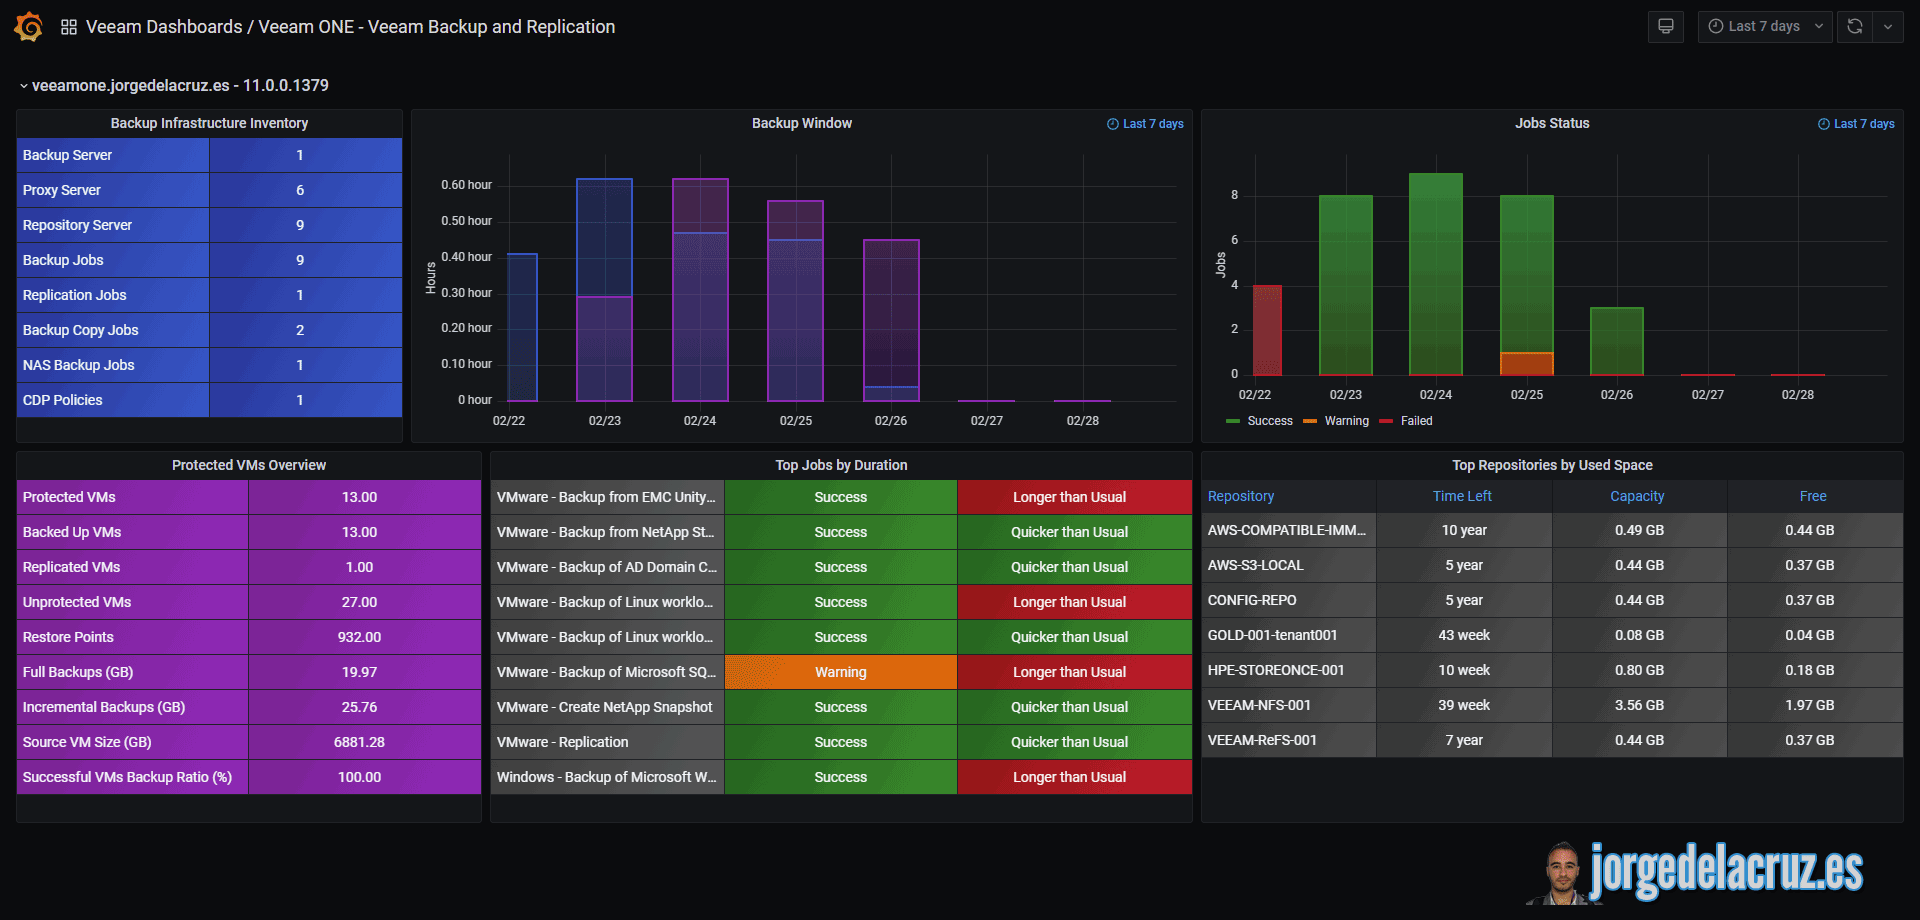
Dashboard – Summary
This first dashboard of the series, because I intend to create all the Dashboards that Veeam ONE gives us, contains:
- Backup Infrastructure Inventory – How many Veeam components we have added to this Veeam ONE.
- Backup Window – A graph where we find the last 7 days with the Backup, Replica, and NAS job windows.
- Job Status – A graph where we find the last 7 days with the jobs that have been successful, or that have had a warning or error.
- Protected VMs Overview – A very complete table showing all our VMs, those that are protected, those that are not, the size of the copies, etc.
- Top Jobs by Duration – A very complete table where we find our jobs, and the duration of them, with additional information if it is taking more time than normal or not.
- Top Repositories by Used Space – A very complete table where we find our jobs, and the duration of them, with additional information if it is taking more time than normal or not.
Diagram with all logical components
This post is similar to the previous ones as in this case, we will use a combination of a shell script to collect Veeam ONE metrics using RESTful API and InfluxDB. The design would look something similar to this: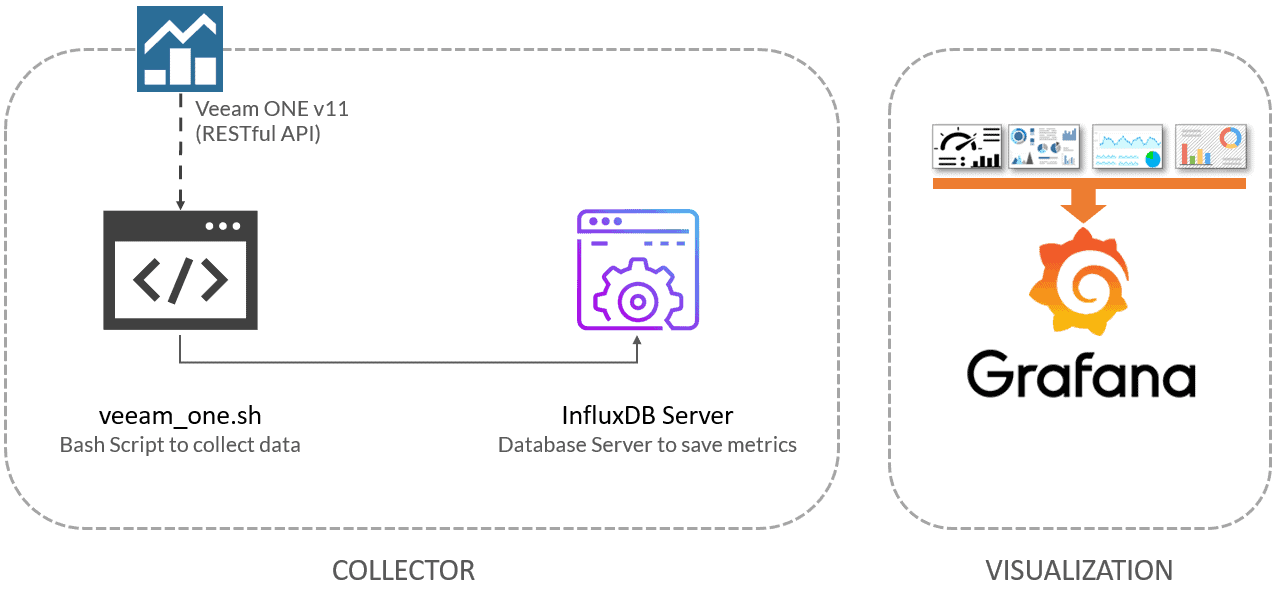 As we can see, the shell script will download the metrics from Veeam ONE using the RESTful API, which will send all the data to InfluxDB, from where we can conveniently view them with Grafana.
Download, and configure the veeam_one.sh script
We have almost everything ready, we have one last step, the script that will make all this work, we will download the latest version from the Github repository:
This shell script can be downloaded and executed from the telegraf server, or influxDB, or any other Linux. We will have to edit the configuration parameters:
veeamInfluxDBURL="YOURINFLUXSERVER" ##Use https://fqdn or https://IP in case you use SSL
veeamInfluxDBPort="8086" #Default Port
veeamInfluxDB="YOURINFLUXDB" #Default Database
veeamInfluxDBUser="YOURINFLUXUSER" #User for Database
veeamInfluxDBPassword="YOURINFLUXPASS" #Password for Database

# Endpoint URL for login action
veeamUsername="YOURVEEAMONEUSER" #Usually domain\user or [email protected]
veeamPassword="YOURVEEAMONEPASS"
veeamONEServer="https://YOURVEEAMONEIP" #You can use FQDN if you like as well
veeamONEPort="1239" #Default Port
Once the changes are made, make the script executable with chmod:
chmod +x veeam_one.sh
We run it, and the output of the command should look something like the following, with no errors:
Writing veeam_ONE_repositories to InfluxDB
HTTP/1.1 204 No Content
Content-Type: application/json
Request-Id: 9e9c517e-7a11-11eb-8acb-0050569017a8
X-Influxdb-Build: OSS
X-Influxdb-Version: 1.8.4
X-Request-Id: 9e9c517e-7a11-11eb-8acb-0050569017a8
Date: Sun, 28 Feb 2021 22:09:25 GMT
If so, please now add this script to your crontab, like for example every 30 minutes, I don’t think our Dashboards are updated more often, but good to download it if so:
*/30 * * * * /home/oper/veeam_one.sh >> /var/log/veeamone.log 2>&1
We are ready to go to the next step.
Grafana Dashboards
I created a Dashboard from scratch by selecting the best requests to the database, finalizing the colors, thinking about the graphics and how to display them, and everything is automated to fit our environment without any problems and without having to edit anything manually. The Dashboard can be found here, once imported, you can use the top drop-down menus to select between Veeam ONE Servers, etc:
Importing the Grafana Dashboard in a simple way
So that you don’t have to waste hours configuring a new Dashboard, and ingesting and debugging what you want, I have already created a wonderful Dashboard with everything you need to monitor our environment in a very simple way, it will look like the image I showed you above. Select the name you want and enter the ID: 13986, which is the unique ID of the Dashboard, or the URL:
 With the menus above, we can move between Veeam ONE Servers (yes, this is intended for Service Providers as well): Please leave your comments here, or on GitHub – thanks so much for reading!
I hope you like it, and I would like to leave you the complete series here, so you can start playing with the plugins that I have been telling you about all these years:
- Looking for the Perfect Dashboard: InfluxDB, Telegraf, and Grafana – Part I (Installing InfluxDB, Telegraf, and Grafana on Ubuntu 20.04 LTS)
- En busca del Dashboard perfecto: InfluxDB, Telegraf y Grafana – Parte II (Instalar agente Telegraf en Nodos remotos Linux)
- En busca del Dashboard perfecto: InfluxDB, Telegraf y Grafana – Parte III Integración con PRTG
- En busca del Dashboard perfecto: InfluxDB, Telegraf y Grafana – Parte IV (Instalar agente Telegraf en Nodos remotos Windows)
- En busca del Dashboard perfecto: InfluxDB, Telegraf y Grafana – Parte V (Activar inputs específicos, Red, MySQL/MariaDB, Nginx)
- En busca del Dashboard perfecto: InfluxDB, Telegraf y Grafana – Parte VI (Monitorizando Veeam)
- En busca del Dashboard perfecto: InfluxDB, Telegraf y Grafana – Parte VII (Monitorizar vSphere)
- En busca del Dashboard perfecto: InfluxDB, Telegraf y Grafana – Parte VIII (Monitorizando Veeam con Enterprise Manager)
- En busca del Dashboard perfecto: InfluxDB, Telegraf y Grafana – Parte IX (Monitorizando Zimbra Collaboration)
- En busca del Dashboard perfecto: InfluxDB, Telegraf y Grafana – Parte X (Grafana Plugins)
- En busca del Dashboard perfecto: InfluxDB, Telegraf y Grafana – Parte XI – (Monitorizando URL e IPS con Telegraf y Ping)
- Looking for the Perfect Dashboard: InfluxDB, Telegraf, and Grafana – Part XII (Native Telegraf Plugin for vSphere)
- Looking for the Perfect Dashboard: InfluxDB, Telegraf, and Grafana – Part XIII (Veeam Backup for Microsoft Office 365 v4)
- Looking for the Perfect Dashboard: InfluxDB, Telegraf, and Grafana – Part XIV – Veeam Availability Console
- Looking for the Perfect Dashboard: InfluxDB, Telegraf, and Grafana – Part XV (IPMI Monitoring of our ESXi Hosts)
- Looking for Perfect Dashboard: InfluxDB, Telegraf, and Grafana – Part XVI (Performance and Advanced Security of Veeam Backup for Microsoft Office 365)
- Looking for the Perfect Dashboard: InfluxDB, Telegraf, and Grafana – Part XVII (Showing Dashboards on Two Monitors Using Raspberry Pi 4)
- En busca del Dashboard perfecto: InfluxDB, Telegraf y Grafana – Parte XVIII – Monitorizar temperatura y estado de Raspberry Pi 4
- Looking for the Perfect Dashboard: InfluxDB, Telegraf, and Grafana – Part XIX (Monitoring Veeam with Enterprise Manager) Shell Script
- Looking for the Perfect Dashboard: InfluxDB, Telegraf, and Grafana – Part XXIV (Monitoring Veeam Backup for Microsoft Azure)
- Looking for the Perfect Dashboard: InfluxDB, Telegraf, and Grafana – Part XXV (Monitoring Power Consumption)
- Looking for the Perfect Dashboard: InfluxDB, Telegraf, and Grafana – Part XXVI (Monitoring Veeam Backup for Nutanix)
- Looking for the Perfect Dashboard: InfluxDB, Telegraf, and Grafana – Part XXVII (Monitoring ReFS and XFS (block-cloning and reflink)
- Looking for the Perfect Dashboard: InfluxDB, Telegraf, and Grafana – Part XXVIII (Monitoring HPE StoreOnce)
- Looking for the Perfect Dashboard: InfluxDB, Telegraf, and Grafana – Part XXIX (Monitoring Pi-hole)
- Looking for the Perfect Dashboard: InfluxDB, Telegraf, and Grafana – Part XXIX (Monitoring Veeam Backup for AWS)
- Looking for the Perfect Dashboard: InfluxDB, Telegraf, and Grafana – Part XXXI (Monitoring Unifi Protect)
- Looking for the Perfect Dashboard: InfluxDB, Telegraf, and Grafana – Part XXXII (Monitoring Veeam ONE – experimental)
- Looking for the Perfect Dashboard: InfluxDB, Telegraf, and Grafana – Part XXXIII (Monitoring NetApp ONTAP)
- Looking for the Perfect Dashboard: InfluxDB, Telegraf, and Grafana – Part XXXIV (Monitoring Runecast)
- Looking for the Perfect Dashboard: InfluxDB, Telegraf, and Grafana – Part XXXV (GPU Monitoring)
- Looking for the Perfect Dashboard: InfluxDB, Telegraf, and Grafana – Part XXXVI (Monitoring Goldshell Miners – JSONv2)
- Looking for the Perfect Dashboard: InfluxDB, Telegraf, and Grafana – Part XXXVII (Monitoring Veeam Backup for Google Cloud Platform)
- En Busca del Dashboard perfecto: InfluxDB, Telegraf y Grafana – Parte XXXVIII (Monitorizando Temperatura y Humedad con Xiaomi Mijia)
- Looking for the Perfect Dashboard: InfluxDB, Telegraf, and Grafana – Part XL (Veeam Backup for Microsoft 365 – Restore Audit)
- Looking for the Perfect Dashboard: InfluxDB, Telegraf, and Grafana – Part XLI (Veeam Backup for Salesforce)
- Looking for the Perfect Dashboard: InfluxDB, Telegraf, and Grafana – Part XLII (Veeam ONE v12 Audit Events)
- Looking for the Perfect Dashboard: InfluxDB, Telegraf, and Grafana – Part XLIII (Monitoring QNAP using SNMP v3)
- Looking for the Perfect Dashboard: InfluxDB, Telegraf, and Grafana – Part XLIV (Monitoring Veeam Backup & Replication API)
- Looking for the Perfect Dashboard: InfluxDB, Telegraf, and Grafana – Part XLV (Monitoring Synology using SNMP v3)
- Looking for the Perfect Dashboard: InfluxDB, Telegraf, and Grafana – Part XLVI (Monitoring NVIDIA Jetson Nano)
- Looking for the Perfect Dashboard: InfluxDB, Telegraf, and Grafana – Part XLVII (Monitoring Open WebUI)
- Looking for the Perfect Dashboard: InfluxDB, Telegraf, and Grafana – Part XLVIII (Monitoring Veeam Data Platform Advanced)
- Looking for the Perfect Dashboard: InfluxDB, Telegraf, and Grafana – Part XLIX (Monitoring Unofficial Veeam ONE Node Exporter)
Hi , this is quite interesting. is there a way we could use prometheus instead of influx ?
Hello,
My bash shell reads the data from the API, and sends it to Influx. So you can probably change that last part and send it to Prometheus on the format you expect. For the dashboard, I am afraid it uses Influx queries, so you will need to redo all the queries 🙂
This script errors out on me with an http/400 error:
Writing veeam_ONE_about to InfluxDB
HTTP/1.1 400 Bad Request
Content-Type: application/json
Request-Id: 28260fec-11a6-11ec-9d7f-0050568ba5de
X-Influxdb-Build: OSS
X-Influxdb-Error: unable to parse ‘veeam_ONE_about,voneserver=,voneversion= vone=1’: missing tag value
X-Influxdb-Version: 1.8.9
X-Request-Id: 28260fec-11a6-11ec-9d7f-0050568ba5de
Date: Thu, 09 Sep 2021 19:43:07 GMT
Content-Length: 97
{“error”:”unable to parse ‘veeam_ONE_about,voneserver=,voneversion= vone=1’: missing tag value”}
Hello,
Do you have Veeam ONE v11, and a VBR, a vCenter added to your VONE, etc?
Best regards
Yes, I have a VeeamONE v11, and multiple v11 VBRs added to it.
Strange, looks like the same error that others had, and could fix with Support help it seems – https://github.com/jorgedlcruz/veeam-one-grafana/issues/2
You can not ask about help with the dashboard, but yes about the API and why does not expose what you are expecting, I guess you will need to dig a bit more, you running the latest version of the script, right?
https://raw.githubusercontent.com/jorgedlcruz/veeam-one-grafana/main/veeam_one.sh
veeamInfluxDBURL=”YOURINFLUXSERVER” ##Use https://fqdn or https://IP in case you use SSL
veeamInfluxDBPort=”8086″ #Default Port
veeamInfluxDB=”YOURINFLUXDB” #Default Database
veeamInfluxDBUser=”YOURINFLUXUSER” #User for Database
veeamInfluxDBPassword=”YOURINFLUXPASS” #Password for Database
# Endpoint URL for login action
veeamUsername=”YOURVEEAMONEUSER” #Usually domain\user or [email protected]
veeamPassword=”YOURVEEAMONEPASS”
veeamONEServer=”https://YOURVEEAMONEIP” #You can use FQDN if you like as well
veeamONEPort=”1239″ #Default Port
my questions are: for the input of “YOURINFLUXSERVER” is this using the ” ” or just the http://ipaddress ?
also it shall be just put =8086 or =”8086″ ? and so on the influxdb=glances or “glances” ? because I set as your recommended but the result was not working:
[root@netappHarvest /]# sh netapp_ontap.sh
netapp_ontap.sh: line 43: jq: command not found
netapp_ontap.sh: line 44: jq: command not found
netapp_ontap.sh: line 45: jq: command not found
netapp_ontap.sh: line 46: jq: command not found
netapp_ontap.sh: line 47: jq: command not found
netapp_ontap.sh: line 48: jq: command not found
netapp_ontap.sh: line 49: jq: command not found
Writing netapp_cluster_overview to InfluxDB
HTTP/1.1 400 Bad Request
Content-Type: application/json
Request-Id: 0ea4f66d-8d47-11ec-800d-5209b1f6833b
X-Influxdb-Build: OSS
X-Influxdb-Error: unable to parse ‘netapp_cluster_overview,clustername=,uuid=,clusterversion=,managementnetwork= versiongeneration=,versionmajor=,versionminor=’: missing tag value
X-Influxdb-Version: 1.8.10
X-Request-Id: 0ea4f66d-8d47-11ec-800d-5209b1f6833b
Date: Mon, 14 Feb 2022 03:34:46 GMT
Content-Length: 174
{“error”:”unable to parse ‘netapp_cluster_overview,clustername=,uuid=,clusterversion=,managementnetwork= versiongeneration=,versionmajor=,versionminor=’: missing tag value”}
netapp_ontap.sh: line 96: jq: command not found
netapp_ontap.sh: line 135: jq: command not found
netapp_ontap.sh: line 225: jq: command not found
netapp_ontap.sh: line 256: jq: command not found
netapp_ontap.sh: line 289: jq: command not found
netapp_ontap.sh: line 323: jq: command not found
[root@netappHarvest /]#
============
below is the configuration we made up:
##
# Configurations
##
# Endpoint URL for InfluxDB
netappInfluxDBURL=http://10.254.201.81 #Your InfluxDB Server, http://FQDN or https://FQDN if using SSL
netappInfluxDBPort=8086 #Default Port
netappInfluxDB=glances #Default Database
netappInfluxDBUser=’admin’ #User for Database
netappInfluxDBPassword=’StrongPassw0rd’ #Password for Database
# Endpoint URL for login action
netappUsername=”netapp-harvest” #Your username with privileges to login into the ONTAP
netappPassword=”netapp123″
netappAuth=$(echo -ne “$netappUsername:$netappPassword” | base64);
netappRestServer=10.254.201.210
netappMetrics=20 #They came in interval of 15 seconds, so 20 will be equal to the metrics of the last 5 minutes. If you want to run your script every 5 minutes, let it like this, if not, change it accordingly.
Please to solve it.
Thanks and regards,
JHony
Hello,
You need to install jq, apt-get install jq
Best regards
Ei Jorge!
Tenho o erro abaixo ao executar o script
Será que consegue me ajudar?
Writing veeam_ONE_about to InfluxDB
HTTP/1.1 401 Unauthorized
Content-Type: application/json; charset=utf-8
X-Influxdb-Build: OSS
X-Influxdb-Version: v2.4.0
X-Platform-Error-Code: unauthorized
Date: Tue, 04 Oct 2022 22:27:21 GMT
Content-Length: 48
{“code”:”unauthorized”,”message”:”Unauthorized”}Writing veeam_ONE_protectedvms to InfluxDB
HTTP/1.1 401 Unauthorized
Content-Type: application/json; charset=utf-8
X-Influxdb-Build: OSS
X-Influxdb-Version: v2.4.0
X-Platform-Error-Code: unauthorized
Date: Tue, 04 Oct 2022 22:27:22 GMT
Content-Length: 48
{“code”:”unauthorized”,”message”:”Unauthorized”}Writing veeam_ONE_backupinfrastructure to InfluxDB
HTTP/1.1 401 Unauthorized
Content-Type: application/json; charset=utf-8
X-Influxdb-Build: OSS
X-Influxdb-Version: v2.4.0
X-Platform-Error-Code: unauthorized
Date: Tue, 04 Oct 2022 22:27:22 GMT
Content-Length: 48
Obrigada.
Hello,
That seems like a problem with the authentication, go to the swagger and give it a try to authenticate there.
{“code”:”unauthorized”,”message”:”Unauthorized”}Writing veeam_ONE_backupinfrastructure to InfluxDB
HTTP/1.1 401 Unauthorized
Content-Type: application/json; charset=utf-8
X-Influxdb-Build: OSS
X-Influxdb-Version: v2.4.0
X-Platform-Error-Code: unauthorized
Date: Tue, 28 Jan 2025 05:56:34 GMT
Content-Length: 48
tried swigger it is allgood, what can be problem, please help me
Hello,
The script itself might be using a very old API, let me try to review and see what is going on.
Thank you