
 Greetings friends, I have been showing since 2016 all the goodness of Telegraf, InfluxDB, and Grafana. And I do not get tired since every day or week, I have new technologies, or hardware, that I want to monitor to have more detailed control of all my environment.
Just a few days ago I acquired an NVIDIA RTX 3090, one of the best graphics cards we can find today, and of course, the first thing I thought was, I need to monitor this hardware that has cost more than any of my servers, which I already monitor without problems.
Dashboard for NVIDIA GPUs (extendable to AMD with a little work)
When we finish the entry we will have something similar to that Dashboard that will allow you to visualize: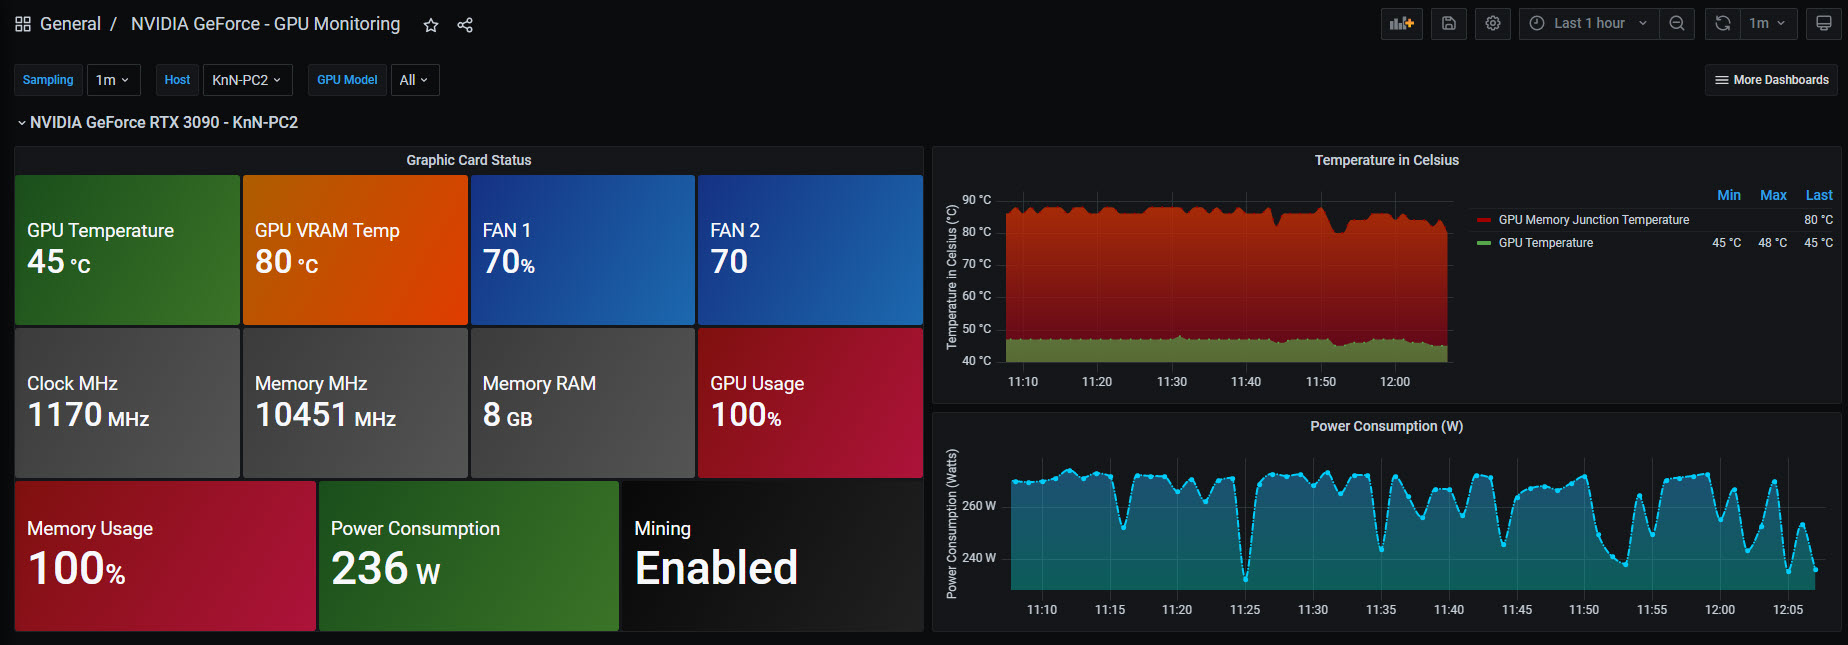
Dashboard – Summary
This dashboard, very useful and powerful shows us the following details:
- Filter by Host and by GPU type – In case we have several PC/VDI, it will show us the model as well.
- Temperatures – The GPU temperature, and very important (only in 3070, 3080 and 3090) the VRAM temperature, better known as GPU Memory Junction.
- In addition to having them see the most recent, there is a graph with the history of it.
- Fans – The percentage at which our fans are spinning, in case we have more fans, you will have to modify the query.
- Speeds – The dashboards show the current clock speeds of the GPU, memory, etc.
- Consumption – The consumption in the percentage of our GPU and its memory.
- Power Consumption – Power consumption in Watts, which is useful to calculate how much you are spending.
- Besides having it to see the most recent, there is a graph with the history of the same.
- Mining – It is something simple, if the memory is at 100% constant, the mining is active. No other application puts the memory at 100% for such a long period of time.
Topology with all logical components
This entry is different from the previous ones, it includes more components, some of them for a fee such as HWInfo64 Pro, I leave the complete image here: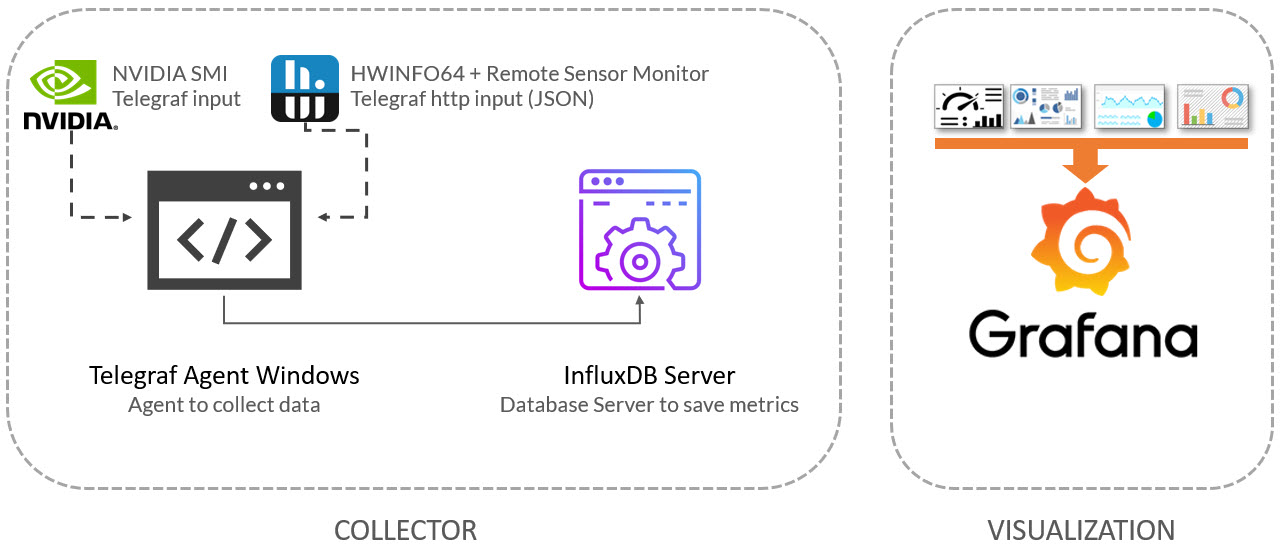
We will need telegraf for Windows, I guess you have already followed the steps to send information to InfluxDB, in addition, we will need to have installed the NVIDIA drivers, which include a small application called nvidia_smi, and finally, we also need HWInfo64 Pro, which allows us to use shared memory and Remote Sensor Monitor that presents the data in a local web in JSON format.
Small system requirements before continuing
We will need to verify that we have NVIDIA smi installed, for it from a CMD, we go to the following directory C:\Program Files Corporation Corporation smi> and we launch the executable, to see the result:
C:\Program Files\NVIDIA Corporation\NVSMI>nvidia-smi.exe
Sun May 23 12:30:07 2021
+-----------------------------------------------------------------------------+
| NVIDIA-SMI 466.27       Driver Version: 466.27       CUDA Version: 11.3     |
|-------------------------------+----------------------+----------------------+
| GPU  Name            TCC/WDDM | Bus-Id        Disp.A | Volatile Uncorr. ECC |
| Fan  Temp  Perf  Pwr:Usage/Cap|         Memory-Usage | GPU-Util  Compute M. |
|                               |                      |               MIG M. |
|===============================+======================+======================|
|   0  NVIDIA GeForce ... WDDM  | 00000000:02:00.0  On |                  N/A |
| 70%   45C    P2   261W / 280W |   8576MiB / 24576MiB |    100%      Default |
|                               |                      |                  N/A |
+-------------------------------+----------------------+----------------------+
All right, let’s go to the next step, we install the latest version of HWInfo64, we need to buy a license and put it in the folder where we have installed HWInfo64. If we run the application, in sensor mode only, we will see the following, very accurate and interesting data about our GPU: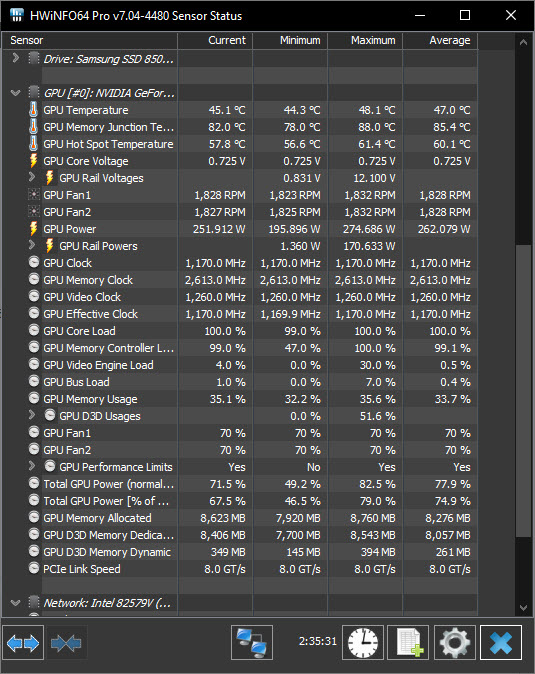
Finally, we will have to enable that we can connect to the shared memory, as simple as clicking on the icon and activating it: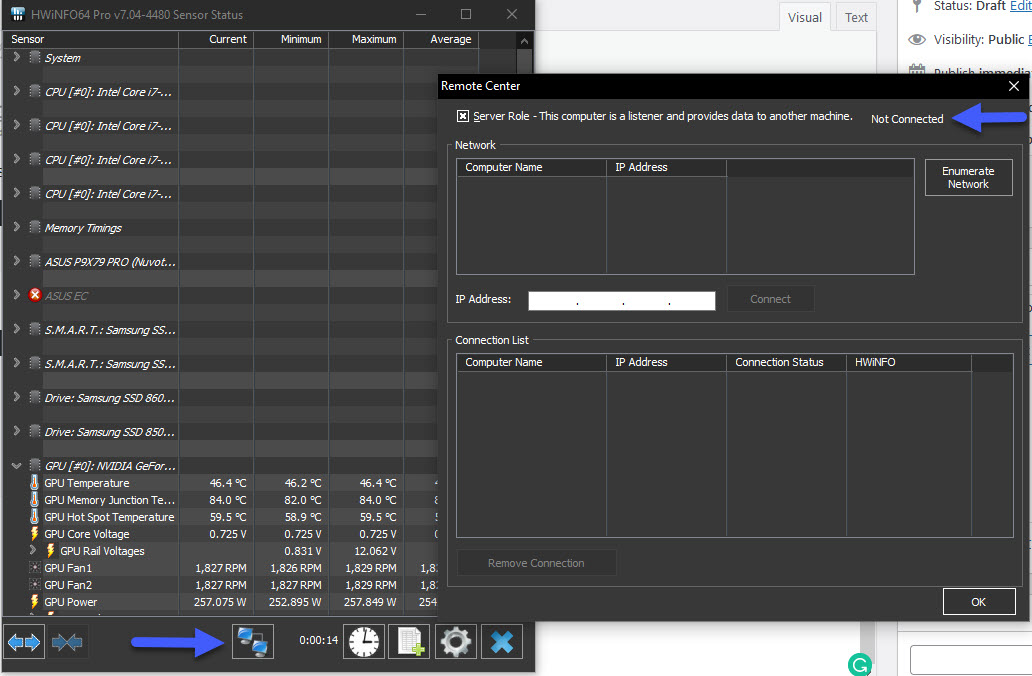 Minimize now the application, and download the Addon called Remote Sensor Monitor from its official website:
From a CMD, we launch the Remote Sensor Monitor with the following parameters:
"Remote Sensor Monitor.exe" --gpuz=0 --aida64=0 --ohm=0
This will show us the next message, all good and ready:
Starting Remote Sensor Monitor on port 55555...

HWiNFO process found! Enabling HWiNFO...

Please wait for the web server to start.......Web server running

Press [ENTER] to quit
Which is fantastic news, already from our browser, we go to http://localhost:55555/ and we will see the following: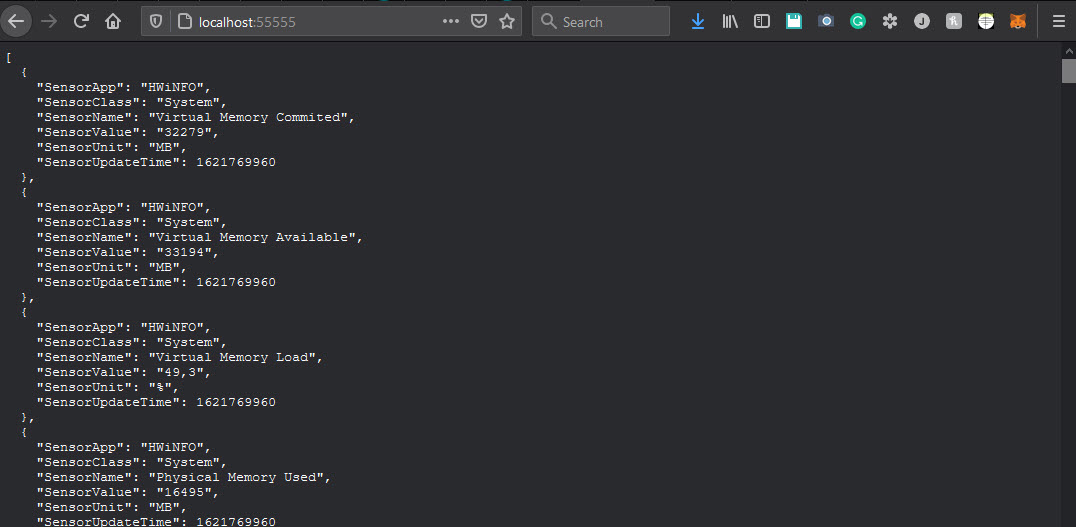
Configuration of the telegraf.conf file
We have almost everything ready, we have one last step, activate these two plugins inside the telegraf.conf configuration file, as simple as adding at the end of the file the following:
# Pulls statistics from nvidia GPUs attached to the host
# Pulls statistics from nvidia GPUs attached to the host
[[inputs.nvidia_smi]]
  ## Optional: path to nvidia-smi binary, defaults to $PATH via exec.LookPath
   bin_path = "C:\\Program Files\\NVIDIA Corporation\\NVSMI\\nvidia-smi.exe"

  ## Optional: timeout for GPU polling
  # timeout = "5s"

[[inputs.http]]
#URL for ESXi for ARM data in JSON format
urls = ["http://localhost:55555/"]
method = "GET"
#Overwrite measurement name from default `http` to `hwinfo_stats`
name_override = "hwinfo_stats"

#Exclude url and host items from tags
tagexclude = ["url"]

#Data from HTTP in JSON format
data_format = "json"

#Set hwinfo metadata as tags
tag_keys = ["SensorName", "SensorUnit"]

#JSON values to set as string fields
json_string_fields = ["SensorValue"]

insecure_skip_verify = true
This is all, we restart, or start the telegraf service and go to grafana.
Grafana Dashboards
I created a Dashboard from scratch by selecting the best requests to the database, finalizing the colors, thinking about the graphics and how to display them, and everything is automated to fit our environment without any problems and without having to edit anything manually. The Dashboard can be found here, once imported, you can use the top drop-down menus to select between different pcs, cards, etc:
Importing the Grafana Dashboard the easy way
So you don’t have to waste hours configuring a new Dashboard, and ingesting and debugging what you want, I have already created a wonderful Dashboard with everything you need to monitor our environment in a very simple way, it will look like the image I showed you above. Select the name you want and enter the ID: 14478, which is the unique ID of the Dashboard, or the URL:
 With the drop-down we could choose between GPU, PCs, etc.:Please leave your comments here, or on GitHub, thanks a lot for reading!
I hope you like it, and I would like to leave you the complete series here, so you can start playing with the plugins that I have been telling you about all these years:
- Looking for the Perfect Dashboard: InfluxDB, Telegraf, and Grafana – Part I (Installing InfluxDB, Telegraf, and Grafana on Ubuntu 20.04 LTS)
- En busca del Dashboard perfecto: InfluxDB, Telegraf y Grafana – Parte II (Instalar agente Telegraf en Nodos remotos Linux)
- En busca del Dashboard perfecto: InfluxDB, Telegraf y Grafana – Parte III Integración con PRTG
- En busca del Dashboard perfecto: InfluxDB, Telegraf y Grafana – Parte IV (Instalar agente Telegraf en Nodos remotos Windows)
- En busca del Dashboard perfecto: InfluxDB, Telegraf y Grafana – Parte V (Activar inputs específicos, Red, MySQL/MariaDB, Nginx)
- En busca del Dashboard perfecto: InfluxDB, Telegraf y Grafana – Parte VI (Monitorizando Veeam)
- En busca del Dashboard perfecto: InfluxDB, Telegraf y Grafana – Parte VII (Monitorizar vSphere)
- En busca del Dashboard perfecto: InfluxDB, Telegraf y Grafana – Parte VIII (Monitorizando Veeam con Enterprise Manager)
- En busca del Dashboard perfecto: InfluxDB, Telegraf y Grafana – Parte IX (Monitorizando Zimbra Collaboration)
- En busca del Dashboard perfecto: InfluxDB, Telegraf y Grafana – Parte X (Grafana Plugins)
- En busca del Dashboard perfecto: InfluxDB, Telegraf y Grafana – Parte XI – (Monitorizando URL e IPS con Telegraf y Ping)
- Looking for the Perfect Dashboard: InfluxDB, Telegraf, and Grafana – Part XII (Native Telegraf Plugin for vSphere)
- Looking for the Perfect Dashboard: InfluxDB, Telegraf, and Grafana – Part XIII (Veeam Backup for Microsoft Office 365 v4)
- Looking for the Perfect Dashboard: InfluxDB, Telegraf, and Grafana – Part XIV – Veeam Availability Console
- Looking for the Perfect Dashboard: InfluxDB, Telegraf, and Grafana – Part XV (IPMI Monitoring of our ESXi Hosts)
- Looking for Perfect Dashboard: InfluxDB, Telegraf, and Grafana – Part XVI (Performance and Advanced Security of Veeam Backup for Microsoft Office 365)
- Looking for the Perfect Dashboard: InfluxDB, Telegraf, and Grafana – Part XVII (Showing Dashboards on Two Monitors Using Raspberry Pi 4)
- En busca del Dashboard perfecto: InfluxDB, Telegraf y Grafana – Parte XVIII – Monitorizar temperatura y estado de Raspberry Pi 4
- Looking for the Perfect Dashboard: InfluxDB, Telegraf, and Grafana – Part XIX (Monitoring Veeam with Enterprise Manager) Shell Script
- Looking for the Perfect Dashboard: InfluxDB, Telegraf, and Grafana – Part XXIV (Monitoring Veeam Backup for Microsoft Azure)
- Looking for the Perfect Dashboard: InfluxDB, Telegraf, and Grafana – Part XXV (Monitoring Power Consumption)
- Looking for the Perfect Dashboard: InfluxDB, Telegraf, and Grafana – Part XXVI (Monitoring Veeam Backup for Nutanix)
- Looking for the Perfect Dashboard: InfluxDB, Telegraf, and Grafana – Part XXVII (Monitoring ReFS and XFS (block-cloning and reflink)
- Looking for the Perfect Dashboard: InfluxDB, Telegraf, and Grafana – Part XXVIII (Monitoring HPE StoreOnce)
- Looking for the Perfect Dashboard: InfluxDB, Telegraf, and Grafana – Part XXIX (Monitoring Pi-hole)
- Looking for the Perfect Dashboard: InfluxDB, Telegraf, and Grafana – Part XXIX (Monitoring Veeam Backup for AWS)
- Looking for the Perfect Dashboard: InfluxDB, Telegraf, and Grafana – Part XXXI (Monitoring Unifi Protect)
- Looking for the Perfect Dashboard: InfluxDB, Telegraf, and Grafana – Part XXXII (Monitoring Veeam ONE – experimental)
- Looking for the Perfect Dashboard: InfluxDB, Telegraf, and Grafana – Part XXXIII (Monitoring NetApp ONTAP)
- Looking for the Perfect Dashboard: InfluxDB, Telegraf, and Grafana – Part XXXIV (Monitoring Runecast)
- Looking for the Perfect Dashboard: InfluxDB, Telegraf, and Grafana – Part XXXV (GPU Monitoring)
- Looking for the Perfect Dashboard: InfluxDB, Telegraf, and Grafana – Part XXXVI (Monitoring Goldshell Miners – JSONv2)
- Looking for the Perfect Dashboard: InfluxDB, Telegraf, and Grafana – Part XXXVII (Monitoring Veeam Backup for Google Cloud Platform)
- En Busca del Dashboard perfecto: InfluxDB, Telegraf y Grafana – Parte XXXVIII (Monitorizando Temperatura y Humedad con Xiaomi Mijia)
- Looking for the Perfect Dashboard: InfluxDB, Telegraf, and Grafana – Part XL (Veeam Backup for Microsoft 365 – Restore Audit)
- Looking for the Perfect Dashboard: InfluxDB, Telegraf, and Grafana – Part XLI (Veeam Backup for Salesforce)
- Looking for the Perfect Dashboard: InfluxDB, Telegraf, and Grafana – Part XLII (Veeam ONE v12 Audit Events)
- Looking for the Perfect Dashboard: InfluxDB, Telegraf, and Grafana – Part XLIII (Monitoring QNAP using SNMP v3)
- Looking for the Perfect Dashboard: InfluxDB, Telegraf, and Grafana – Part XLIV (Monitoring Veeam Backup & Replication API)
- Looking for the Perfect Dashboard: InfluxDB, Telegraf, and Grafana – Part XLV (Monitoring Synology using SNMP v3)
- Looking for the Perfect Dashboard: InfluxDB, Telegraf, and Grafana – Part XLVI (Monitoring NVIDIA Jetson Nano)
- Looking for the Perfect Dashboard: InfluxDB, Telegraf, and Grafana – Part XLVII (Monitoring Open WebUI)
- Looking for the Perfect Dashboard: InfluxDB, Telegraf, and Grafana – Part XLVIII (Monitoring Veeam Data Platform Advanced)
- Looking for the Perfect Dashboard: InfluxDB, Telegraf, and Grafana – Part XLIX (Monitoring Unofficial Veeam ONE Node Exporter)
Have you also tried with AMD GPUs like Radeon Instinct MI25?
Hello, I have not tried any other ones, no.