
 Greetings friends, what an exciting entry I bring you today. For years I have been receiving the request to do a SNMP Grafana dashboard. Honestly I always found SNMP quite complex for what it should be, I understand there are MIBs, and it is an standard, but it is just too complex to build upon it. Luckily telegraf comes to the rescue and the config is quite easy.
Some more SNMP dashboard might come, for example one for ESXis, but for now I wanted to start with a critical component of my homelab which is my NAS, where my backups reside, etc.
Grafana Dashboard for QNAP Devices, using SNMP v3
When you finish the entry you will have something similar to this. It might be different according to your device, like more drives, less drives, more fans, etc. You can quickly filter by time on the top right, and sampling to obtain more or less granularity on the charts.

Dashboard – Summary
- QNAP Overview – On the top bar we can find a quick overview of our QNAP, number of devices, model, RAM, CPU Cores, Ethernets, etc.
- Fan Speed – The speed at which our FANs are working.
- System Temperature – This will show you the different main temperatures, like CPU, and system.
- Disk Temperatures – Another great one, it will show you all your disks speeds. Usually the firstt two drives are used for NVMe cache on all models. Adjust it if not.
- CPU/RAM/Network Usage – Time-series metrics with the consumption of the different resources by time.
- Disk IOPS/Volume Usage – Two visualizations about disks and volumes, the first one on the left, aiming at the IOPS consumed, on the right showing us the consumption of disk in %.
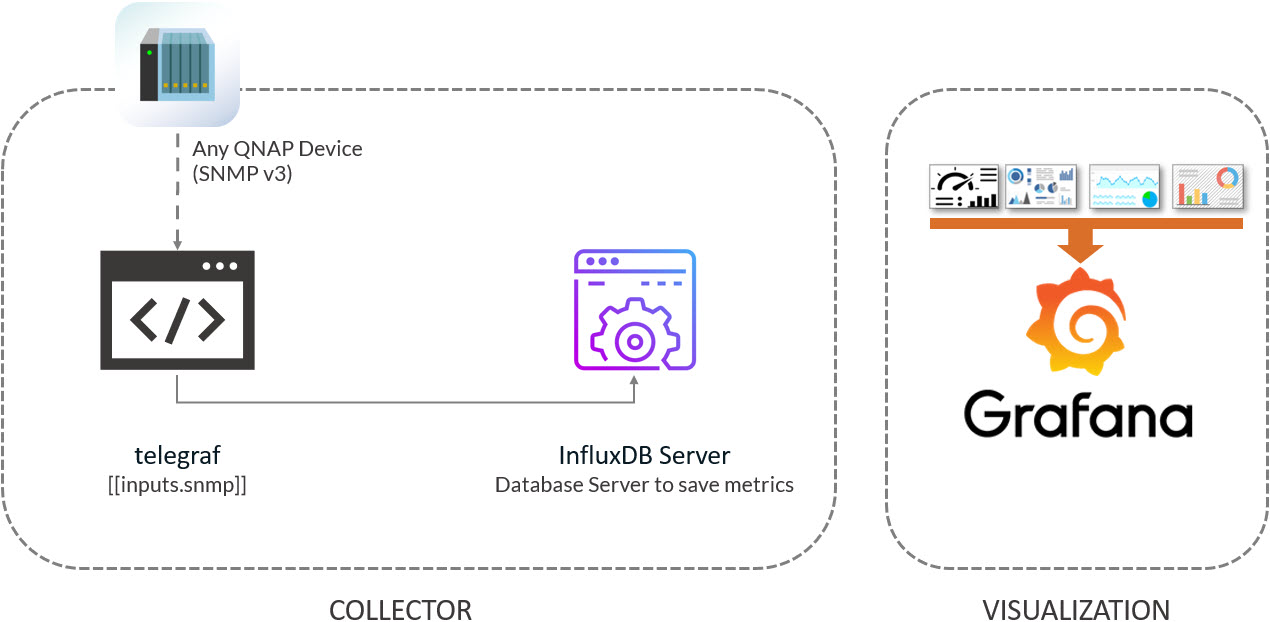
Topology with all logical components
This entry is very similar to the previous ones, we will use telegraf to collect the SNMP information from our QNAPs, from there we will send them to InfluxDB, and visualize them with Grafana . The design would be something similar to this:
QNAP, and Telegraf SNMPv3 Configuration
For the very first time on the series, I am using SNMP. I must admit it is not my cup of tea, but it is true that sometimes it is the easiest way to take data out, not that easy to put together into a monitoring tool. There are a few steps we need to perform on our QNAP. I used the great work from https://gitlab.com/artkrz/telegraf-qnap as inspiration for some steps.
SNMP v3 configuration, and MIB Download
We are going to use SNMP, but not v1/v2, random without user/pass. We are going to to do it right, and secure. So we enable SNMP, version 3, and we configure authentication, and privacy. Next please download the QNAP MIB as well:
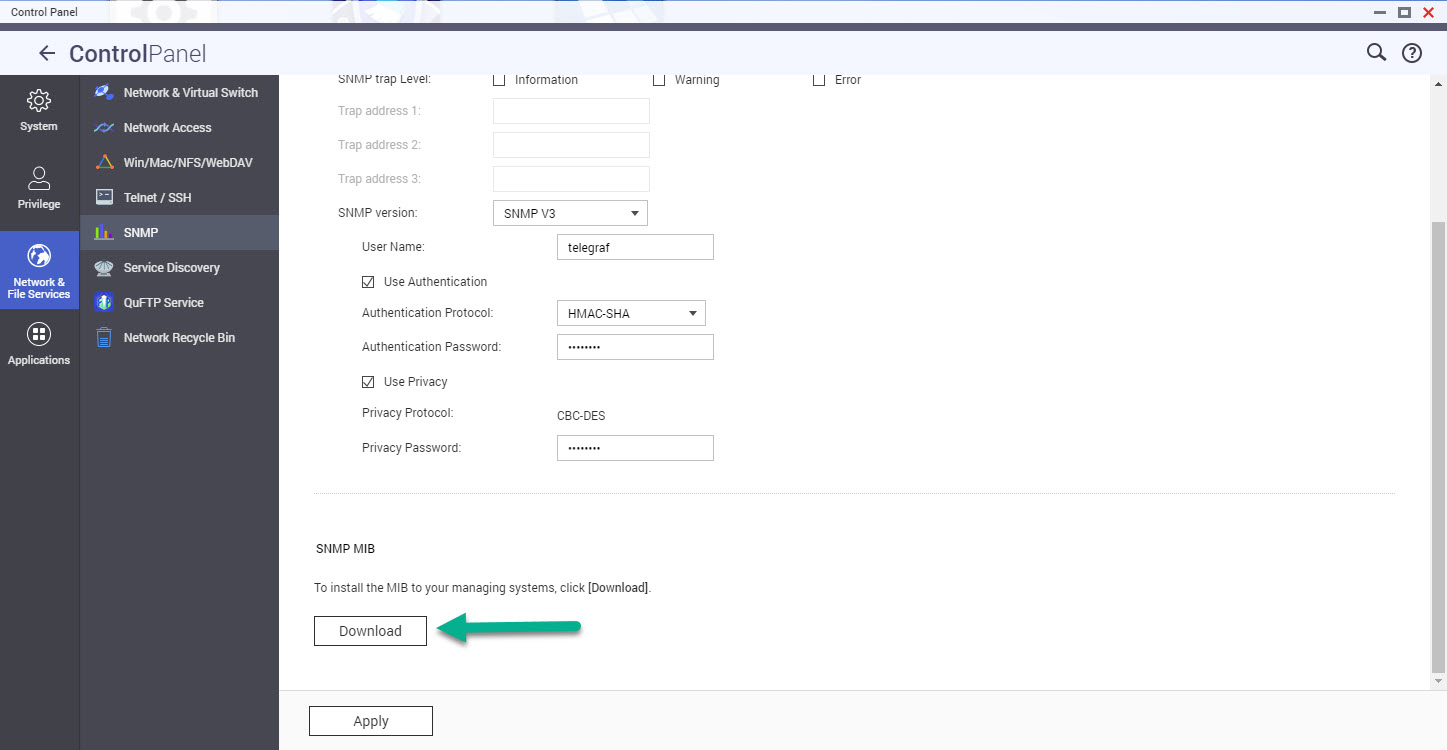 With these little steps, we are all set at the QNAP level.
Telegraf additional steps, and configuration
SNMP is a bit particular, so first of let’s install the next package on your telegraf server (use yum if RHEL based):
sudo apt-get install snmp snmp-mibs-downloader
And now, make sure you put the NAS.mib on the correct path:
/usr/share/snmp/mibs/
Under your vi /etc/snmp/snmp.conf make sure you have the next enabled
nano /etc/snmp/snmp.conf

# As the snmp packages come without MIB files due to license reasons, loading
# of MIBs is disabled by default. If you added the MIBs you can reenable
# loading them by commenting out the following line.
mibs +ALL

# If you want to globally change where snmp libraries, commands and daemons
# look for MIBS, change the line below. Note you can set this for individual
# tools with the -M option or MIBDIRS environment variable.
#
# mibdirs /usr/share/snmp/mibs:/usr/share/snmp/mibs/iana:/usr/share/snmp/mibs/ietf
Alright, we are finally ready to rock & roll, let’s create the specific QNAP configuration under /etc/telegraf/telegraf.d/qnap.conf with the next content. Please replace your QNAPIP, the username used on the SNMPv3 on QNAP, and the passwords used for auth and privacy:
[[inputs.snmp]]
   # List of agents to poll
   agents = [ "YOURQNAPIP" ]
   # Polling interval
   interval = "30s"
   # Timeout for each SNMP query.
   timeout = "30s"
   # Number of retries to attempt within timeout.
   retries = 3
   # The GETBULK max-repetitions parameter
   max_repetitions = 10
   # Measurement name
   name = "snmp.QNAP"
   #SNMPv3
   version = 3
   sec_name = "YOURUSERNAME"
   auth_protocol = "SHA"
   auth_password = "YOURPASS"
   sec_level = "authPriv"
   priv_protocol = "DES"
   priv_password = "YOUROTHERPASS"


  ##
  ## System Details & Metrics
  ##
  # CPU
  [[inputs.snmp.field]]
  name = "name"
  oid = "NAS-MIB::enclosureName.1"
  is_tag = true

  [[inputs.snmp.table]]
    name = "snmp.QNAP.cpuTable"
    oid = "NAS-MIB::cpuTable"
    [[inputs.snmp.table.field]]
      name = "cpuIndex"
      oid = "NAS-MIB::cpuIndex"
      is_tag = true
    [[inputs.snmp.table.field]]
      name = "cpuID"
      oid = "NAS-MIB::cpuID"
      is_tag = true
    [[inputs.snmp.table.field]]
      name = "cpuUsage"
      oid = "NAS-MIB::cpuUsage"

  #  System
  #  Enclosures
  [[inputs.snmp.table]]
    name = "snmp.QNAP.systemTable"
  # Memory
  [[inputs.snmp.table.field]]
    name = "systemTotalMemEX"
    oid = "NAS-MIB::systemTotalMemEX"
  [[inputs.snmp.table.field]]
    name = "systemFreeMemEX"
    oid = "NAS-MIB::systemFreeMemEX"
  # System temp
  [[inputs.snmp.table.field]]
    name = "cpu-TemperatureEX"
    oid = "NAS-MIB::cpu-TemperatureEX"
  [[inputs.snmp.table.field]]
    name = "systemTemperatureEX"
    oid = "NAS-MIB::systemTemperatureEX"
  # Uptime
  [[inputs.snmp.table.field]]
    name = "systemUptime"
    oid = "NAS-MIB::systemUptimeEX"
  # Uptime
  [[inputs.snmp.table.field]]
    name = "systemCPU-UsageEX"
    oid = "NAS-MIB::systemCPU-UsageEX"

  #  Enclosures
  [[inputs.snmp.table]]
    name = "snmp.QNAP.enclosureTable"
    oid = "NAS-MIB::enclosureTable"
    # Memory
    [[inputs.snmp.table.field]]
      name = "enclosureID"
      oid = "NAS-MIB::enclosureID"
      is_tag = true
    [[inputs.snmp.table.field]]
      name = "enclosureModel"
      oid = "NAS-MIB::enclosureModel"
      is_tag = true
    [[inputs.snmp.table.field]]
      name = "enclosureName"
      oid = "NAS-MIB::enclosureName"
      is_tag = true
    [[inputs.snmp.table.field]]
      name = "enclosureSystemTemp"
      oid = "NAS-MIB::enclosureSystemTemp"

  #  Fan
  [[inputs.snmp.table]]
    name = "snmp.QNAP.systemFanTableEx"
    oid = "NAS-MIB::systemFanTableEx"
    [[inputs.snmp.table.field]]
      name = "sysFanIndexEX"
      oid = "NAS-MIB::sysFanIndexEX"
      is_tag = true
    [[inputs.snmp.table.field]]
      name = "sysFanDescrEX"
      oid = "NAS-MIB::sysFanDescrEX"
      is_tag = true
    [[inputs.snmp.table.field]]
      name = "sysFanSpeedEX"
      oid = "NAS-MIB::sysFanSpeedEX"

  #  Power
  [[inputs.snmp.table]]
    name = "snmp.QNAP.systemPowerTable"
    oid = "NAS-MIB::systemPowerTable"
    [[inputs.snmp.table.field]]
      name = "systemPowerIndex"
      oid = "NAS-MIB::systemPowerIndex"
      is_tag = true
    [[inputs.snmp.table.field]]
      name = "systemPowerID"
      oid = "NAS-MIB::systemPowerID"
      is_tag = true
    [[inputs.snmp.table.field]]
      name = "systemPowerEnclosureID"
      oid = "NAS-MIB::systemPowerEnclosureID"
      is_tag = true
    [[inputs.snmp.table.field]]
      name = "systemPowerStatus"
      oid = "NAS-MIB::systemPowerStatus"
    [[inputs.snmp.table.field]]
      name = "systemPowerFanSpeed"
      oid = "NAS-MIB::systemPowerFanSpeed"
    [[inputs.snmp.table.field]]
      name = "systemPowerFanSpeed"
      oid = "NAS-MIB::systemPowerFanSpeed"
    [[inputs.snmp.table.field]]
      name = "systemPowerTemp"
      oid = "NAS-MIB::systemPowerTemp"

  #  Interfaces
  [[inputs.snmp.table]]
    name = "snmp.QNAP.systemIfTableEx"
    oid = "NAS-MIB::systemIfTableEx"
    [[inputs.snmp.table.field]]
      name = "ifIndexEX"
      oid = "NAS-MIB::ifIndexEX"
      is_tag = true
    [[inputs.snmp.table.field]]
      name = "ifDescrEX"
      oid = "NAS-MIB::ifDescrEX"
      is_tag = true
    [[inputs.snmp.table.field]]
      name = "ifPacketsReceivedEX"
      oid = "NAS-MIB::ifPacketsReceivedEX"
    [[inputs.snmp.table.field]]
      name = "ifPacketsSentEX"
      oid = "NAS-MIB::ifPacketsSentEX"
    [[inputs.snmp.table.field]]
      name = "ifErrorPacketsEX"
      oid = "NAS-MIB::ifErrorPacketsEX"

  #  Interfaces
  [[inputs.snmp.table]]
    name = "snmp.QNAP.ifXTable"
    oid = "IF-MIB::ifXTable"
    [[inputs.snmp.table.field]]
      name = "ifName"
      oid = "IF-MIB::ifName"
      is_tag = true
    [[inputs.snmp.table.field]]
      name = "ifHCInOctets"
      oid = "IF-MIB::ifHCInOctets"
    [[inputs.snmp.table.field]]
      name = "ifHCOutOctets"
      oid = "IF-MIB::ifHCOutOctets"

  ##
  ## Disk Details & Metrics
  ##
  #  Disk
  [[inputs.snmp.table]]
    name = "snmp.QNAP.diskTable"
    oid = "NAS-MIB::diskTable"
    [[inputs.snmp.table.field]]
      name = "diskIndex"
      oid = "NAS-MIB::diskIndex"
      is_tag = true
    [[inputs.snmp.table.field]]
      name = "diskID"
      oid = "NAS-MIB::diskID"
      is_tag = true
    [[inputs.snmp.table.field]]
      name = "diskEnclosureID"
      oid = "NAS-MIB::diskEnclosureID"
      is_tag = true
    [[inputs.snmp.table.field]]
      name = "diskSummary"
      oid = "NAS-MIB::diskSummary"
    [[inputs.snmp.table.field]]
      name = "diskTemperture"
      oid = "NAS-MIB::diskTemperture"
    [[inputs.snmp.table.field]]
      name = "diskSmartInfo"
      oid = "NAS-MIB::diskSmartInfo"
    [[inputs.snmp.table.field]]
      name = "diskGlobalSpare"
      oid = "NAS-MIB::diskGlobalSpare"
    [[inputs.snmp.table.field]]
      name = "diskModel"
      oid = "NAS-MIB::diskModel"
      is_tag = true
    [[inputs.snmp.table.field]]
      name = "diskCapacity"
      oid = "NAS-MIB::diskCapacity"
      is_tag = true

  ##
  ## Volume Details & Metrics
  ##
  #  Volumes
  [[inputs.snmp.table]]
    name = "snmp.QNAP.systemVolumeTableEx"
    oid = "NAS-MIB::systemVolumeTableEx"
    [[inputs.snmp.table.field]]
      name = "sysVolumeIndexEX"
      oid = "NAS-MIB::sysVolumeIndexEX"
      is_tag = true
    [[inputs.snmp.table.field]]
      name = "sysVolumeDescrEX"
      oid = "NAS-MIB::sysVolumeDescrEX"
      is_tag = true
    [[inputs.snmp.table.field]]
      name = "sysVolumeFSEX"
      oid = "NAS-MIB::sysVolumeFSEX"
      is_tag = true
    [[inputs.snmp.table.field]]
      name = "sysVolumeTotalSizeEX"
      oid = "NAS-MIB::sysVolumeTotalSize"
    [[inputs.snmp.table.field]]
      name = "sysVolumeFreeSize"
      oid = "NAS-MIB::sysVolumeFreeSizeEX"
    [[inputs.snmp.table.field]]
      name = "sysVolumeStatus"
      oid = "NAS-MIB::sysVolumeStatusEX"

  ##
  ## Disk Performance Details & Metrics
  ##
  #  Disk Performance
  [[inputs.snmp.table]]
    name = "snmp.QNAP.diskPerformanceTable"
    oid = "NAS-MIB::diskPerformanceTable"
    [[inputs.snmp.table.field]]
      name = "diskPerformanceIndex"
      oid = "NAS-MIB::diskPerformanceIndex"
      is_tag = true
    [[inputs.snmp.table.field]]
      name = "blvID"
      oid = "NAS-MIB::blvID"
      is_tag = true
    [[inputs.snmp.table.field]]
      name = "iops"
      oid = "NAS-MIB::iops"
    [[inputs.snmp.table.field]]
      name = "latency"
      oid = "NAS-MIB::latency"

  #  JBOD
  [[inputs.snmp.table]]
    name = "snmp.QNAP.jBODHdTable1"
    oid = "NAS-MIB::jBODHdTable1"
    [[inputs.snmp.table.field]]
      name = "jBODHdIndex1"
      oid = "NAS-MIB::jBODHdIndex1"
      is_tag = true
    [[inputs.snmp.table.field]]
      name = "jBODHdDescr1"
      oid = "NAS-MIB::jBODHdDescr1"
      is_tag = true
    [[inputs.snmp.table.field]]
      name = "jBODHdTemperature1"
      oid = "NAS-MIB::sysVolumeFSEX"
    [[inputs.snmp.table.field]]
      name = "jBODHdStatus1"
      oid = "NAS-MIB::jBODHdStatus1"
    [[inputs.snmp.table.field]]
      name = "jBODHdModel1"
      oid = "NAS-MIB::jBODHdModel1"
      is_tag = true
    [[inputs.snmp.table.field]]
      name = "jBODHdCapacity1 "
      oid = "NAS-MIB::jBODHdCapacity1"
    [[inputs.snmp.table.field]]
      name = "jBODHdSmartInfo1"
      oid = "NAS-MIB::jBODHdSmartInfo1"
Let’s save it, and run a quick telegraf check.
How-to test telegraf’s configuration
Before we restart telegraf services or anything, let’s run the next command, it should give you some output similar to what you can see here:
root@tig-monitor:/home/oper# telegraf --test --config /etc/telegraf/telegraf.d/qnap.conf
2023-02-19T19:23:01Z I! Starting Telegraf 1.24.3
2023-02-19T19:23:01Z I! Available plugins: 222 inputs, 9 aggregators, 26 processors, 20 parsers, 57 outputs
2023-02-19T19:23:01Z I! Loaded inputs: snmp
2023-02-19T19:23:01Z I! Loaded aggregators:
2023-02-19T19:23:01Z I! Loaded processors:
2023-02-19T19:23:01Z W! Outputs are not used in testing mode!
2023-02-19T19:23:01Z I! Tags enabled: host=tig-monitor
> snmp.QNAP.cpuTable,agent_host=192.168.1.50,cpuID=2,cpuIndex=2,host=tig-monitor cpuUsage=1i 1676834608000000000
> snmp.QNAP.cpuTable,agent_host=192.168.1.50,cpuID=3,cpuIndex=3,host=tig-monitor cpuUsage=0i 1676834608000000000
> snmp.QNAP.cpuTable,agent_host=192.168.1.50,cpuID=4,cpuIndex=4,host=tig-monitor cpuUsage=0i 1676834608000000000
> snmp.QNAP.cpuTable,agent_host=192.168.1.50,cpuID=1,cpuIndex=1,host=tig-monitor cpuUsage=1i 1676834608000000000
> snmp.QNAP.systemTable,agent_host=192.168.1.50,host=tig-monitor cpu-TemperatureEX=59i,systemFreeMemEX=1931608064i,systemTemperatureEX=43i,systemTotalMemEX=4184276992i 1676834608000000000
> snmp.QNAP.enclosureTable,agent_host=192.168.1.50,enclosureID=33,enclosureModel=USB,host=tig-monitor enclosureSerialNum="--",enclosureSlot=4i,enclosureSystemTemp=0i 1676834609000000000
> snmp.QNAP.enclosureTable,agent_host=192.168.1.50,enclosureID=0,enclosureModel=TS-435XeU,enclosureName=nase80550,host=tig-monitor enclosureSerialNum="Q221I06176R",enclosureSlot=6i,enclosureSystemTemp=43i 1676834609000000000
> snmp.QNAP.enclosureTable,agent_host=192.168.1.50,enclosureID=32,enclosureModel=BOOT,host=tig-monitor enclosureSerialNum="--",enclosureSlot=1i,enclosureSystemTemp=0i 1676834609000000000
> snmp.QNAP.systemFanTableEx,agent_host=192.168.1.50,host=tig-monitor,sysFanDescrEX=System\ FAN\ 1,sysFanIndexEX=1 sysFanSpeedEX=2760i 1676834610000000000
> snmp.QNAP.systemFanTableEx,agent_host=192.168.1.50,host=tig-monitor,sysFanDescrEX=System\ FAN\ 2,sysFanIndexEX=2 sysFanSpeedEX=2700i 1676834610000000000
> snmp.QNAP.systemFanTableEx,agent_host=192.168.1.50,host=tig-monitor,sysFanDescrEX=System\ FAN\ 3,sysFanIndexEX=3 sysFanSpeedEX=2670i 1676834610000000000
> snmp.QNAP.systemPowerTable,agent_host=192.168.1.50,host=tig-monitor,systemPowerEnclosureID=0,systemPowerID=1,systemPowerIndex=1 systemPowerFanSpeed=-1i,systemPowerStatus=0i,systemPowerTemp=-1i 1676834614000000000
> snmp.QNAP.systemPowerTable,agent_host=192.168.1.50,host=tig-monitor,systemPowerEnclosureID=32,systemPowerID=1,systemPowerIndex=2 systemPowerFanSpeed=0i,systemPowerStatus=0i,systemPowerTemp=0i 1676834614000000000
> snmp.QNAP.systemPowerTable,agent_host=192.168.1.50,host=tig-monitor,systemPowerEnclosureID=33,systemPowerID=1,systemPowerIndex=3 systemPowerFanSpeed=0i,systemPowerStatus=0i,systemPowerTemp=0i 1676834614000000000
> snmp.QNAP.systemIfTableEx,agent_host=192.168.1.50,host=tig-monitor,ifDescrEX=eth0,ifIndexEX=1 ifErrorPacketsEX=0i,ifPacketsReceivedEX=207366i,ifPacketsSentEX=33180i 1676834614000000000
> snmp.QNAP.systemIfTableEx,agent_host=192.168.1.50,host=tig-monitor,ifDescrEX=eth1,ifIndexEX=2 ifErrorPacketsEX=0i,ifPacketsReceivedEX=0i,ifPacketsSentEX=0i 1676834614000000000
> snmp.QNAP.systemIfTableEx,agent_host=192.168.1.50,host=tig-monitor,ifDescrEX=eth2,ifIndexEX=3 ifErrorPacketsEX=0i,ifPacketsReceivedEX=221838i,ifPacketsSentEX=61151i 1676834614000000000
Grafana Dashboards
I created a Dashboard from scratch by selecting the best requests to the database, finishing off colors, thinking about graphics, and how to display them, and everything is automated so that it fits our environment without any problem and without having to edit anything manually. The Dashboard can be found here, once imported, you can use the top drop-down menus to select between the different variables:
Import Grafana Dashboards easily
I have already a wonderful Dashboard, ready just for you with everything you need to monitor our environment in a very simple way. Select the name you want and enter the ID: 18229, which is the unique ID of the Dashboard, or the URL:
 With the menus above you can display and adjust the Dashboard to your different choices:
I hope you like it, and I would like to leave you the complete series here, so you can start playing with the plugins that I have been telling you about all these years:
- Looking for the Perfect Dashboard: InfluxDB, Telegraf, and Grafana – Part I (Installing InfluxDB, Telegraf, and Grafana on Ubuntu 20.04 LTS)
- En busca del Dashboard perfecto: InfluxDB, Telegraf y Grafana – Parte II (Instalar agente Telegraf en Nodos remotos Linux)
- En busca del Dashboard perfecto: InfluxDB, Telegraf y Grafana – Parte III Integración con PRTG
- En busca del Dashboard perfecto: InfluxDB, Telegraf y Grafana – Parte IV (Instalar agente Telegraf en Nodos remotos Windows)
- En busca del Dashboard perfecto: InfluxDB, Telegraf y Grafana – Parte V (Activar inputs específicos, Red, MySQL/MariaDB, Nginx)
- En busca del Dashboard perfecto: InfluxDB, Telegraf y Grafana – Parte VI (Monitorizando Veeam)
- En busca del Dashboard perfecto: InfluxDB, Telegraf y Grafana – Parte VII (Monitorizar vSphere)
- En busca del Dashboard perfecto: InfluxDB, Telegraf y Grafana – Parte VIII (Monitorizando Veeam con Enterprise Manager)
- En busca del Dashboard perfecto: InfluxDB, Telegraf y Grafana – Parte IX (Monitorizando Zimbra Collaboration)
- En busca del Dashboard perfecto: InfluxDB, Telegraf y Grafana – Parte X (Grafana Plugins)
- En busca del Dashboard perfecto: InfluxDB, Telegraf y Grafana – Parte XI – (Monitorizando URL e IPS con Telegraf y Ping)
- Looking for the Perfect Dashboard: InfluxDB, Telegraf, and Grafana – Part XII (Native Telegraf Plugin for vSphere)
- Looking for the Perfect Dashboard: InfluxDB, Telegraf, and Grafana – Part XIII (Veeam Backup for Microsoft Office 365 v4)
- Looking for the Perfect Dashboard: InfluxDB, Telegraf, and Grafana – Part XIV – Veeam Availability Console
- Looking for the Perfect Dashboard: InfluxDB, Telegraf, and Grafana – Part XV (IPMI Monitoring of our ESXi Hosts)
- Looking for Perfect Dashboard: InfluxDB, Telegraf, and Grafana – Part XVI (Performance and Advanced Security of Veeam Backup for Microsoft Office 365)
- Looking for the Perfect Dashboard: InfluxDB, Telegraf, and Grafana – Part XVII (Showing Dashboards on Two Monitors Using Raspberry Pi 4)
- En busca del Dashboard perfecto: InfluxDB, Telegraf y Grafana – Parte XVIII – Monitorizar temperatura y estado de Raspberry Pi 4
- Looking for the Perfect Dashboard: InfluxDB, Telegraf, and Grafana – Part XIX (Monitoring Veeam with Enterprise Manager) Shell Script
- Looking for the Perfect Dashboard: InfluxDB, Telegraf, and Grafana – Part XXIV (Monitoring Veeam Backup for Microsoft Azure)
- Looking for the Perfect Dashboard: InfluxDB, Telegraf, and Grafana – Part XXV (Monitoring Power Consumption)
- Looking for the Perfect Dashboard: InfluxDB, Telegraf, and Grafana – Part XXVI (Monitoring Veeam Backup for Nutanix)
- Looking for the Perfect Dashboard: InfluxDB, Telegraf, and Grafana – Part XXVII (Monitoring ReFS and XFS (block-cloning and reflink)
- Looking for the Perfect Dashboard: InfluxDB, Telegraf, and Grafana – Part XXVIII (Monitoring HPE StoreOnce)
- Looking for the Perfect Dashboard: InfluxDB, Telegraf, and Grafana – Part XXIX (Monitoring Pi-hole)
- Looking for the Perfect Dashboard: InfluxDB, Telegraf, and Grafana – Part XXIX (Monitoring Veeam Backup for AWS)
- Looking for the Perfect Dashboard: InfluxDB, Telegraf, and Grafana – Part XXXI (Monitoring Unifi Protect)
- Looking for the Perfect Dashboard: InfluxDB, Telegraf, and Grafana – Part XXXII (Monitoring Veeam ONE – experimental)
- Looking for the Perfect Dashboard: InfluxDB, Telegraf, and Grafana – Part XXXIII (Monitoring NetApp ONTAP)
- Looking for the Perfect Dashboard: InfluxDB, Telegraf, and Grafana – Part XXXIV (Monitoring Runecast)
- Looking for the Perfect Dashboard: InfluxDB, Telegraf, and Grafana – Part XXXV (GPU Monitoring)
- Looking for the Perfect Dashboard: InfluxDB, Telegraf, and Grafana – Part XXXVI (Monitoring Goldshell Miners – JSONv2)
- Looking for the Perfect Dashboard: InfluxDB, Telegraf, and Grafana – Part XXXVII (Monitoring Veeam Backup for Google Cloud Platform)
- En Busca del Dashboard perfecto: InfluxDB, Telegraf y Grafana – Parte XXXVIII (Monitorizando Temperatura y Humedad con Xiaomi Mijia)
- Looking for the Perfect Dashboard: InfluxDB, Telegraf, and Grafana – Part XL (Veeam Backup for Microsoft 365 – Restore Audit)
- Looking for the Perfect Dashboard: InfluxDB, Telegraf, and Grafana – Part XLI (Veeam Backup for Salesforce)
- Looking for the Perfect Dashboard: InfluxDB, Telegraf, and Grafana – Part XLII (Veeam ONE v12 Audit Events)
- Looking for the Perfect Dashboard: InfluxDB, Telegraf, and Grafana – Part XLIII (Monitoring QNAP using SNMP v3)
- Looking for the Perfect Dashboard: InfluxDB, Telegraf, and Grafana – Part XLIV (Monitoring Veeam Backup & Replication API)
- Looking for the Perfect Dashboard: InfluxDB, Telegraf, and Grafana – Part XLV (Monitoring Synology using SNMP v3)
- Looking for the Perfect Dashboard: InfluxDB, Telegraf, and Grafana – Part XLVI (Monitoring NVIDIA Jetson Nano)
- Looking for the Perfect Dashboard: InfluxDB, Telegraf, and Grafana – Part XLVII (Monitoring Open WebUI)
- Looking for the Perfect Dashboard: InfluxDB, Telegraf, and Grafana – Part XLVIII (Monitoring Veeam Data Platform Advanced)
- Looking for the Perfect Dashboard: InfluxDB, Telegraf, and Grafana – Part XLIX (Monitoring Unofficial Veeam ONE Node Exporter)
Thanks Jorge. SNMP is never easy.
Hi Jorge;
I did qnap configuration. I wrote the necessary information in the necessary places in the qnap.conf file but I am getting an error during testing. error code :
2023-03-07T07:27:52Z E! [telegraf] Error running agent: error loading config file /etc/telegraf/telegraf.d/qnap.conf: error parsing data: line 493: key `name’ is in conflict with line 1e9d
Hello, that is weird, there is no such line as 493 on my qnap.conf, I just have 293 lines. I have copied/paste it again, please review it and copy/paste it again. Are you using nano? or vi? No additional code is getting there?
Thanks!
yes there are 293 lines. but this is the error. I downloaded the config file and opened it in notepad++. likewise 293 lines. I can’t understand why it is showing 493 lines on the error screen.
That is very strange, have you done all the SNMP steps, downloading the MIB, etc?
yes, I made the snmtp settings on qnap as in the article. I downloaded mib and copied it to /usr/share/snmp/mibs/ folder. I filled in the config file according to my own information. So I did everything according to the article.
Hello again for a different issue.
I have installed and got it working with just 1 qnap. Whenever I try to add a second one with below settings:
# List of agents to poll
agents = [ “192.168.2.249”, “192.168.2.20” ]
I am getting no data and the log says:
telegraf [inputs.snmp] Collection took longer than expected; not complete after interval of 30s
I have changed my intervals to 600s and time out to 360s without luck. BTW I tried to add separate conf files for each qnap too and that didn’t work either.
Any thoughts? (Influx V2, telegraf 1.26, Grafana 9.? Qnap1: TS 1263U Qnap2: TS 431P2
Thank you for the great tutorial. I have written a question here but it got lost.
I am trying to add two of my Qnapunits to dahsboard. They show data when you select from the filter one by one but if you select “all” then it throws no data to all panels. telegraf test giving results for both of the units well, and again if I choose one unit I can see their data separately, but of course I want to see both units in one dashboard.
Influx V2, Telegraf 1.26 and Grafana 9.2 on Ubuntu
Hello,
I do not have two QNAPS to try. Did you resolved the issue of collecting data right?
Let me see how the variables are made, one second.
Hello again and thank you for response,
I am collecting data allright, I just can not see both of the units same time. Here selected all:
https://ibb.co/pjRw0pV
Here Selected first unit:
https://ibb.co/pjRw0pV
And here is the other unit selected:
https://ibb.co/pjRw0pV
And total ram and uptime info is working if I select transformers one by one. Thats another issue and it can be resolve itself when I see both units in the same time. I suppose it is because its working when I select transformers in the edit table window.
Yes I have resolved the getting info issue and successfully got nearly all the info dahsboard requests. I just can not see both units in the same time. I have to choose it from the model dropdown. One by one seems working but when I select “all” then it throws no data to all panels.
I might misunderstand but will you look into your code or do you need me to share my variables with you? Thank you 🙂
Hi,
When I import the dashboard to Grafana, it shows these errors:
Templating [qnapmodel]
Error updating options: InfluxDB Error: error parsing query: found FROM, expected SELECT, DELETE, SHOW, CREATE, DROP, EXPLAIN, GRANT, REVOKE, ALTER, SET, KILL at line 1, char 1
Templating [qnaphostname]
Error updating options: InfluxDB Error: error parsing query: found FROM, expected SELECT, DELETE, SHOW, CREATE, DROP, EXPLAIN, GRANT, REVOKE, ALTER, SET, KILL at line 1, char 1
Templating [qnapdisk]
Error updating options: InfluxDB Error: error parsing query: found FROM, expected SELECT, DELETE, SHOW, CREATE, DROP, EXPLAIN, GRANT, REVOKE, ALTER, SET, KILL at line 1, char 1
Hello Julian,
Are you sure you are using InfluxDB v2.0, and you are using buckets, and all yes?
Thank you!
What about 2 qnap units at the same time 😀 Could you find a chance to look at the variables? If you need me to do testing I will gladly contribute. I am writing comments on github under the name : sinankizar. If you could open a repo for this that would be great 🙂
Hi Jorge,
You were right, I was using Influxdb v1, now it’s working.
Thanks
Hi Jorge,
thank you for the great tutorials!
I imported the dashboard, but I get no data at all. The variable drop down menus are empty.
I ran the variable queries directly in InfluxDB and I got the proper results (e.g. the QNAP model). I had to change the “v.defaultBucket” to the actual name of the bucket for the query to work. I tried replacing it with the bucket name in the dashboard variable query, but it didn’t help.
The data is available in InfluxDB. I can see results in the Infux queries. Grafana also sees the data in Explore.
My setup:
Telegraf 1.27 (native, on a raspberryPi)
InfluxDB 2.71 (docker container on QNAP)
Grafana 10.0.1 (docker container on QNAP)
Any ideas what to check?
Cheers!
Evripidis
Hello, you can open some widgets on Grafana dashboard, and copy those queries in influxdb directly changing the bucket. Do they load?
If so, I guess the error could be on how the InfluxDB is configured on Grafana maybe.
Any thoughts on 2 qnap’s at the sametime?
Will push fake data to my db this weekend and let you know.
Hello, any updates on multiple qnaps? Thank you
Hello,
Well, finally mate. After a few months, here you go. Full support for multi-QNAPS:
https://grafana.com/api/dashboards/18229/revisions/2/download
Give it a try and let me know.
Best regards
Thank you so much for the update and the great effort you put into this. Now everything works except a small detail which I can live with it. The RAM and Uptime is empty. This happened on first version and I’ve checked all the fields in the transform box. That allowed me to display the first host’s RAM amount and uptime but not for the second one. Again it is not that i can not live with.
Oh I see, let me check what happened mate. Thanks for letting me know.
Hello, you can grab the latest version of the dashboard:
https://grafana.com/grafana/dashboards/18229-qnap-dashboard-telegraf-snmp-influxdb/?tab=revisions
Cheers
MATE!! Thank you so much for your great effort. Now everything’s working. Thanks again.
I am glad I could be of help. Have a great day
Just wanted to comment that I could not find the root cause for the dashboard not working for me (see message from 28 June) and eventually gave up from frustration.
Tonight, I gave it one more shot. After going back and forth in the Grafana and InfluxDB documentation, I realised that the queries in your dashboard are in Flux, whereas the source in Grafana was configured to InfluxQL. I switched the configuration and…I saw the graphs…
Needless to say that I am looking for wall to start banging my head on 😀
(minor tweaking was needed in the disk temps widget, as I don’t have NVMe disks. It was also picking a temp of -1 for the external USB disk, so I had to change the field from diskID to diskIndex, because the external USB shares the same diskID as with an internal one (#3) )
Thanks for the dashboard and the work 🙂
Evripidis
Glad to see this working finally mate! Thanks for the feedback.
Hi jorgeuk,
I would really like to use the QNAP-Board to monitor my TS-1231XU-RP. The board looks absolutely perfect!
But I could not get the telegraf config work.
From Config-Test I get the output:
Error running agent: could not initialize input inputs.snmp: initializing table snmp.QNAP.cpuTable: translating: MIB search path: /root/.snmp/mibs:/usr/share/snmp/mibs:/usr/share/snmp/mibs/iana:/usr/share/snmp/mibs/ietf
Cannot find module (SNMPv2-MIB): At line 1 in (none)
Cannot find module (IF-MIB): At line 1 in (none)
…
Did not find ‘enterprises’ in module #-1 (/usr/share/snmp/mibs/NAS.mib)
Unlinked OID in QTS-MIB: qnap ::= { enterprises 55062 }
…
I run TIG-Stack in docker containers with the following versions;
Telegraf 1.24.4
InfluxDB 1.8.10
Grafana v9.5.6 (859a2654d3)
This is my NAS.mib: https://www.dropbox.com/scl/fi/mspqeqp5384276yildazv/NAS.mib?rlkey=ydsgexjjoj1ers46pbsg5aj9s&dl=0
This is my qnap.conf in /etc/telegraf/telegraf.d/ https://www.dropbox.com/scl/fi/cjv2kkogivbtj1y2g3r09/qnap.conf?rlkey=04npfrr3j0ivwfjxndgprx5kj&dl=0
These are the error messages I get from telegraf –test –config /etc/telegraf/telegraf.d/qnap.conf https://www.dropbox.com/scl/fi/3e8if49tnj8k2wivqy3k2/telegraf_test_config.txt?rlkey=uk4u7sgd0sijgt8mis8aeqg3l&dl=0
Would be nice if you could have a look at it and tell me what’s wrong.
Best Regards
Stephan
Hello, have you followed these steps ?
SNMP v3 configuration, and MIB Download
We are going to use SNMP, but not v1/v2, random without user/pass. We are going to to do it right, and secure. So we enable SNMP, version 3, and we configure authentication, and privacy. Next please download the QNAP MIB as well:
With these little steps, we are all set at the QNAP level.
SNMP is a bit particular, so first of let’s install the next package on your telegraf server (use yum if RHEL based):
sudo apt-get install snmp-mibs-downloader
And now, make sure you put the NAS.mib on the correct path:
/usr/share/snmp/mibs/
Hi jorgeuk,
thanks für your answer!
It seems that I miss snmp-mibs-downloader. But I can not find it with apt-get install.
When I trie to install it in my telegraf docker container, I get:
Package snmp-mibs-downloader is not available, but is referred to by another package.
This may mean that the package is missing, has been obsoleted, or
is only available from another source
E: Package ‘snmp-mibs-downloader’ has no installation candidate
I am running a Debian GNU/Linux 11 (bullseye) in the Docker Engine – Community Version 24.0.7, Docker Compose Version v2.21.0
Any ideas where to find the snmp-mibs-downloader?
Thanks, Kind Regards
Stephan
Hi jorgeuk,
I was now able to install snmp-mibs-downloader. I was just missing “deb http://ftp.de.debian.org/debian bullseye main non-free” in my /etc/apt/sources.list
Unfortunatelly I got a new error, I do not know how to fix:
telegraf –test –config /etc/telegraf/telegraf.d/qnap.conf
2023-11-18T20:58:37Z E! [telegraf] Error running agent: could not initialize input inputs.snmp: initializing table snmp.QNAP.cpuTable: translating: QTS-MIB::cpuTable: Unknown Object Identifier: exit status 2
Any Idea?
Thanks for your help!
Kind Regards
Stephan
Hello mate,
Unfortunately for some time, I think after the last updates to telegraf and grafana agents host model shows no data.
Hello,
Can you please tell me what grafana version you have, what telegraf version you have. And show me an example of what is not working?
Hello again mate;
Grafana v10.3.1
Telegraf 1.29.2
And here is the nodata boards:
https://imgur.com/a/EKKFpq0
Funny enough, the revision 2 of the dashboard doesn’t give me any errors.
Hello again mate.
I’m afraid Vsphere, qnap, and veeambackup grafana dashboards need an update. Every panel is under same panel and i think it is related to deprecation of “agent_host” in telegraf.
I am using veeam, vmware and this dashboard of yours and i am very happy with them all. Until Grafana 11 update broke your dashboards.
Issue is: Every instance is now under same panel. There are no repeating for other devices. I mean I have three qnaps and they all had separate panels when i am using grafana 10. After the update all the qnap graphs is gathered under same panel and this is very unreadable. I can’t share a screenshot because i have reveerted back to grafana 10 unfortunatley. It is sam for vmware, all the vm’s is under same panel, they don’t have sparate panels. For vbr, backups are not sparate anymore, there is only one “success” panel.
Hello again,
I have upgraded to grafana 11 and after the update all of your grafana dashboars shows same behaviour. They lost the repeting options and show all the hosts under same panel. I am able to attach screenshots this time:
Before:
https://imgur.com/a/o3skQRw
After:
https://imgur.com/a/EDNKMAX
Before:
https://imgur.com/a/HCzLUM7
After:
https://imgur.com/a/lsKr33R
Before:
https://imgur.com/a/aKumlK2
After:
https://imgur.com/a/Wtd9jQR
Grafana: 11
Influx: 2.7.6
Telegraf: 1.31.1
Hello,
Any updates? I saw you updated vmware dashboards, are you planning to update this and veeambackup dahsboards too?
Hello,
What is missing for this dashboard? Best regards
Without you NAS-MIB file this post is useless.
where exactly is jBODHdTable1 defined!?
Hit enter before finishing.
The QuTS MIB file is different to the QTS MIB file and your config references NAS-MIB, which differs from both QTS-MIB and QuTS-MIB.
So again without your actual NAS-MIB file, your post is useless.
A bit strong comment for some reason, why not asking would you mind sharing your NAS.mib or something, much better coming to someone who put the time to write this all, and do the telegraf.config step by step, and then say it is useless, great job.
Anyways, as I was surprised by your response, sadly surprised. I went ahead and logged in to my QNAP, running QTS 5.1.8. Went o the SNMP part, and clicked Download at the end of the page (like this blog post tells you to do), and to my not surprise, the file that downloads it is called NAS.MIB!!!!!
Please review your steps, share the exact QTS you are using, and next time be more polite before coming to someone blog to write nonsense really.
Just to let you know, updated to QTS 5.2.3, latest available fresh from January, downloading the NAS.mib from the same place, your QNAP. And the dashboard keep working as expected.
Long time no see, hope you are doing well mate!
I had to upgrade to QuTS Hero for ZFS support. I am using QTS hosts too. I can’t see the LUN or Shared folders stats in volumes section. It throws no data. other than that everything works flawlessly. Any chance to look into that?
Thanks in advance.
Hello, surely mate, please allow me a few weeks as I am on hols now.
Hello, have a nice vacation there.. see you soon refreshed with the updates I hope 😀
Hello mate,
By any chance did you have time for this:
Long time no see, hope you are doing well mate!
I had to upgrade to QuTS Hero for ZFS support. I am using QTS hosts too. I can’t see the LUN or Shared folders stats in volumes section. It throws no data. other than that everything works flawlessly. Any chance to look into that?
Thanks in advance.
Your positivity and enthusiasm are infectious It’s clear that you are truly passionate about what you do and it’s inspiring to see